이 프로젝트 정보
특히 2020년에는 순간적으로 집중적으로 집중적으로 내리는 폭우가 우리나라의 온실과 작물 수확량에 해로운 영향을 미쳤습니다. 안타깝게도 요즘은 일부 지역의 기후 변화로 인해 예상치 못한 과도한 강우가 더 자주 발생하고 상대적으로 보편화되었습니다. 한편, 다른 지역은 가뭄으로 고통 받고 있습니다. 2020년이 지나면서 우리 지역에는 집중호우로 인해 농작물과 가축이 피해를 입은 사건이 35건 이상 기록되고 있습니다. 농업 생산성 손실과 같은 과도한 강우로 인한 문제를 방지하고 방지하기 위한 솔루션에 기여하기 위해 저는 이 프로젝트를 출발점으로 생각했습니다.
주로 이 프로젝트에서 농업에 대한 과도한 강우 효과에 초점을 맞췄습니다. 그러나 과도한 강우량은 다음과 같은 수많은 위험을 초래할 수 있습니다. [1]:
<울> 인명 위험을 포함한 홍수,
건물 및 기반 시설 손상
농작물 및 가축 손실,
인명을 위협할 수 있는 산사태는 교통과 통신을 방해합니다.
최근 연구에 따르면 과도한 강우량은 직접적인 물리적 손상, 파종 및 수확 지연, 뿌리 성장 제한, 산소 결핍, 영양 손실 등 다양한 방식으로 작물 생산성에 영향을 미칠 수 있습니다. 따라서 너무 많은 비는 농업에 가뭄만큼 위험할 수 있습니다. "지난 30년 동안의 데이터는 과도한 강우가 과도한 열과 가뭄만큼 작물 수확량에 영향을 줄 수 있음을 시사합니다. 새로운 연구에서 일리노이 대학은 1981년부터 2016년까지의 작물 보험, 기후, 토양 및 옥수수 수확량 데이터를 연결했습니다. 이 연구는 몇 년 동안 과도한 강우로 인해 예상 수확량에 비해 미국 옥수수 수확량이 34%나 감소한 것으로 나타났습니다. 가뭄과 과도한 열로 인해 몇 년 동안 최대 37%의 수확량이 감소했습니다[2]" .
불행히도 조기 경보 시스템은 각 온실 또는 농장에 대한 적절하고 예비적인 지역 기상 데이터 없이는 농산물 및 공정에 대한 과도한 강우의 악화 효과를 완전히 방지하기에 충분하지 않습니다. 따라서 과도한 강우가 농업에 미치는 해로운 영향을 방지하기 위해 저는 이 프로젝트를 경제적인 원격 기상 관측소로 만들어 지역 기상 정보를 수집하고 해석하여 강우 강도를 보다 정확하게 예측하기로 결정했습니다.
딥 러닝과 신경망에 대한 연구를 한 후, 분류 모델을 기반으로 인공 신경망(ANN)을 구축하여 축적된 지역 날씨 데이터를 해석하여 주어진 클래스에 따른 강우 강도를 예측하기로 결정했습니다. 다음 연구에서 알 수 있듯이 연구자들은 강우량뿐만 아니라 기상 현상도 예측하기 위해 다양한 신경망 모델과 유형을 적용했습니다. "많은 실험에서 신경망을 사용하여 다양한 위치와 예측 범위에서 양적 강우량을 예측했습니다. 예를 들어 태국의 연구원들은 피드포워드 신경망을 사용하여 매우 정확한 예측값을 얻을 수 있었고 홍수 위험을 예측하기 위해 1~3시간의 예측 범위에서 양적 강우량을 예측할 수 있었습니다.신경망도 예측하는 데 사용되었습니다. 강우확률/강우량, 풍속, 기압 등과 같은 전통적인 예측값 외에 기상 현상은 토네이도를 예측하는 데 매우 성공적으로 사용되었습니다. 또한 호주의 연구원은 신경망을 사용하여 다양한 예측에서 안개를 식별하는 데 성공했습니다. 캔버라 국제공항에서 3시간에서 18시간 사이입니다[3]."
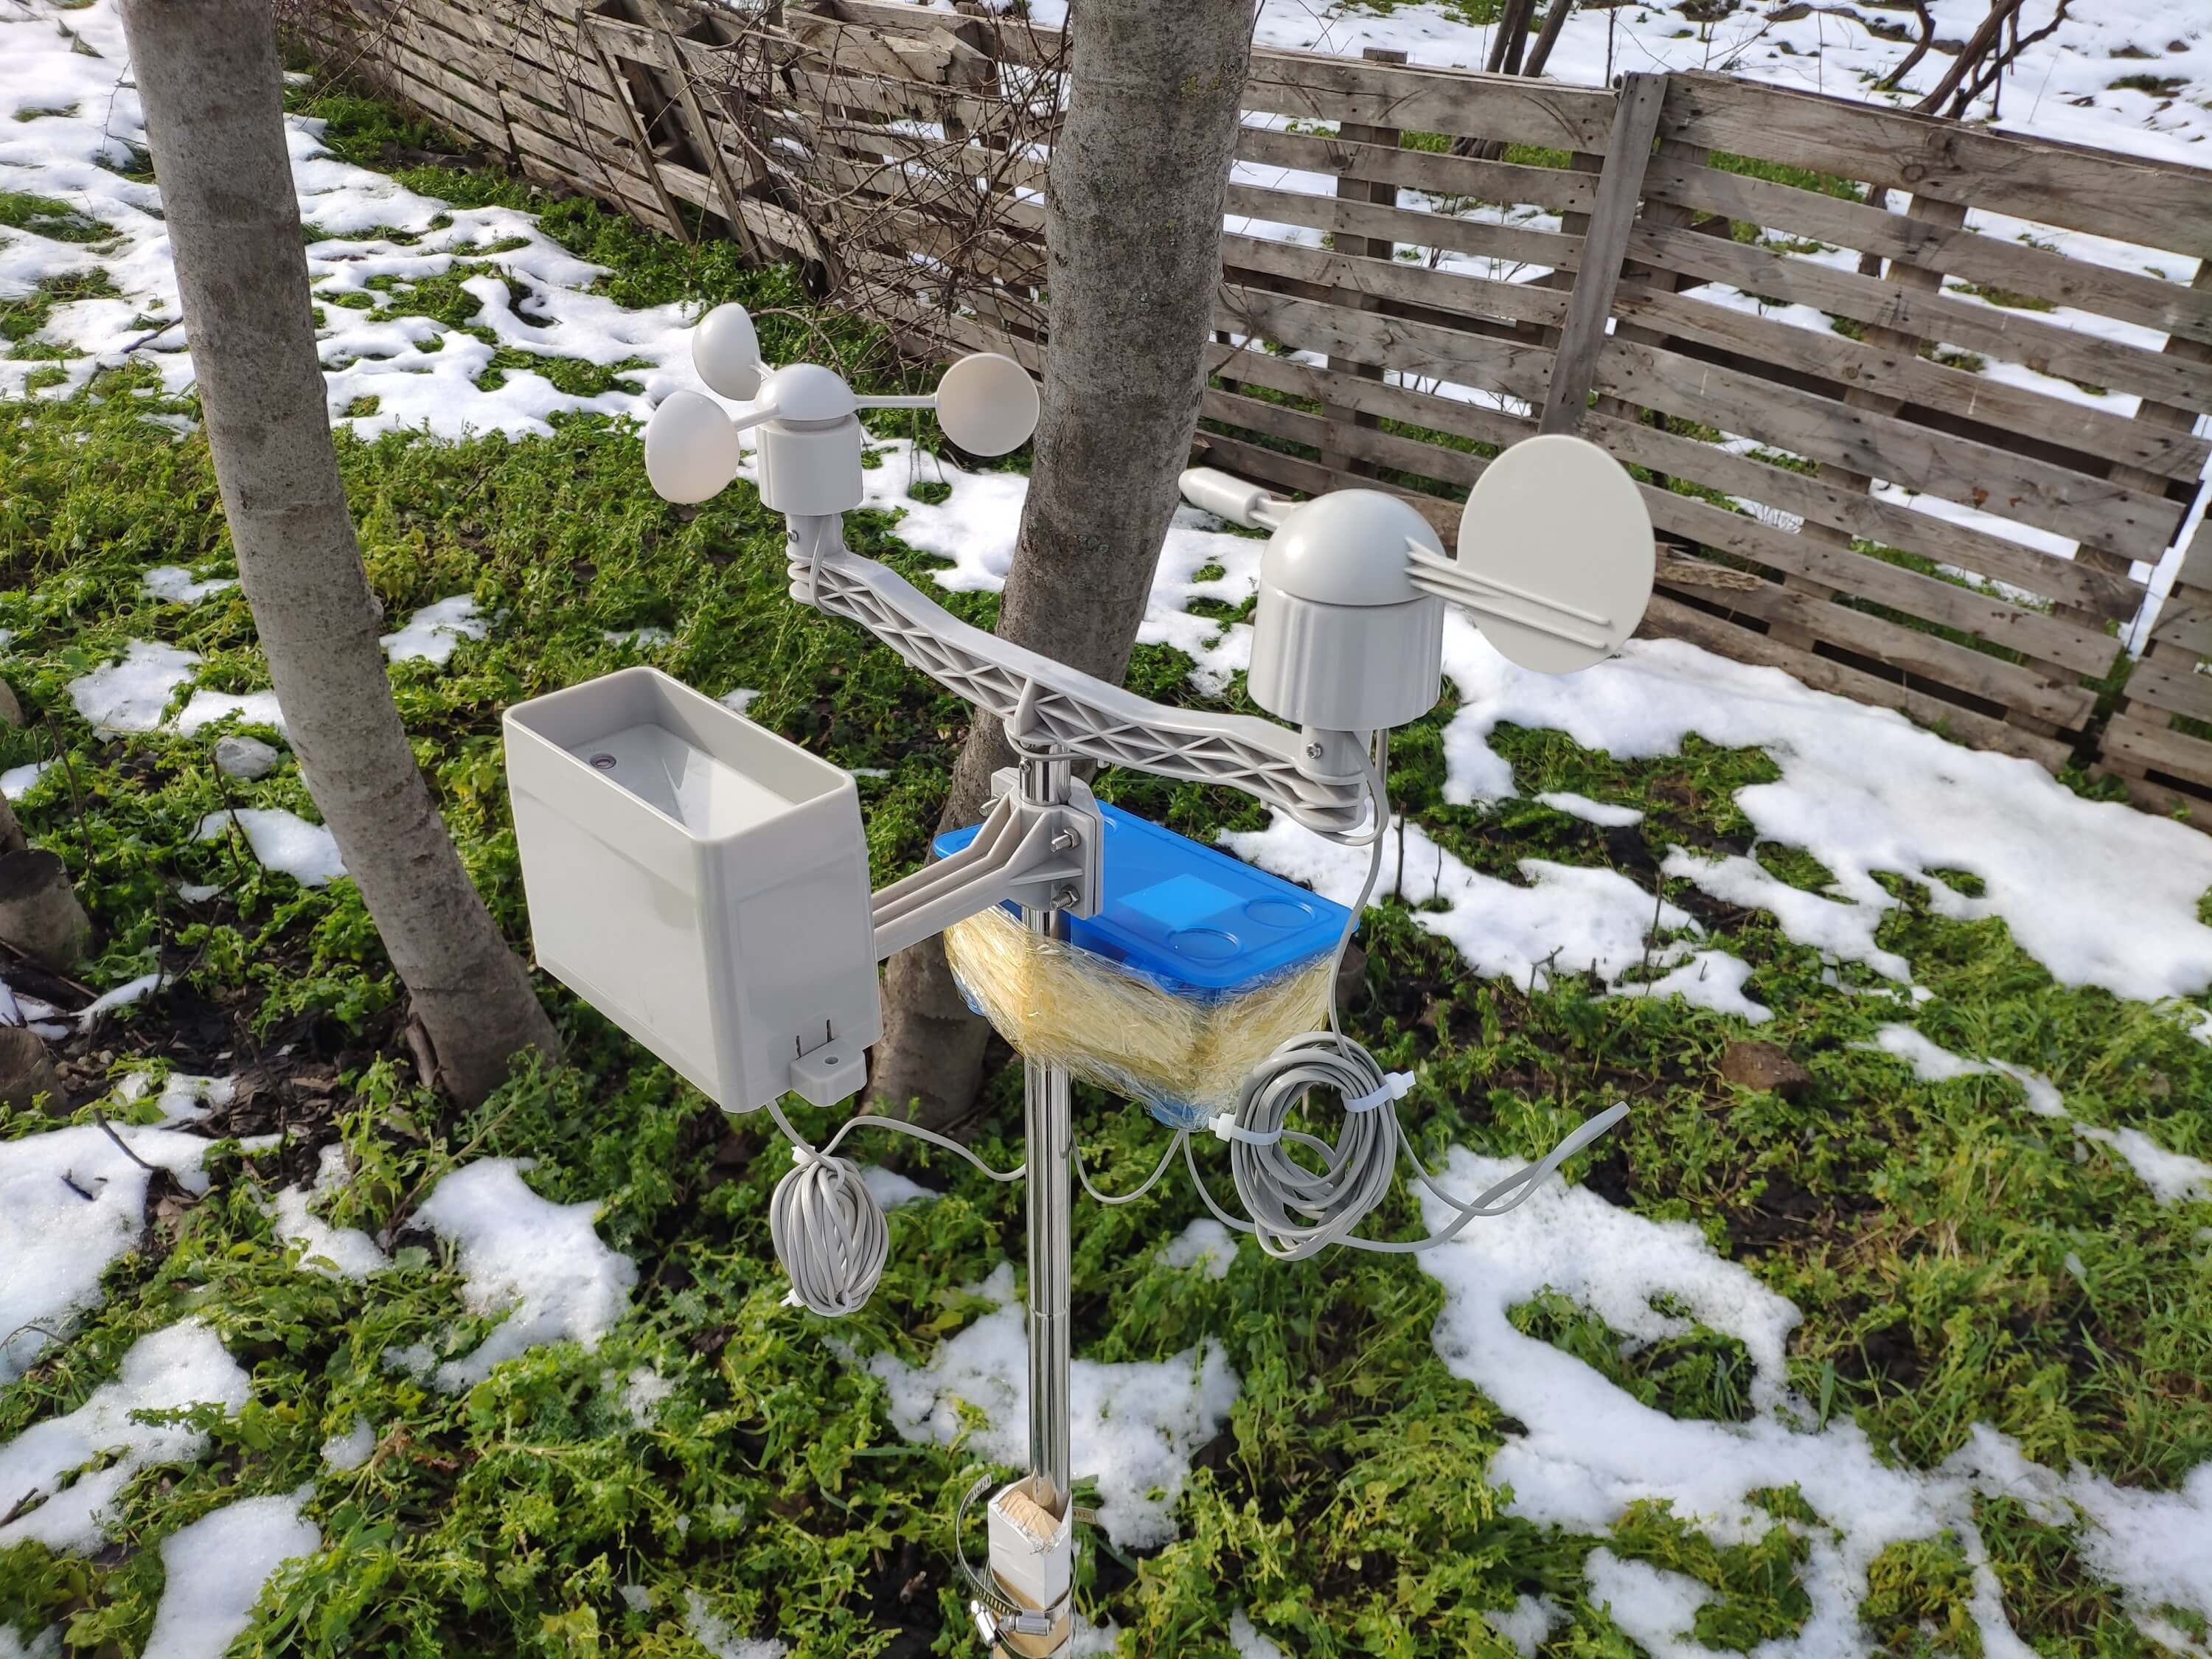
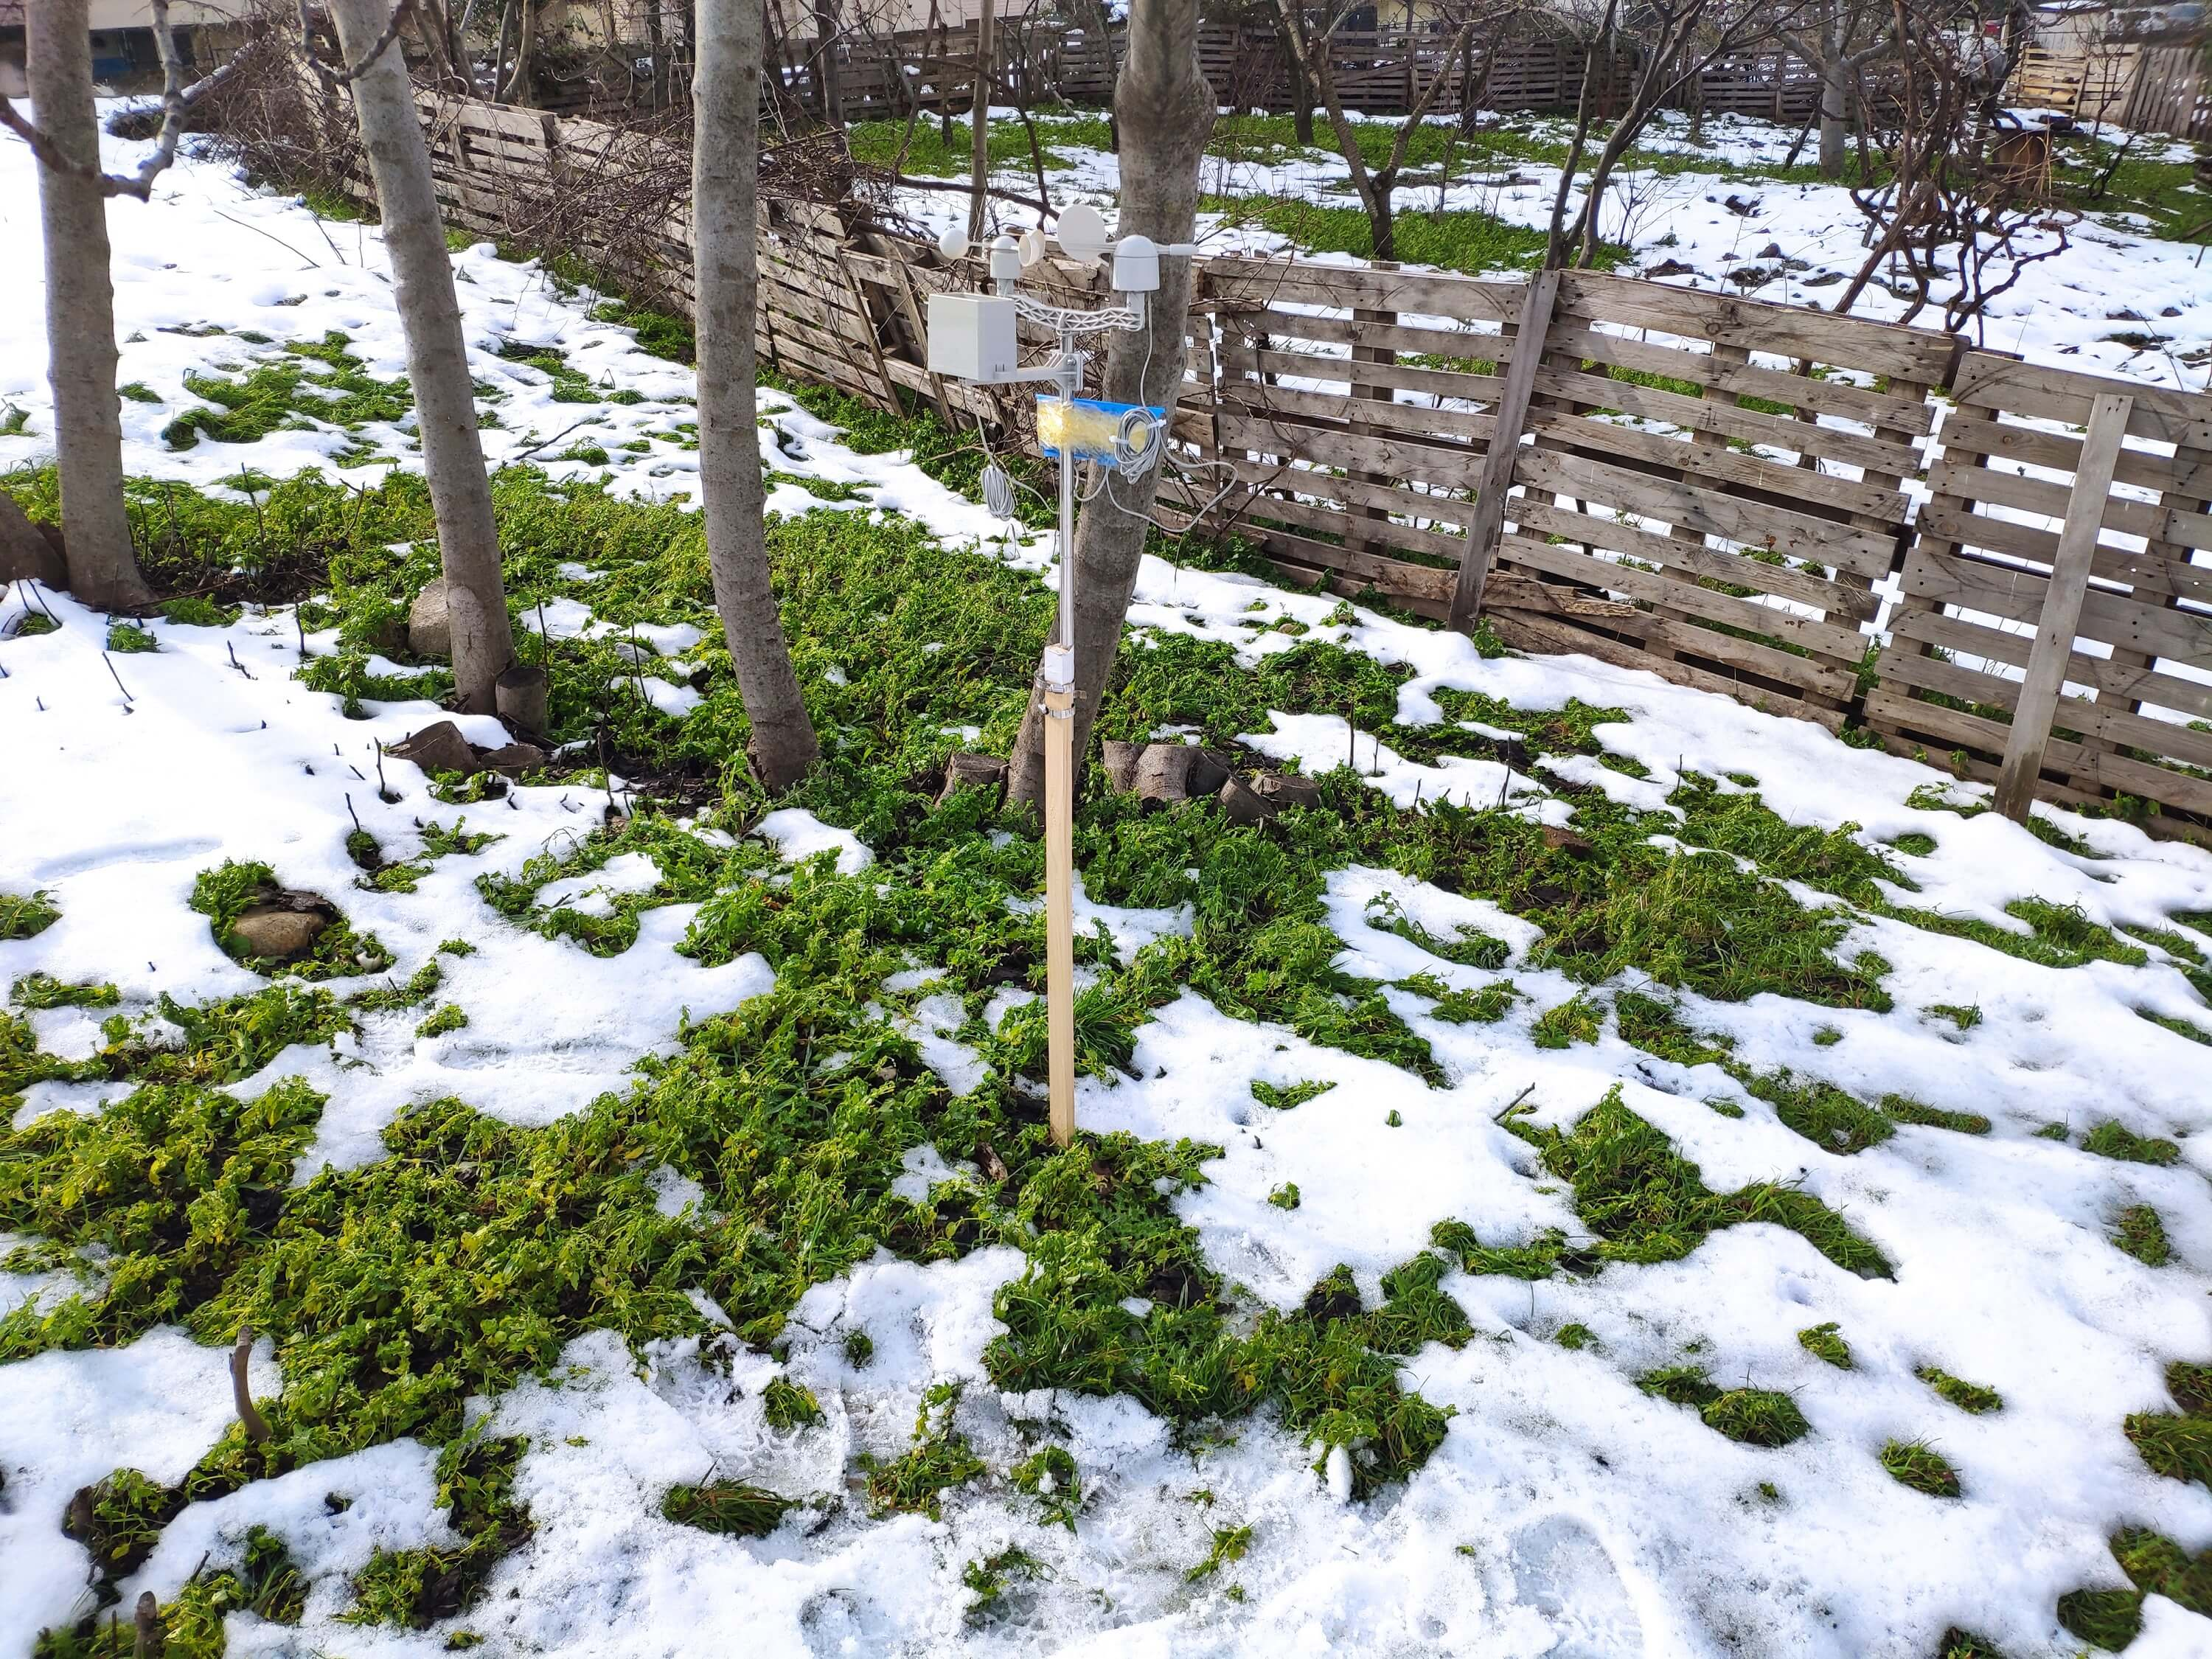
신경망 모델을 구축하고 테스트하기 전에 반경 3km의 발코니와 뒤뜰에서 3개월 이상 날씨 데이터를 수집하여 우리 동네의 날씨 정보를 보여주는 지역 날씨 데이터 세트를 만들었습니다. 극한의 기상 조건에서도 날씨 정보를 도출할 수 있도록 DFRobot의 풍속계, 풍향계 및 레인 버킷이 포함된 기상 관측소 키트를 두 가지 개발 보드와 함께 사용했습니다.
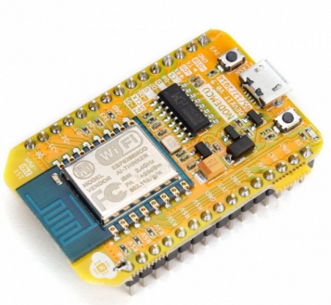
<울> NodeMCU ESP-12E(WiFi 지원)
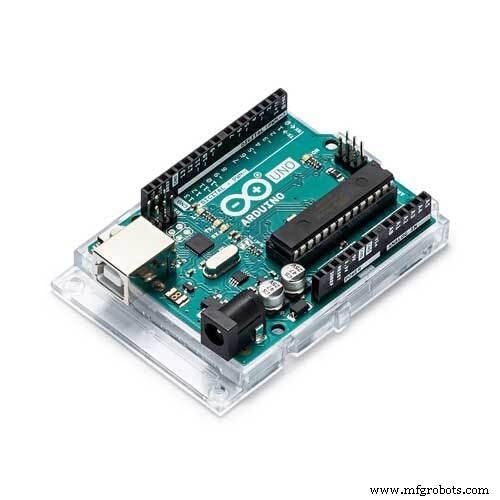
Arduino Uno + DFRobot SIM808 GPS/GPRS/GSM Shield(GPRS 지원)
따라서 라우터와 기상 관측소 사이의 거리가 너무 멀다면 발코니에서 WiFi를 통해 또는 GPRS를 통해 날씨 데이터를 전송할 수 있습니다.
클라우드 기반 스프레드시트 프로그램인 Google Sheets를 사용하여 기상 관측소에서 생성된 날씨 데이터를 수집하기로 결정했습니다. Google Sheets API를 사용하면 빅 데이터 세트를 만들고 새 정보를 추가하는 것이 간단하기 때문입니다. 그래서 PHP로 웹 애플리케이션을 개발하여 개발 위원회에서 전송한 날씨 데이터를 가져와 Google 스프레드시트의 스프레드시트에 추가했습니다.
5분마다 3개월 이상의 날씨 데이터 수집을 완료한 후 TensorFlow로 인공 신경망(ANN) 모델을 구축하여 강우 강도를 예측했습니다. 이론적으로 데이터 세트를 스케일링하고 정규화한 후 각 판독값에 대해 강우 강도 등급을 할당했습니다. 그런 다음 신경망 모델을 훈련하여 다음 클래스를 분류했습니다.
<울> 강우 없음
가벼운 강우량
보통의 강우량
폭우
격렬한 강우량
이것은 간단히 말해서 내 프로젝트입니다 😃
다음 단계에서는 코딩, 지역 날씨 데이터 수집, TensorFlow를 사용한 인공 신경망(ANN) 모델 구축에 대한 자세한 정보를 찾을 수 있습니다.
이 프로젝트를 후원해 주신 DFRobot에게 큰 감사를 드립니다.
DFRobot이 후원하는 제품:
⭐ 풍속계/풍향계/레인 버킷이 포함된 기상 관측소 키트 | 검사
⭐ Arduino용 SIM808 GPS/GPRS/GSM 실드 | 검사
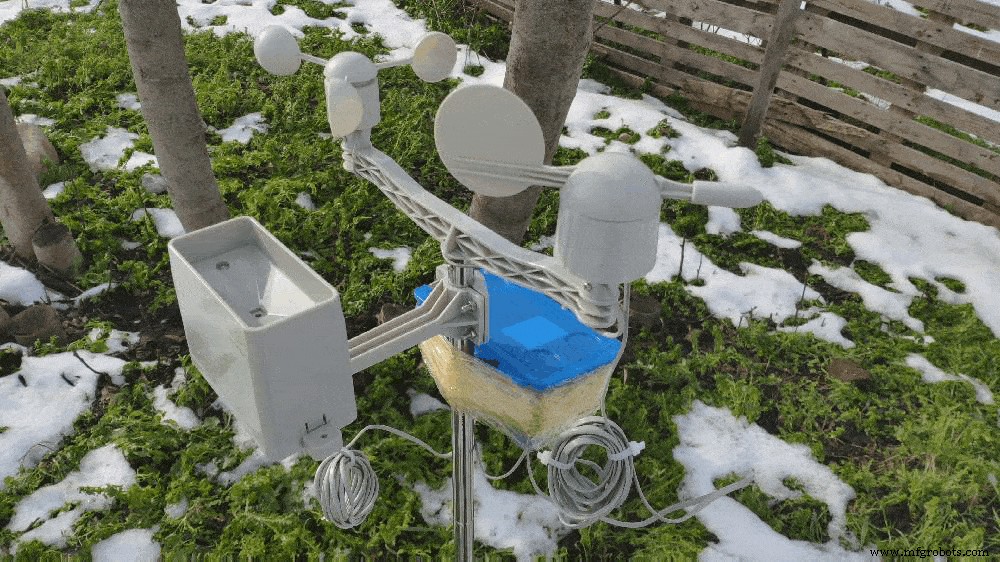
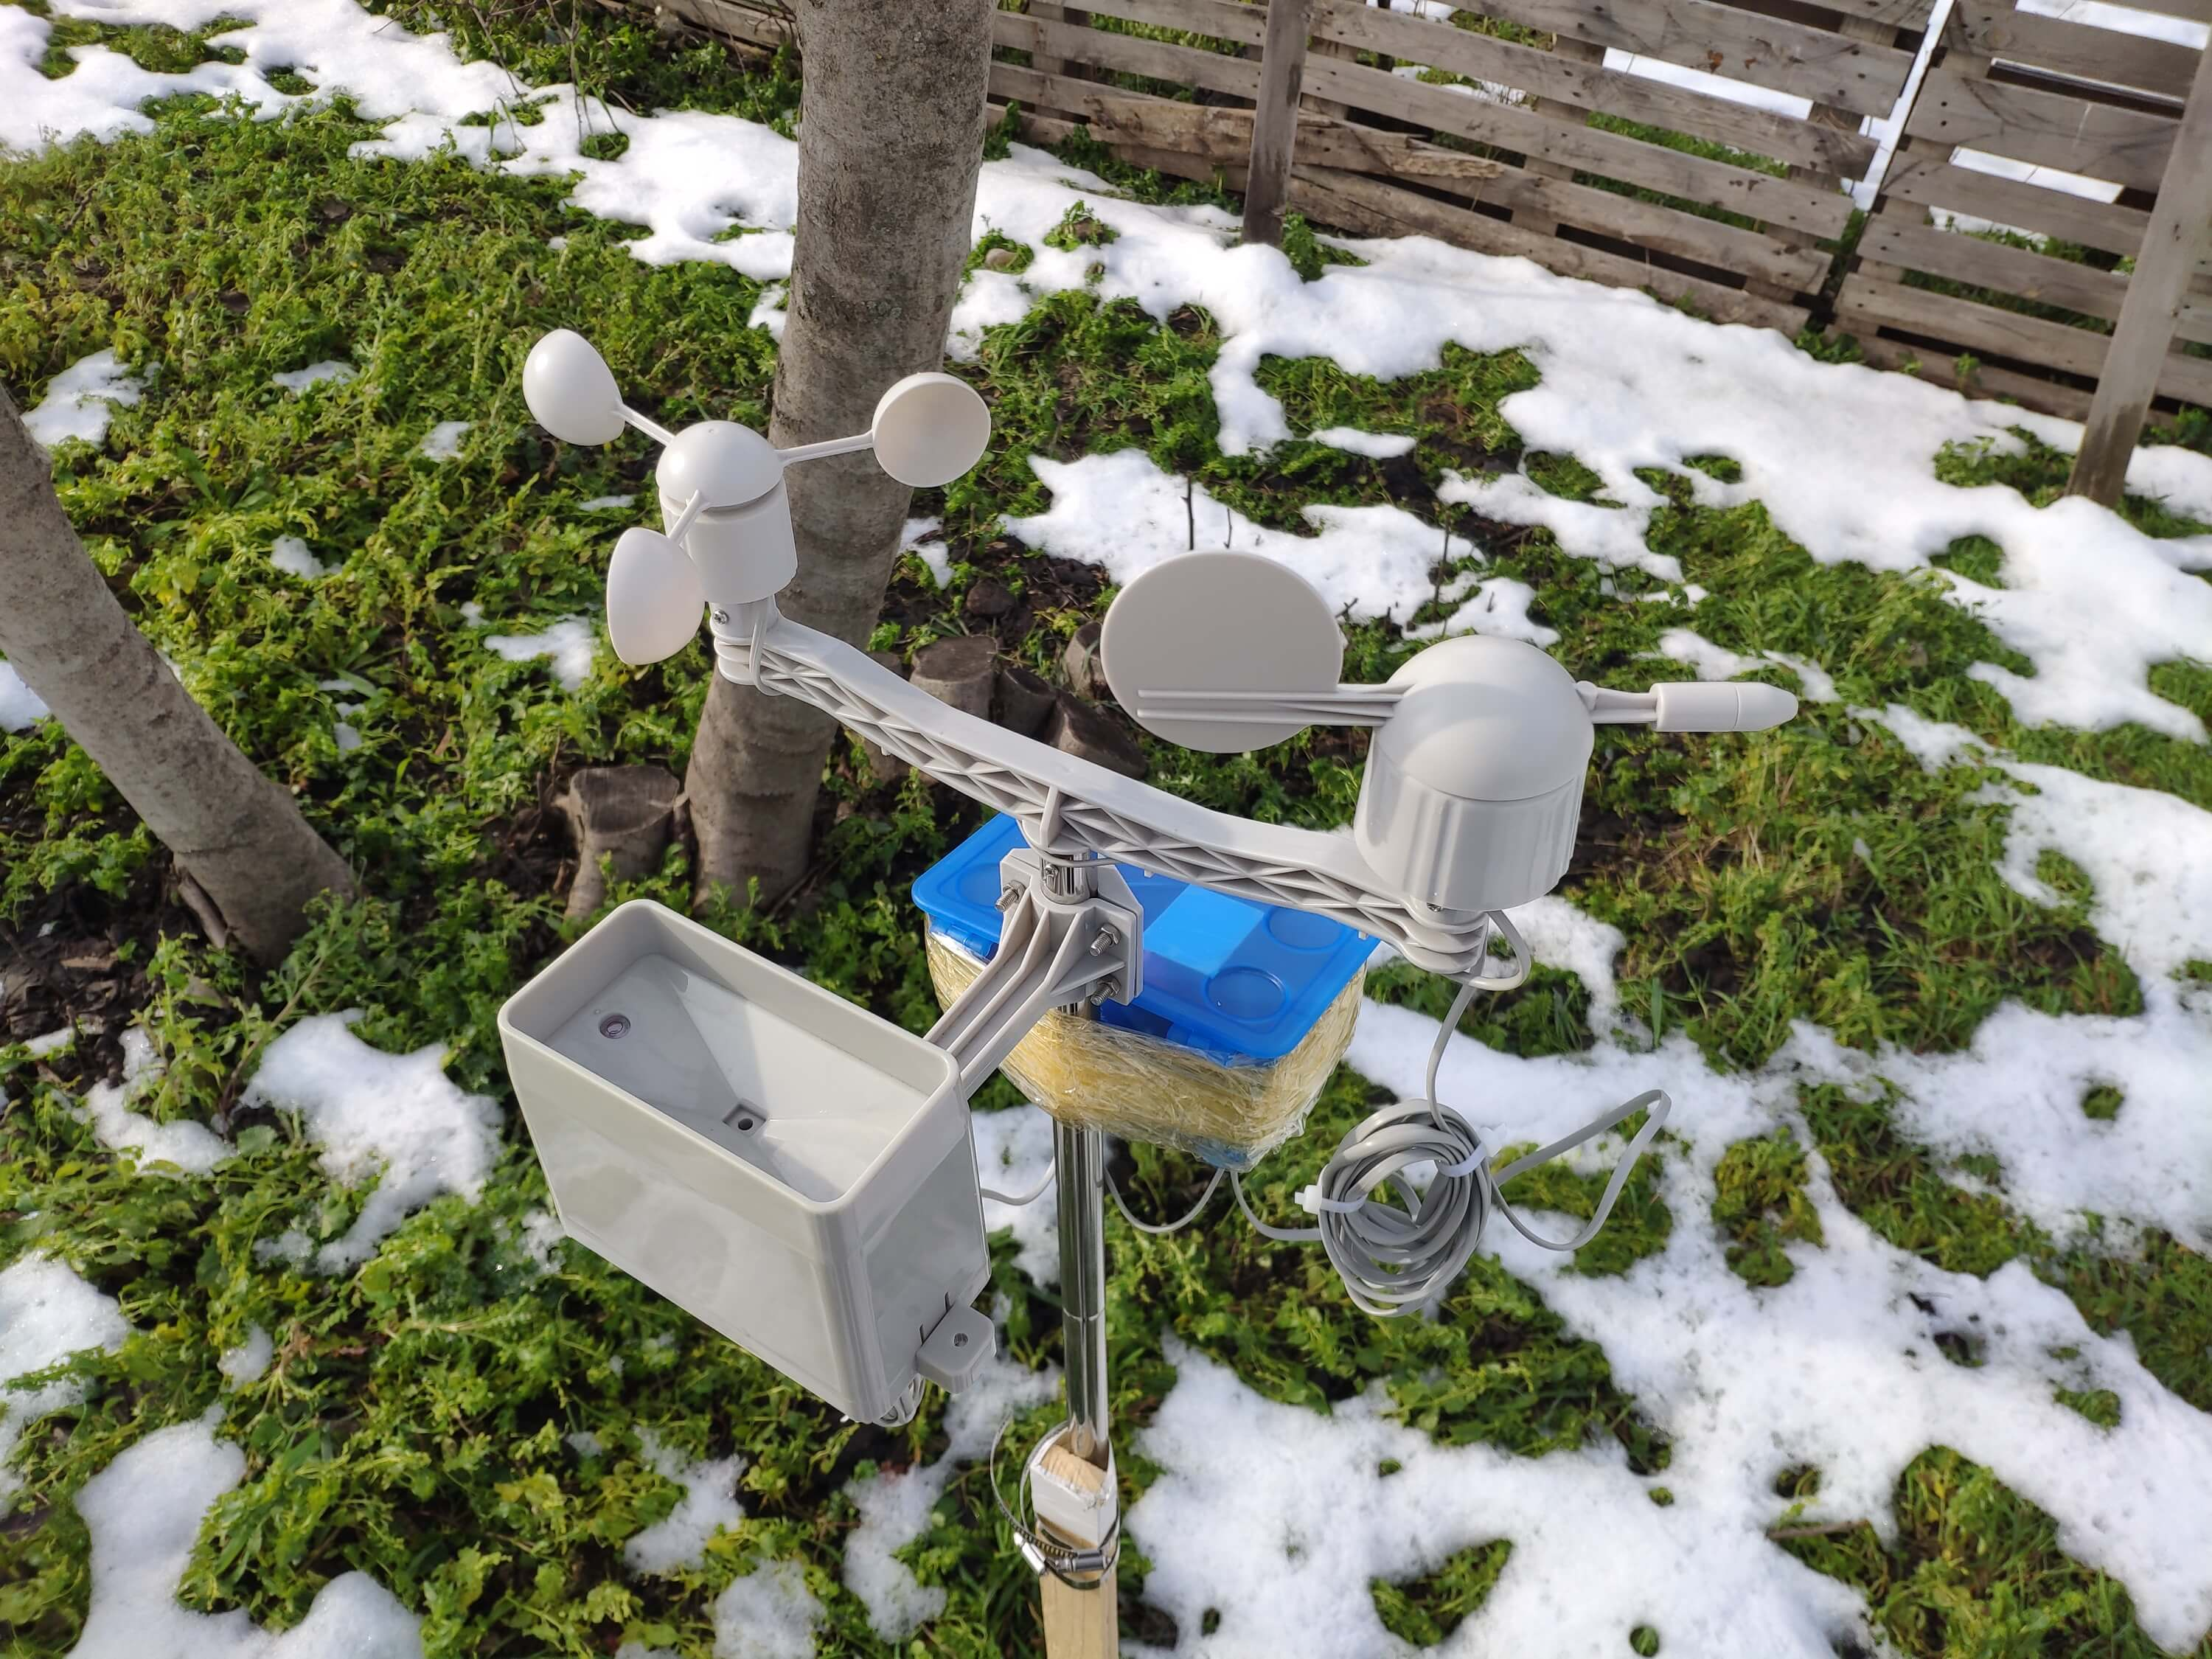
1단계:풍속계, 풍향계 및 빗물 양동이가 있는 기상 관측소 키트 조립
이 기상 관측소 키트에는 직렬 통신 프로토콜을 통해 날씨 데이터를 전송하기 위한 풍속계, 바람 덩굴, 빗물통, 센서 보드가 포함되어 있습니다. 따라서 지역 날씨 데이터를 수집하기 위해 개발 보드와 함께 사용하기 쉽습니다.
CR/LF 끝을 포함하여 초당 37바이트를 출력합니다. .
c000s000g000t086r000p000h53b10020
데이터 파서:
<울> c000 : 공기 방향, 정도
s000 : 공기 속도(평균), 시속 0.1마일
g000 :공기 속도(최대), 시속 0.1마일
t086 : 온도, 화씨
r000 : 강우량(1시간), 0.01인치
p000 : 강우량(24시간), 0.01인치
h53 :습도, %(00%=100)
b10020 : 대기, 0.1hPa
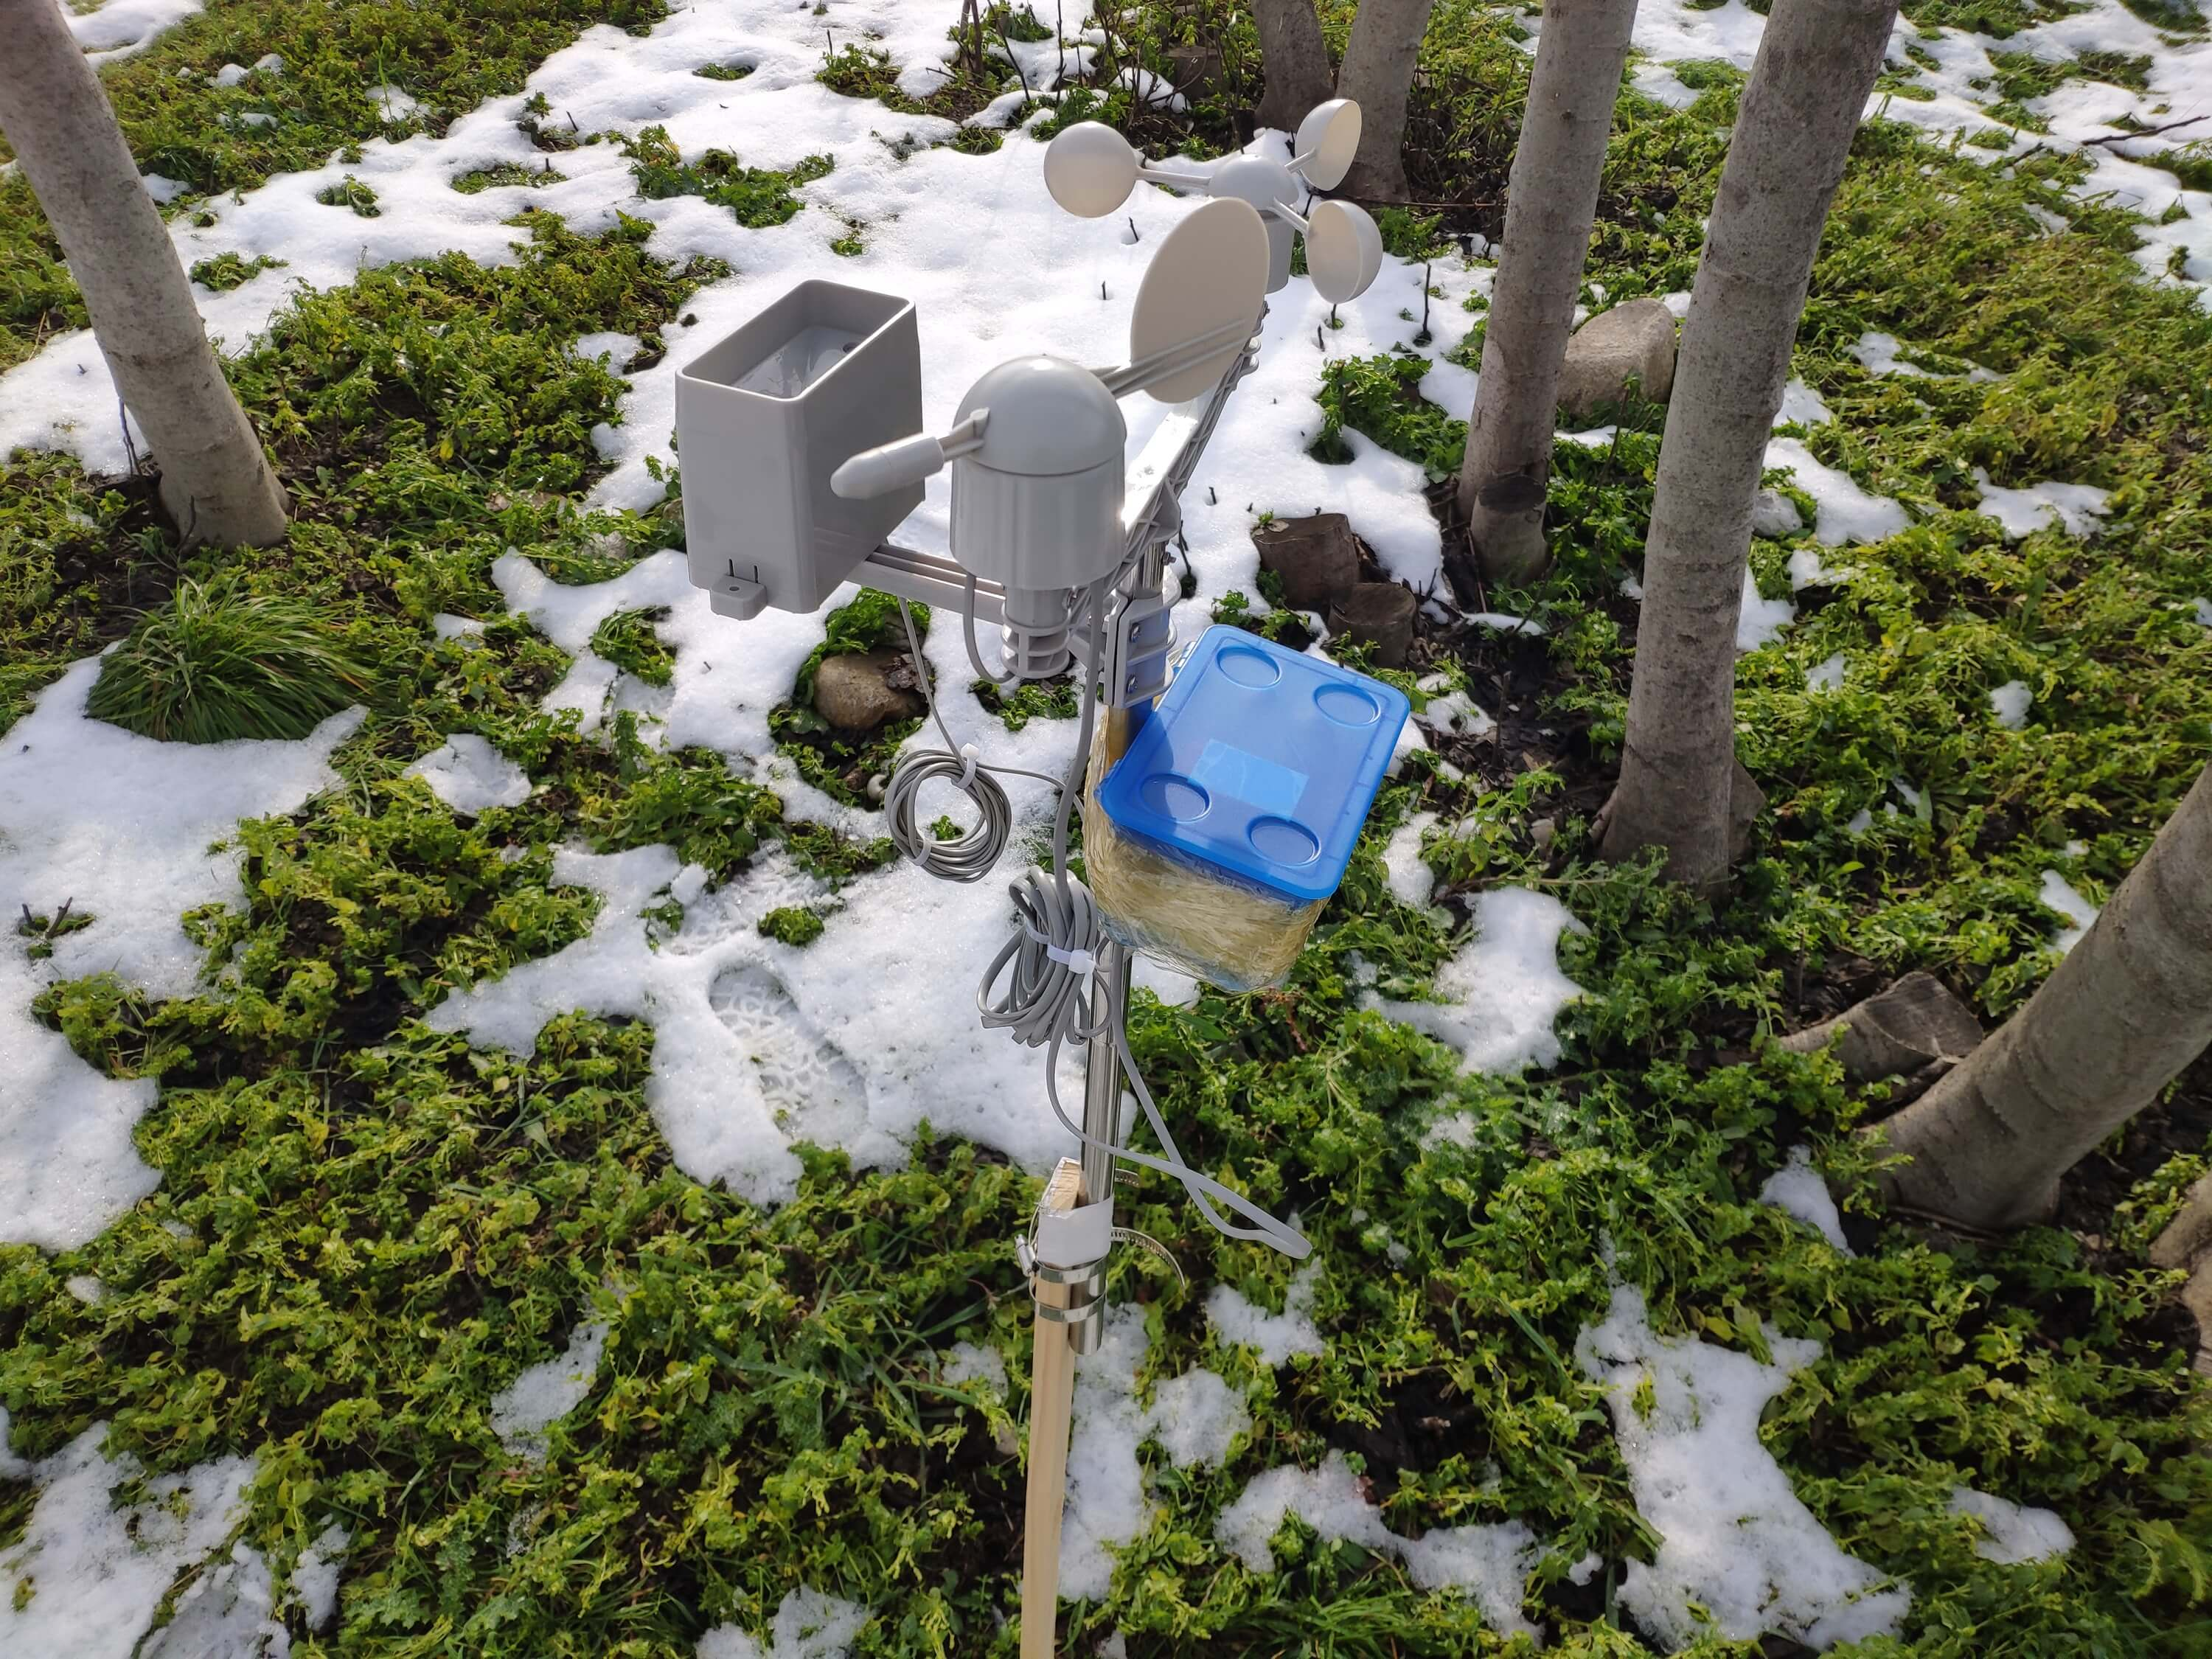
⭐ 먼저, 나사와 너트를 사용하여 풍속계와 풍향계를 다리에 부착합니다.
⭐ RJ11 전화 코드를 사용하여 풍향계를 풍향계에 연결하고 다리 아래에서 조입니다.
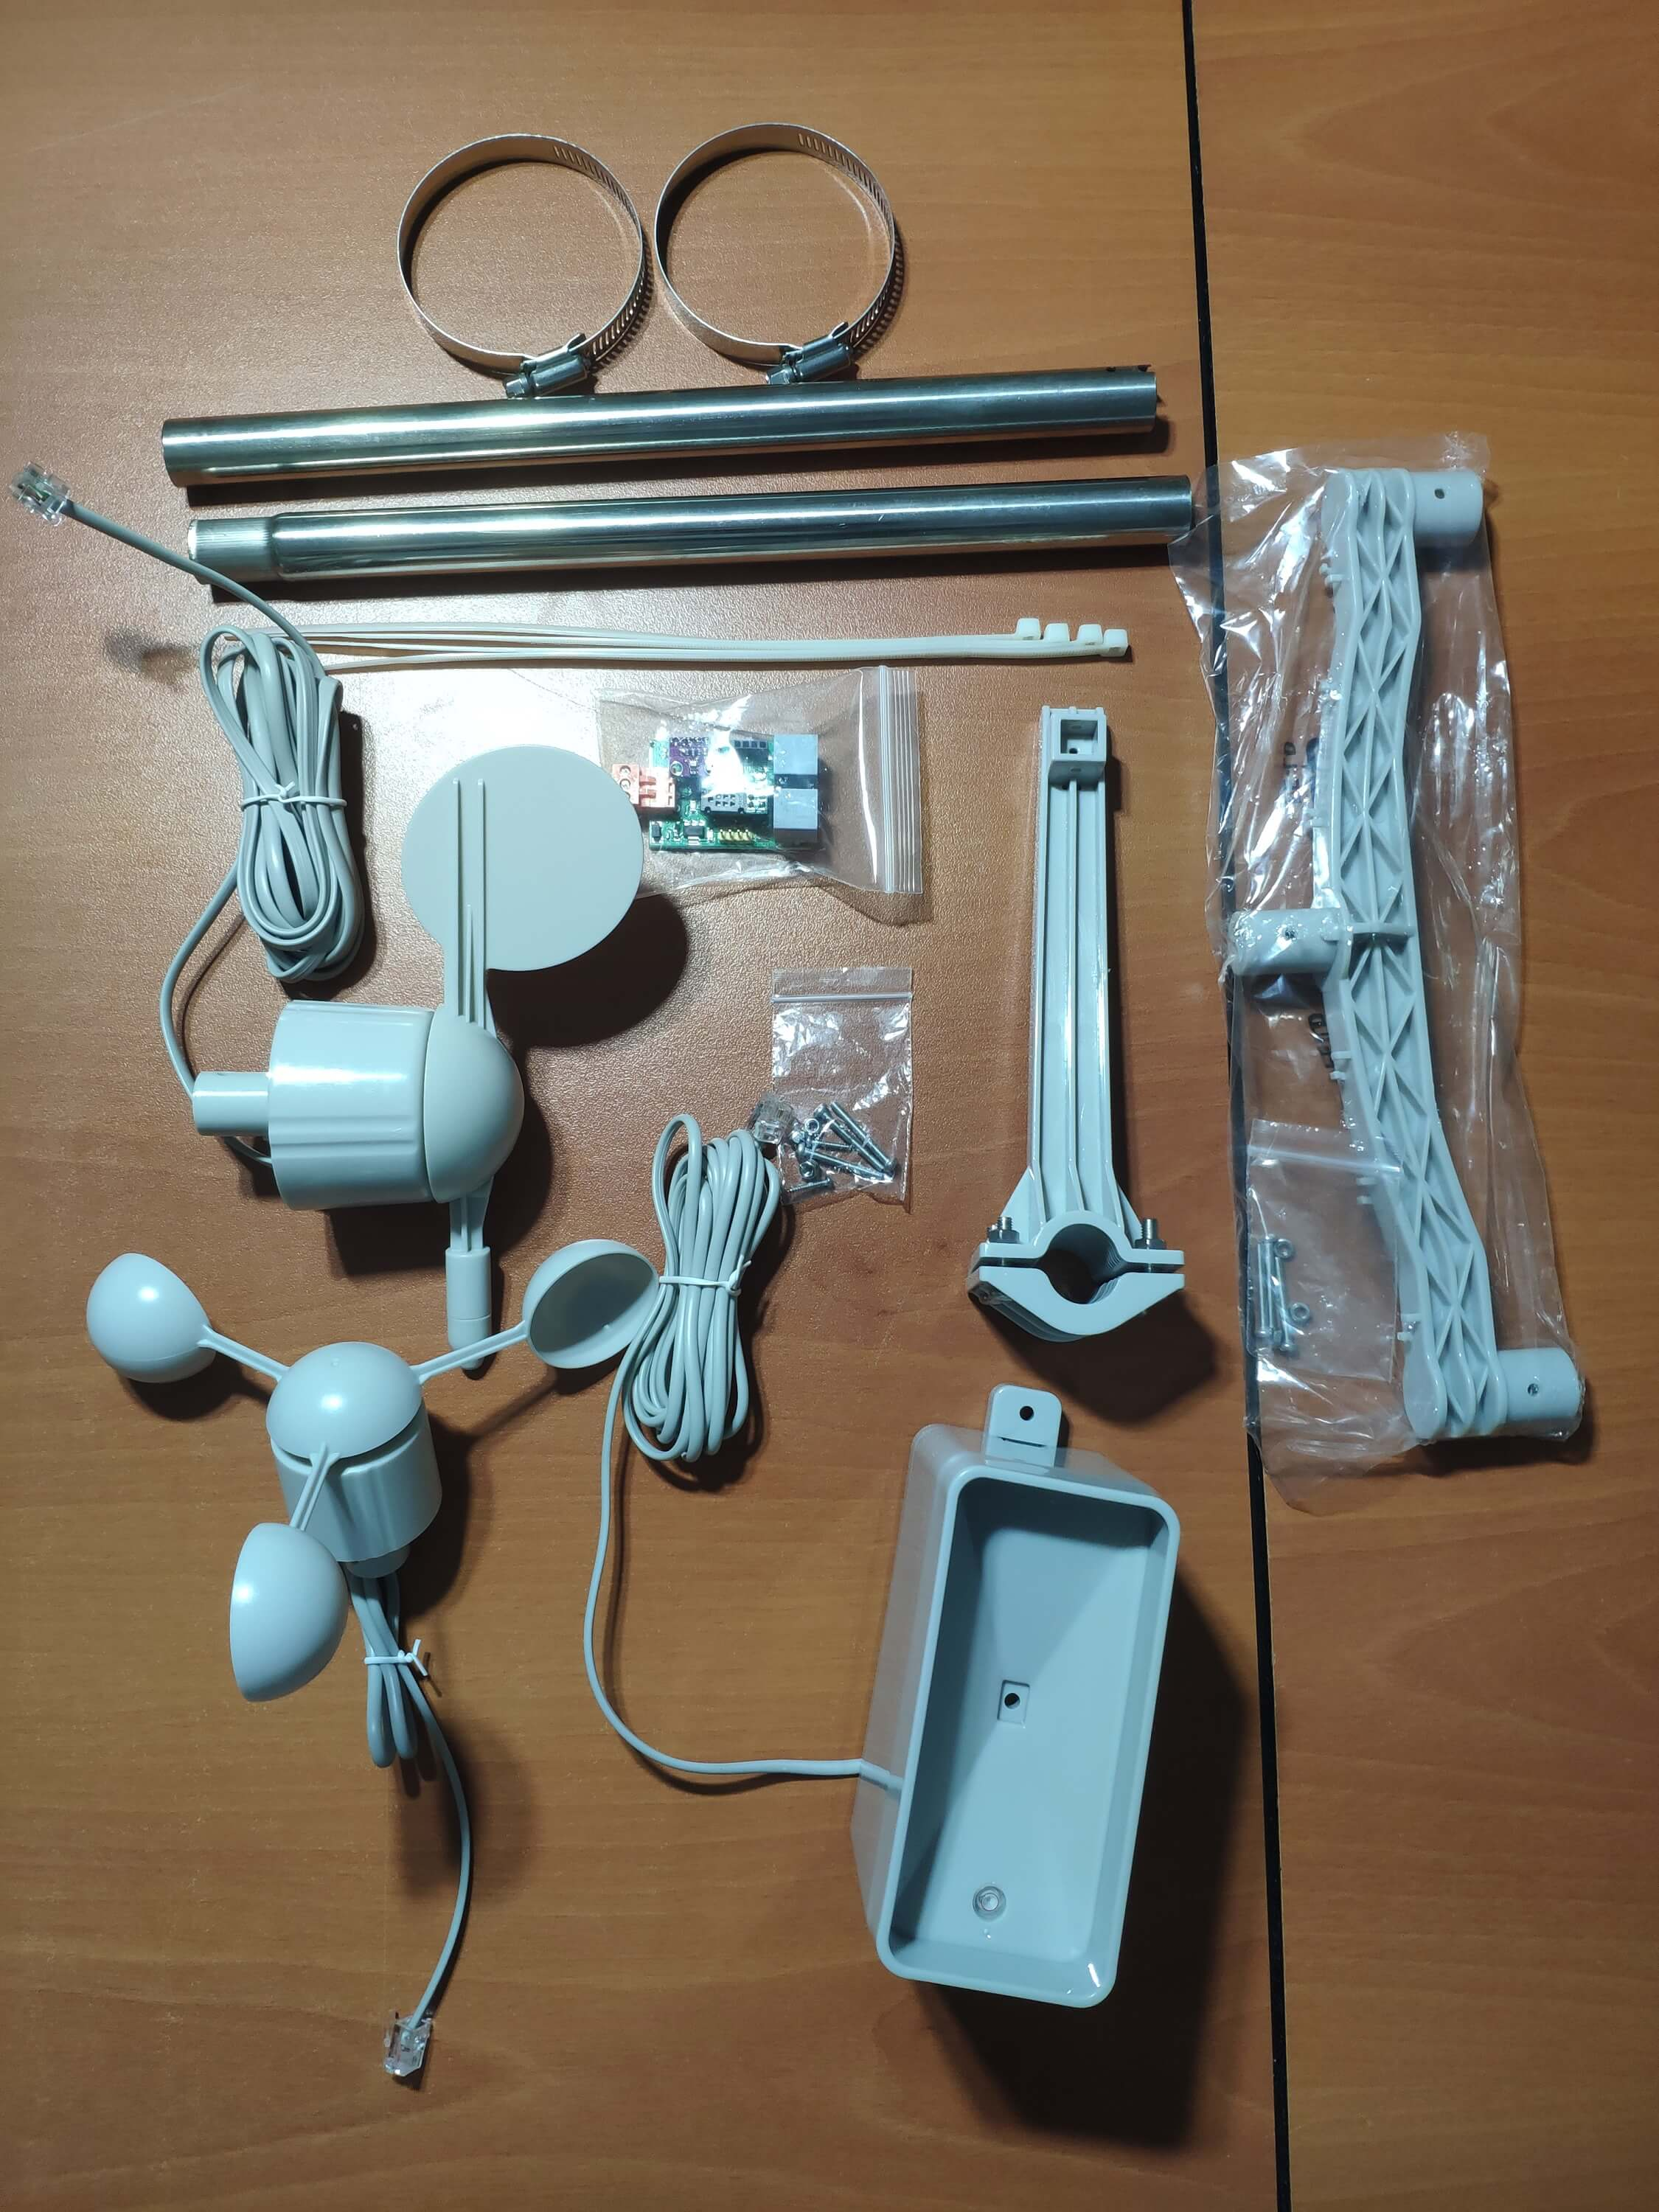
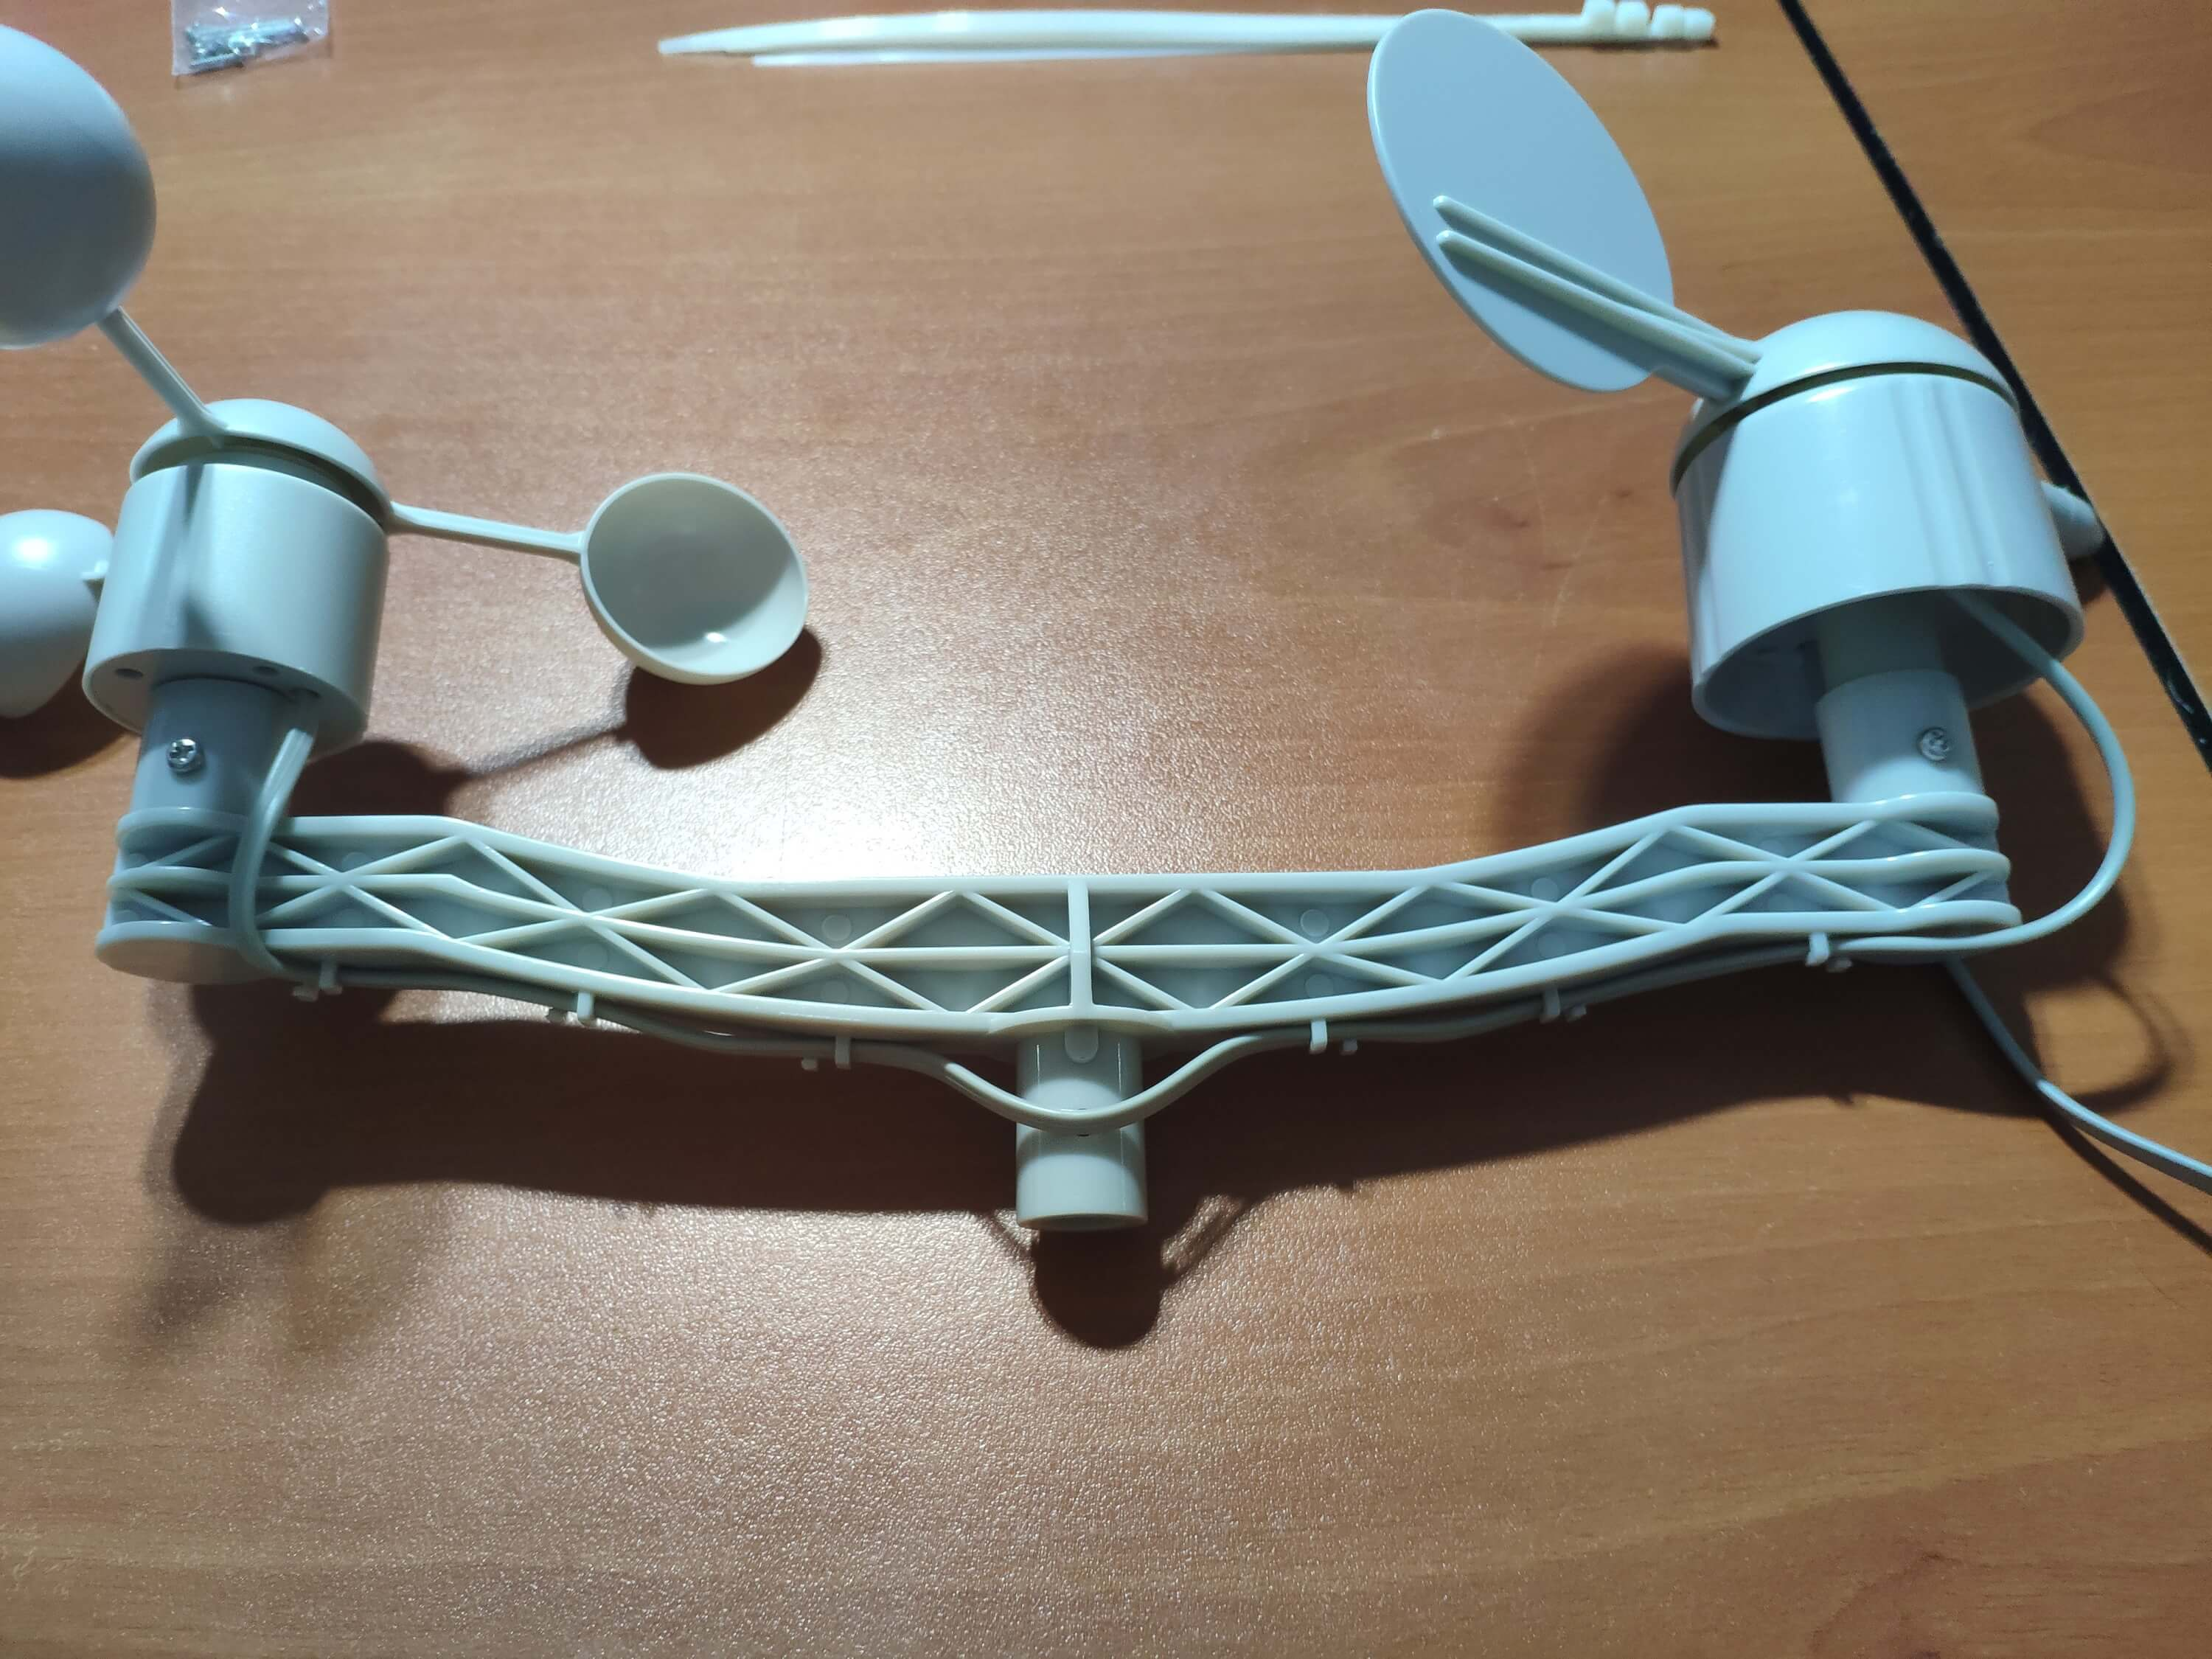
⭐ 그런 다음 스테인리스 스틸 스틱을 나사로 브리지에 장착하세요.
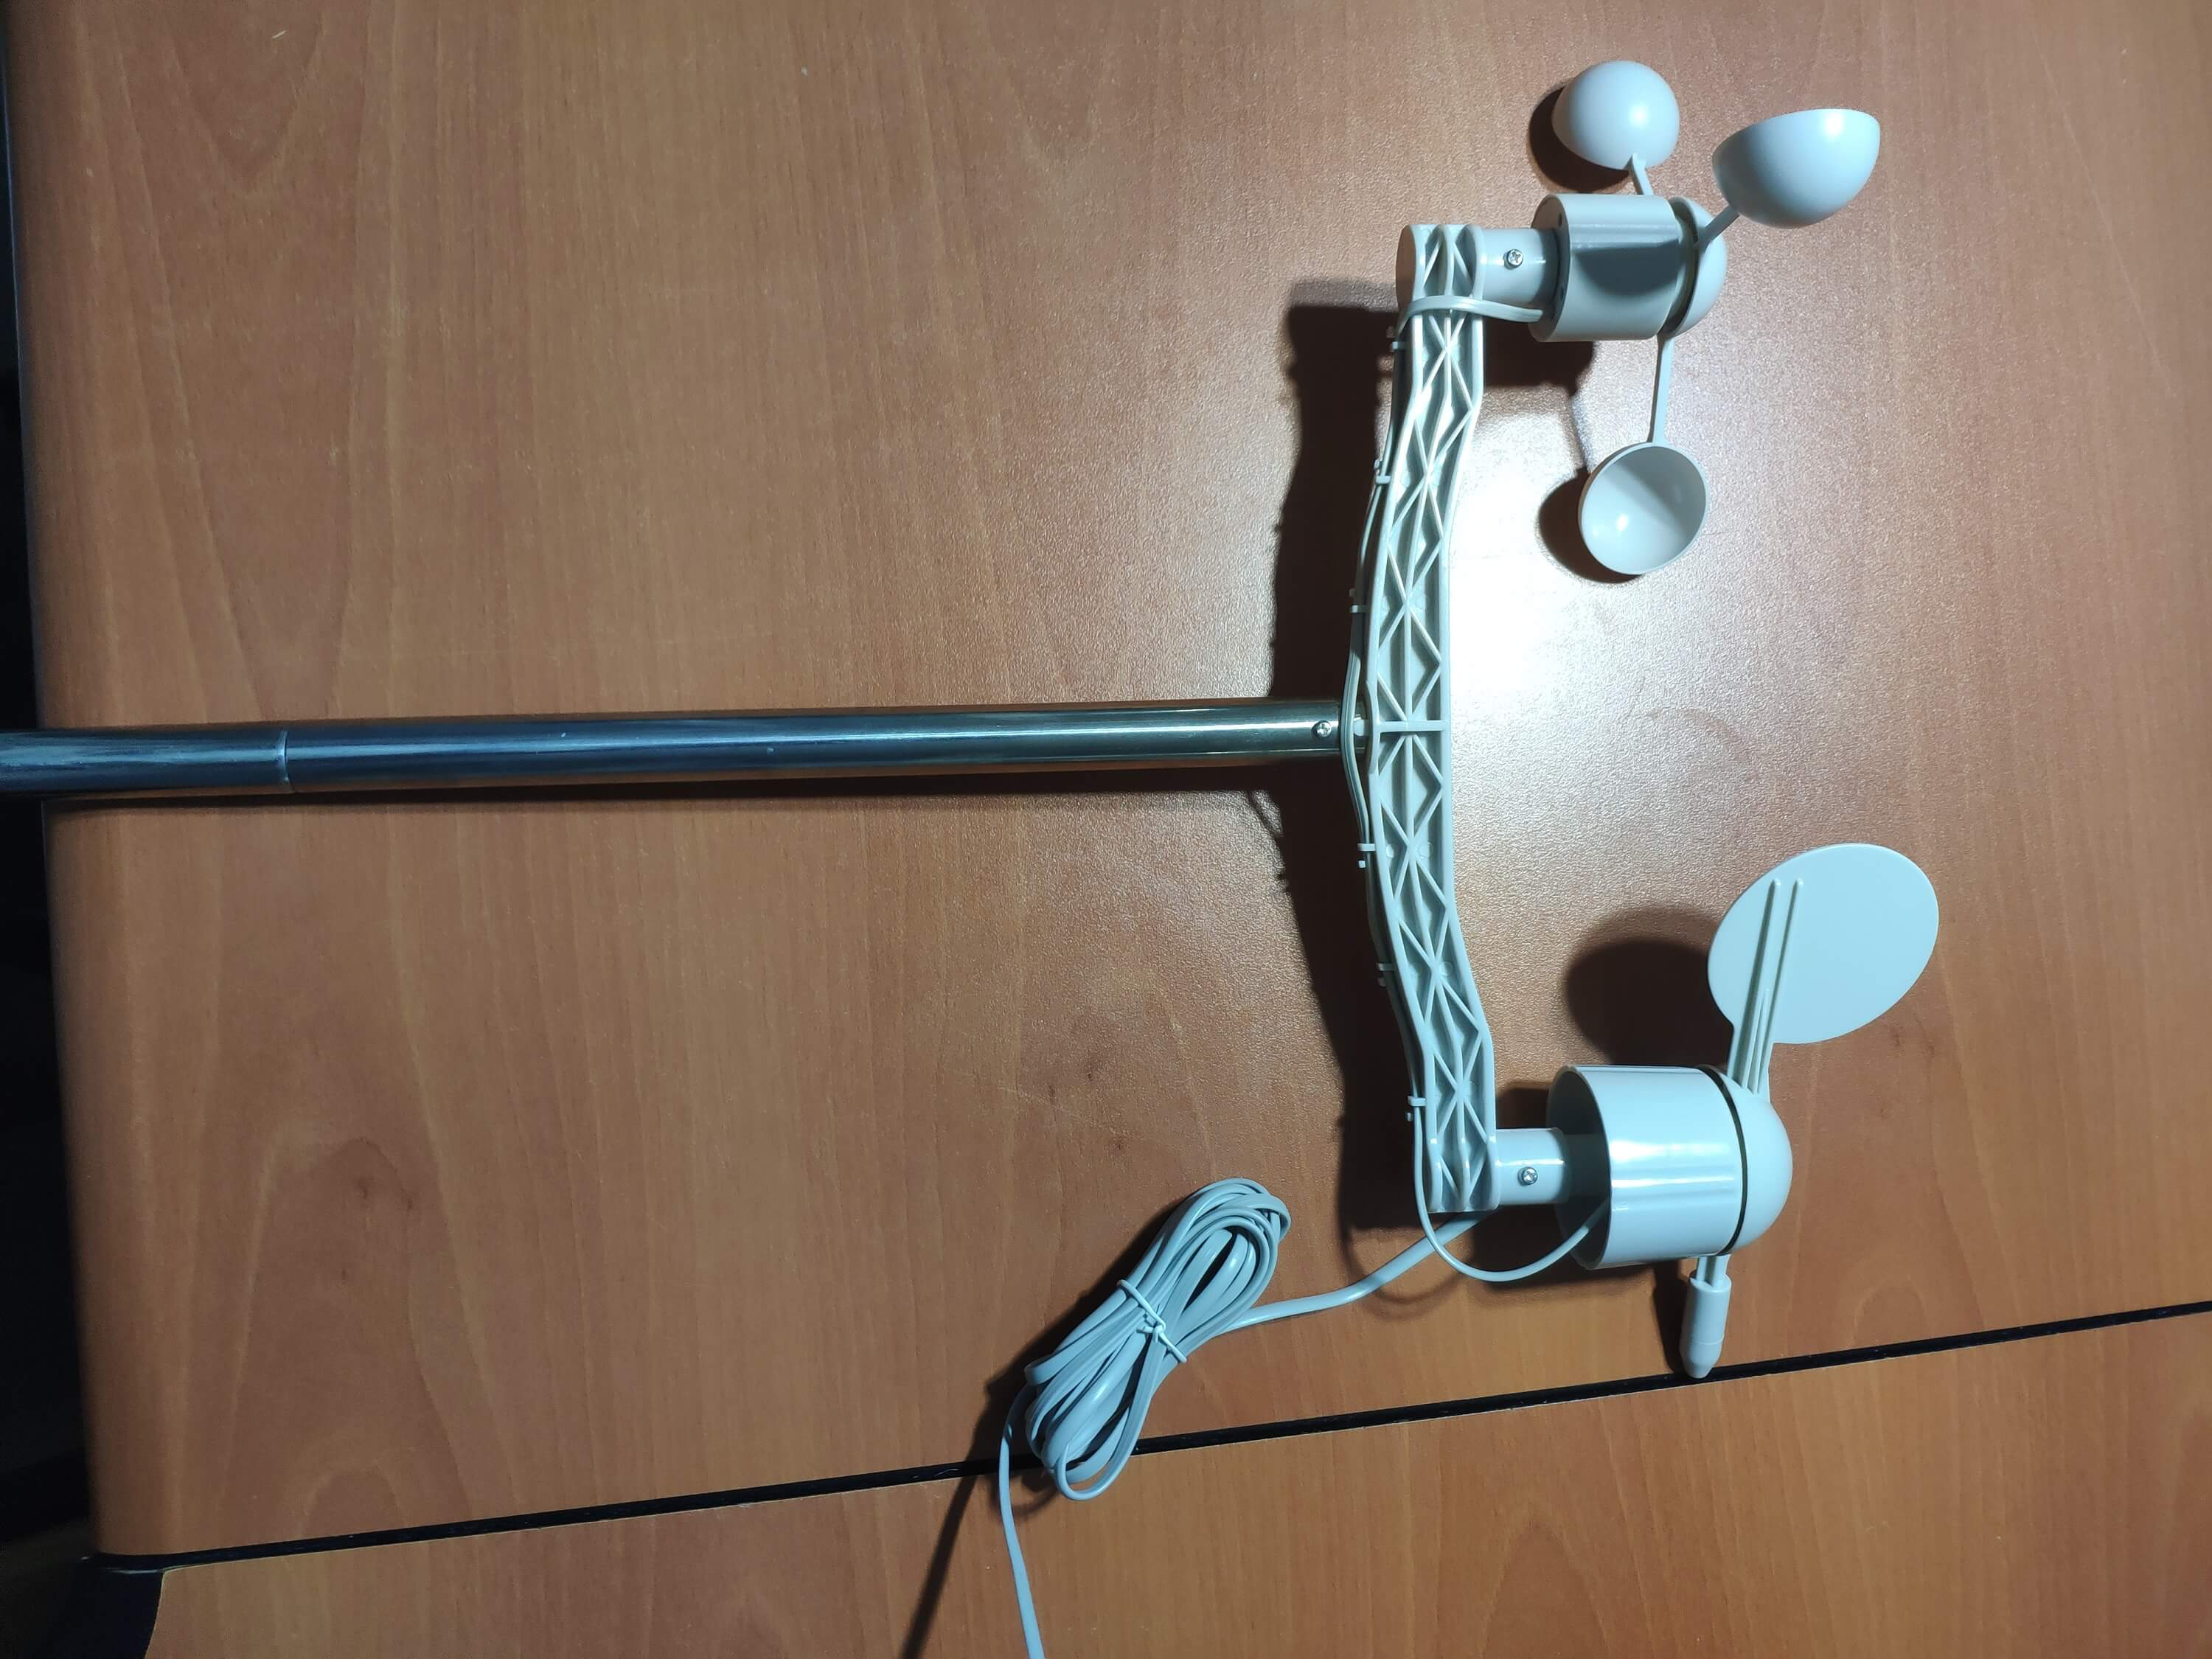
⭐ 레인 버킷 아래에 나사로 레인 버킷 조인트를 설치합니다.
⭐ 마지막으로 나사와 너트를 이용하여 스테인리스 스틱에 빗물통을 올려주세요.
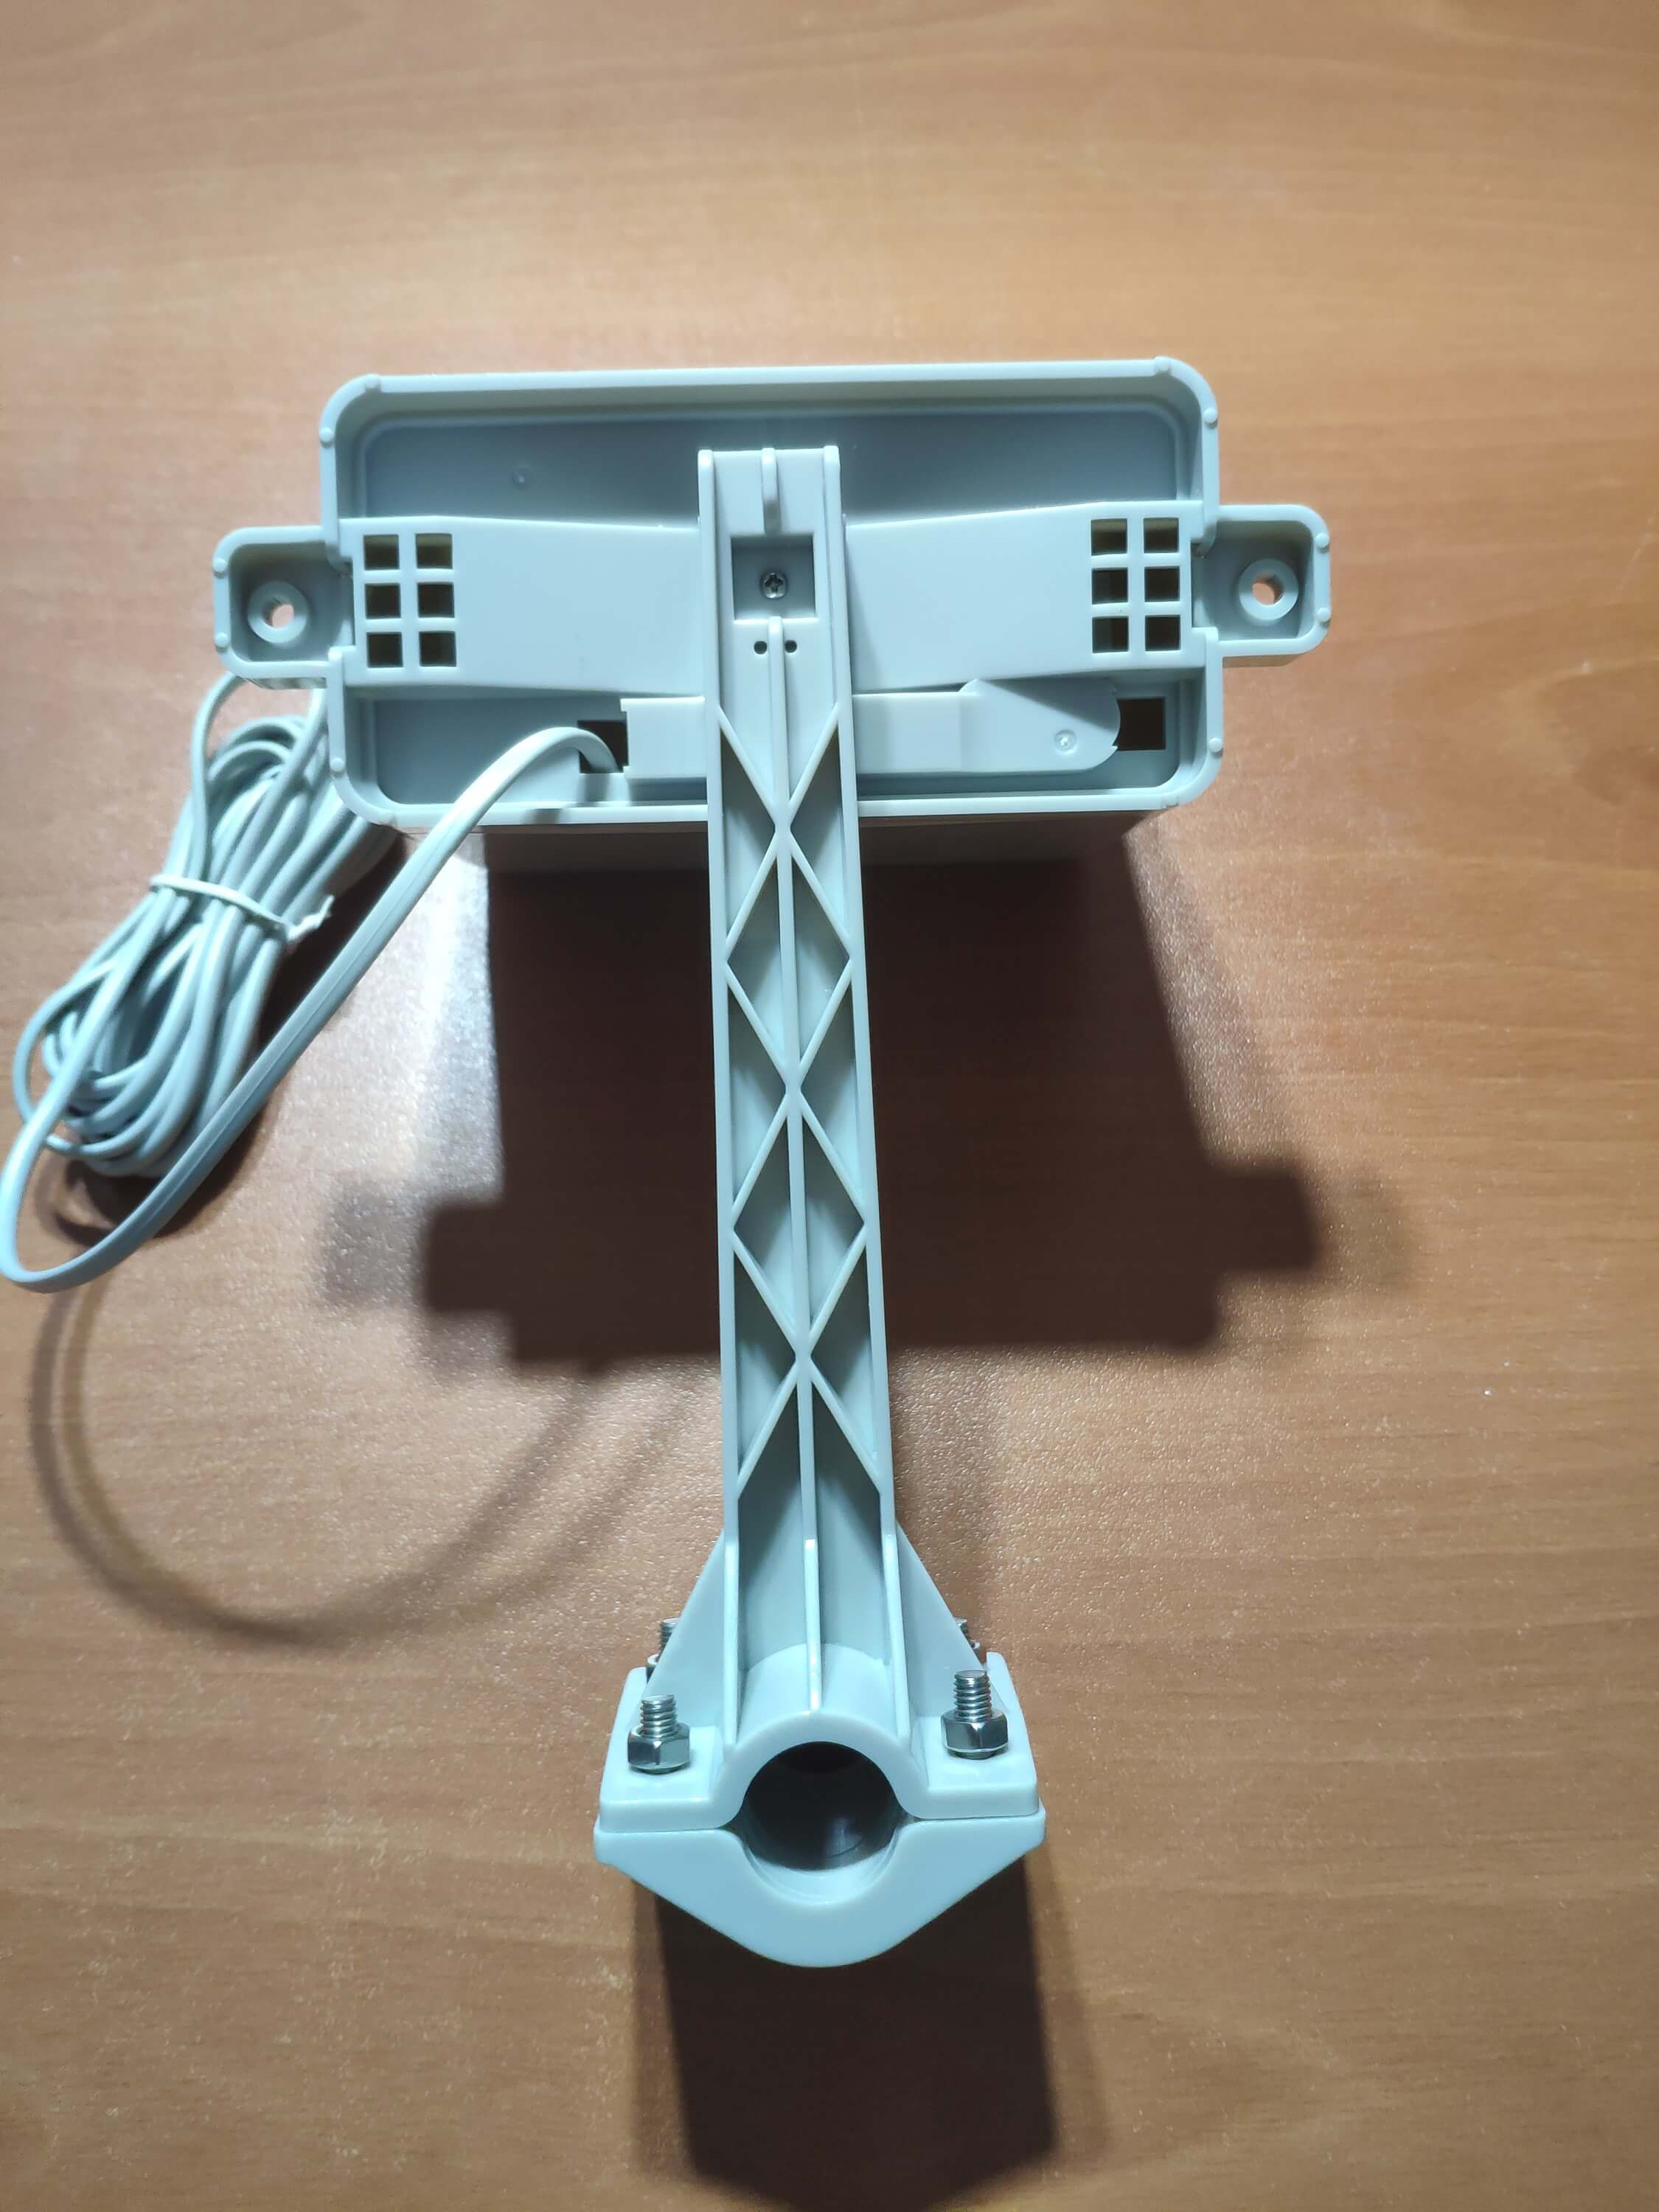
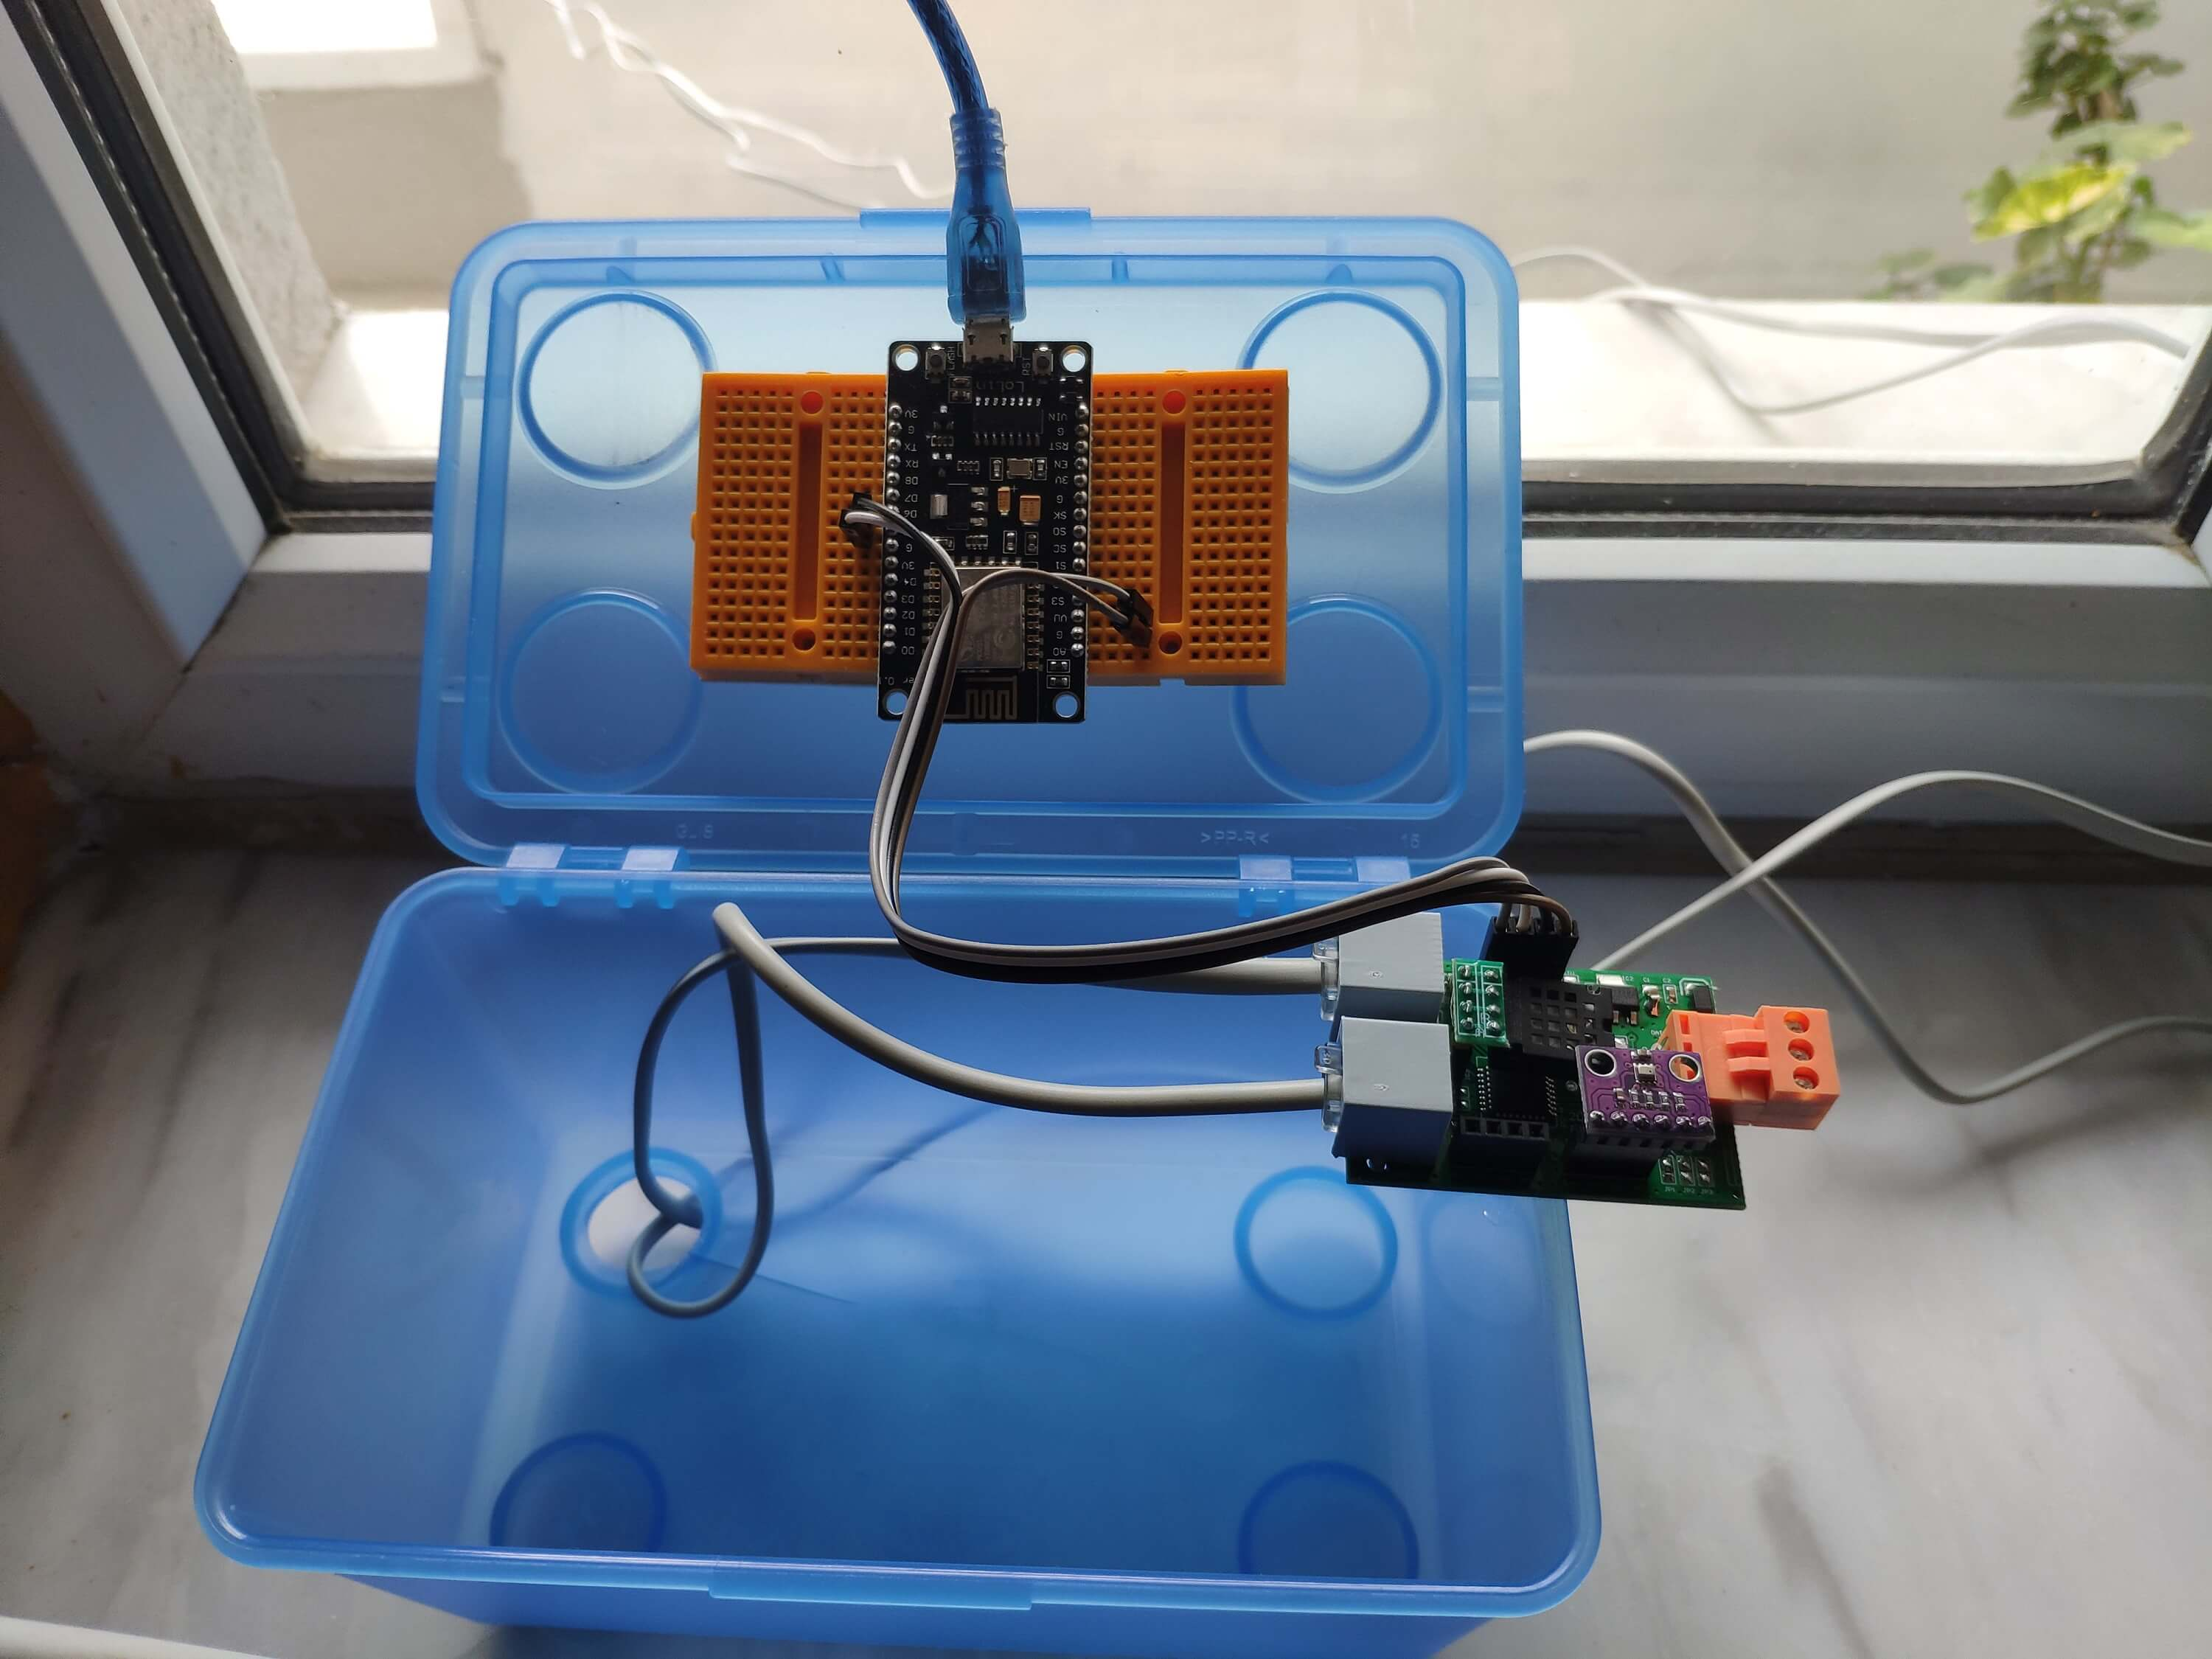
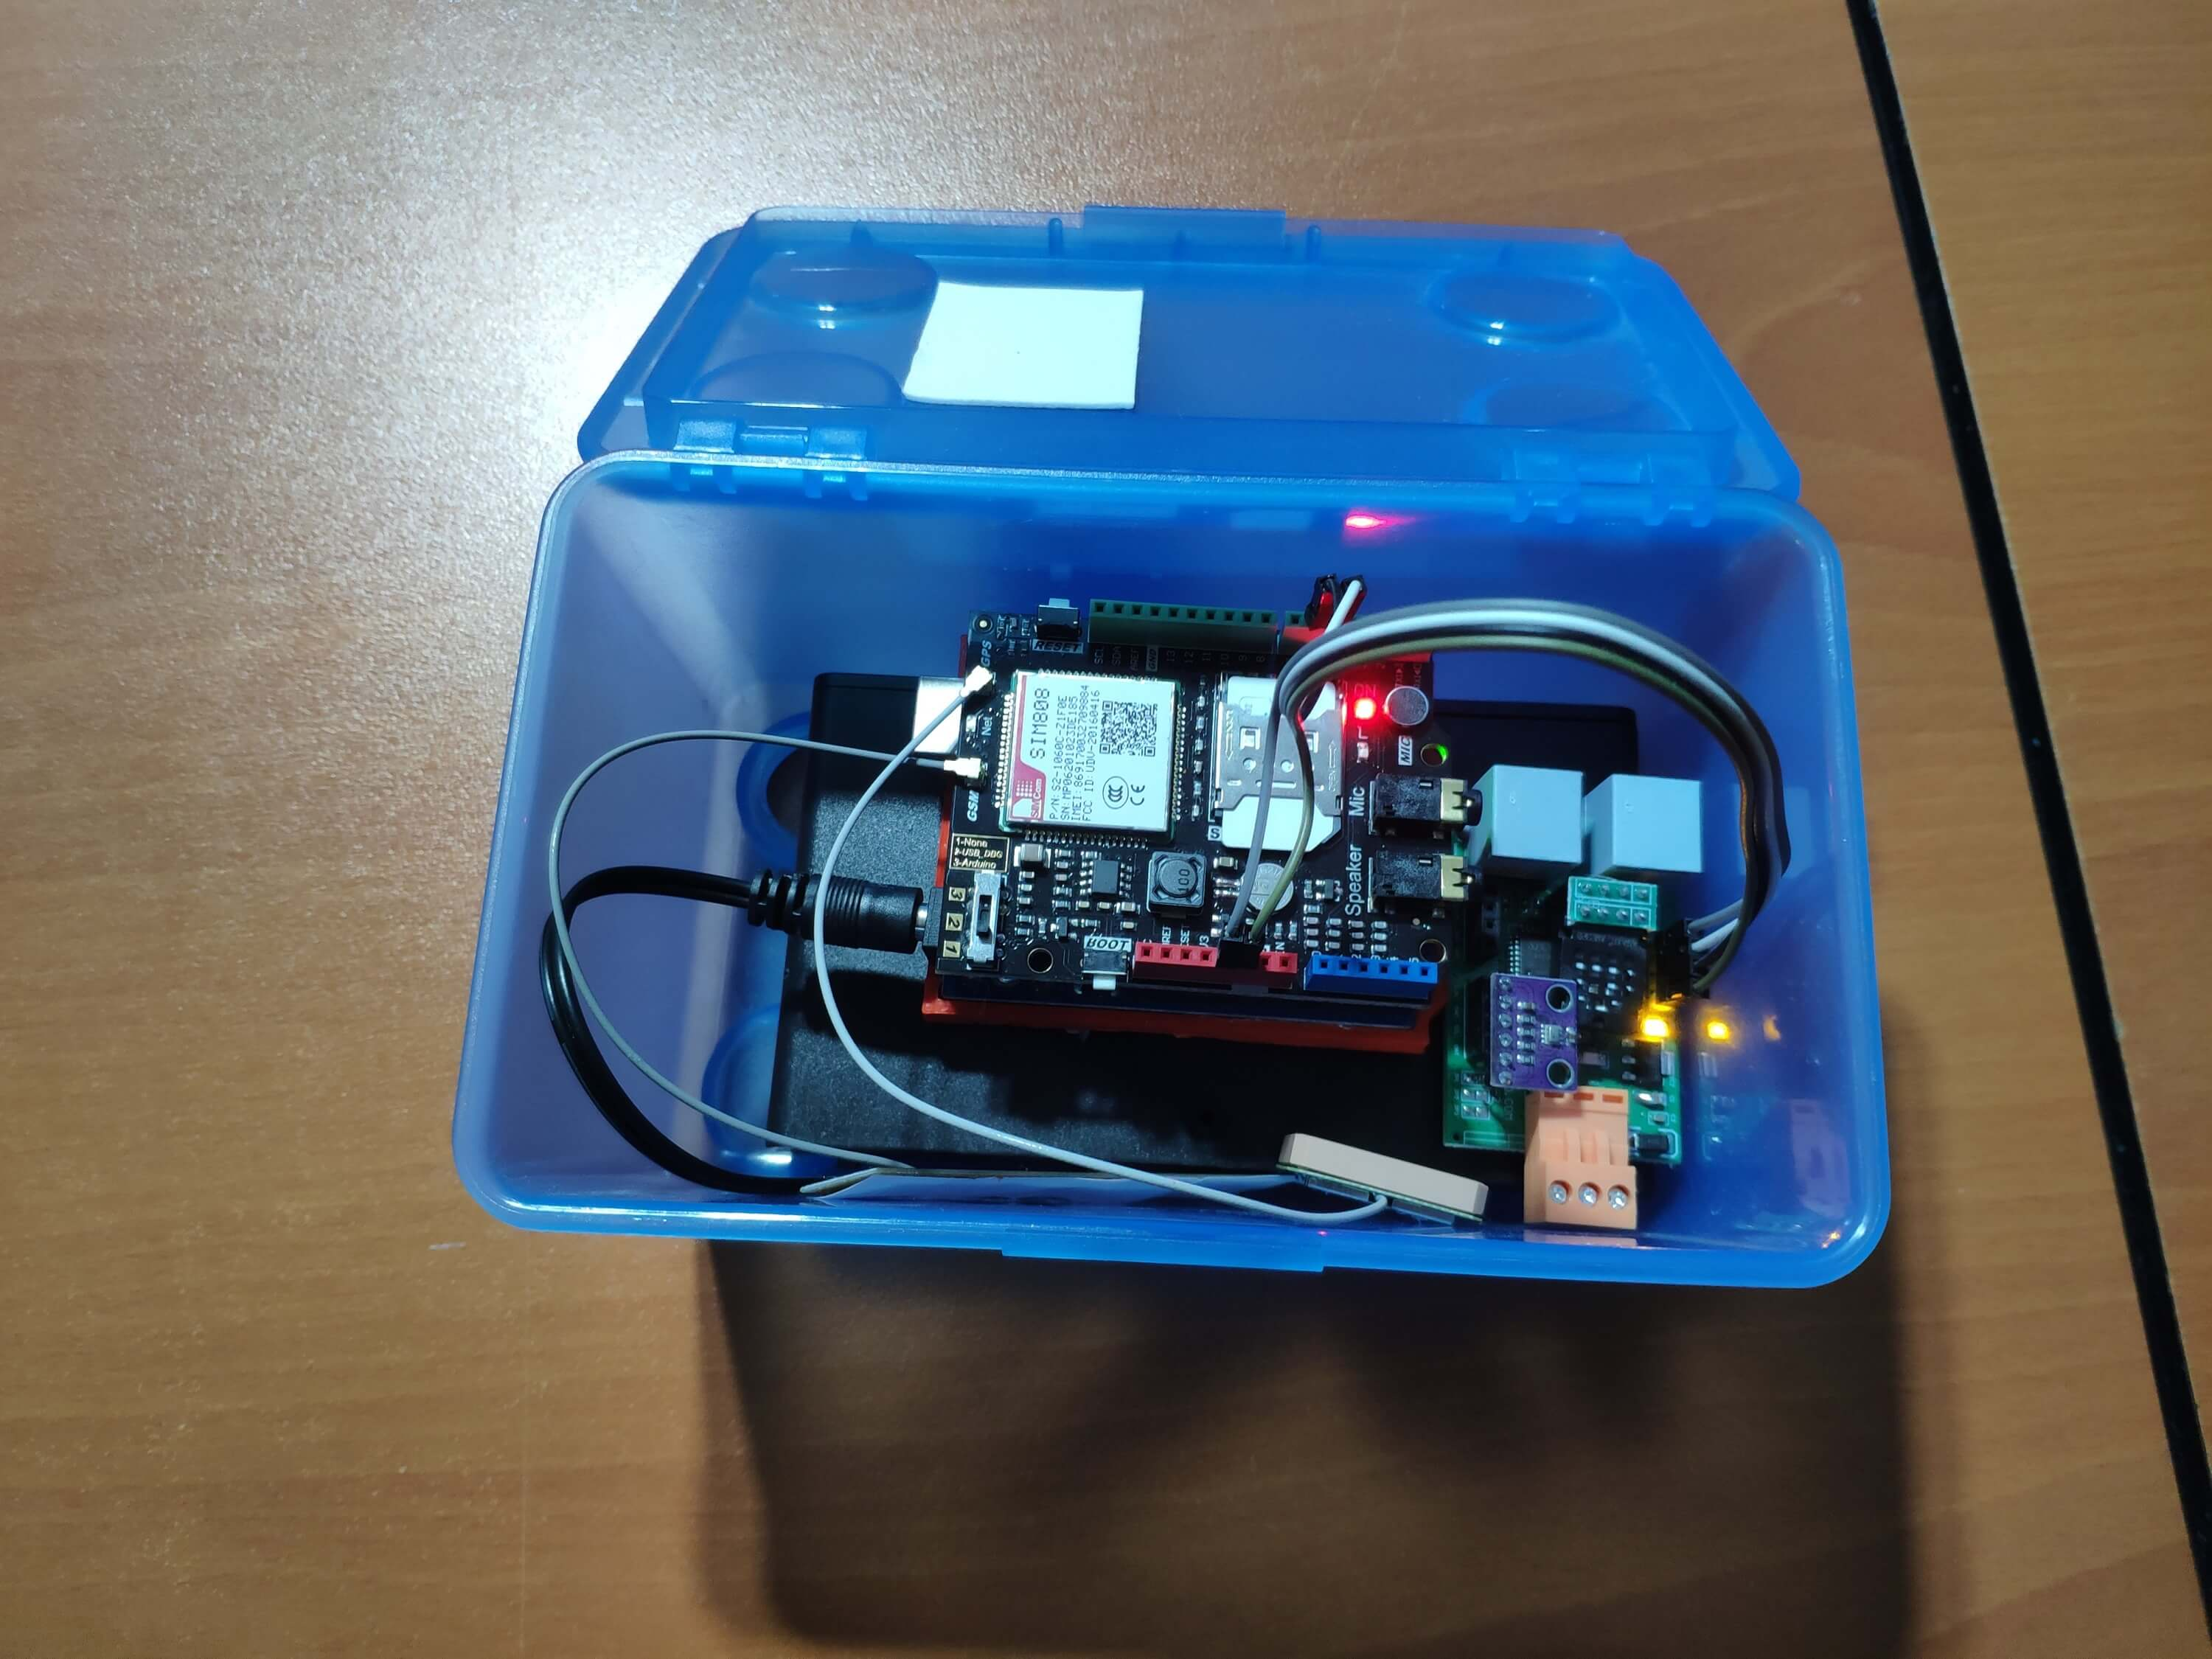
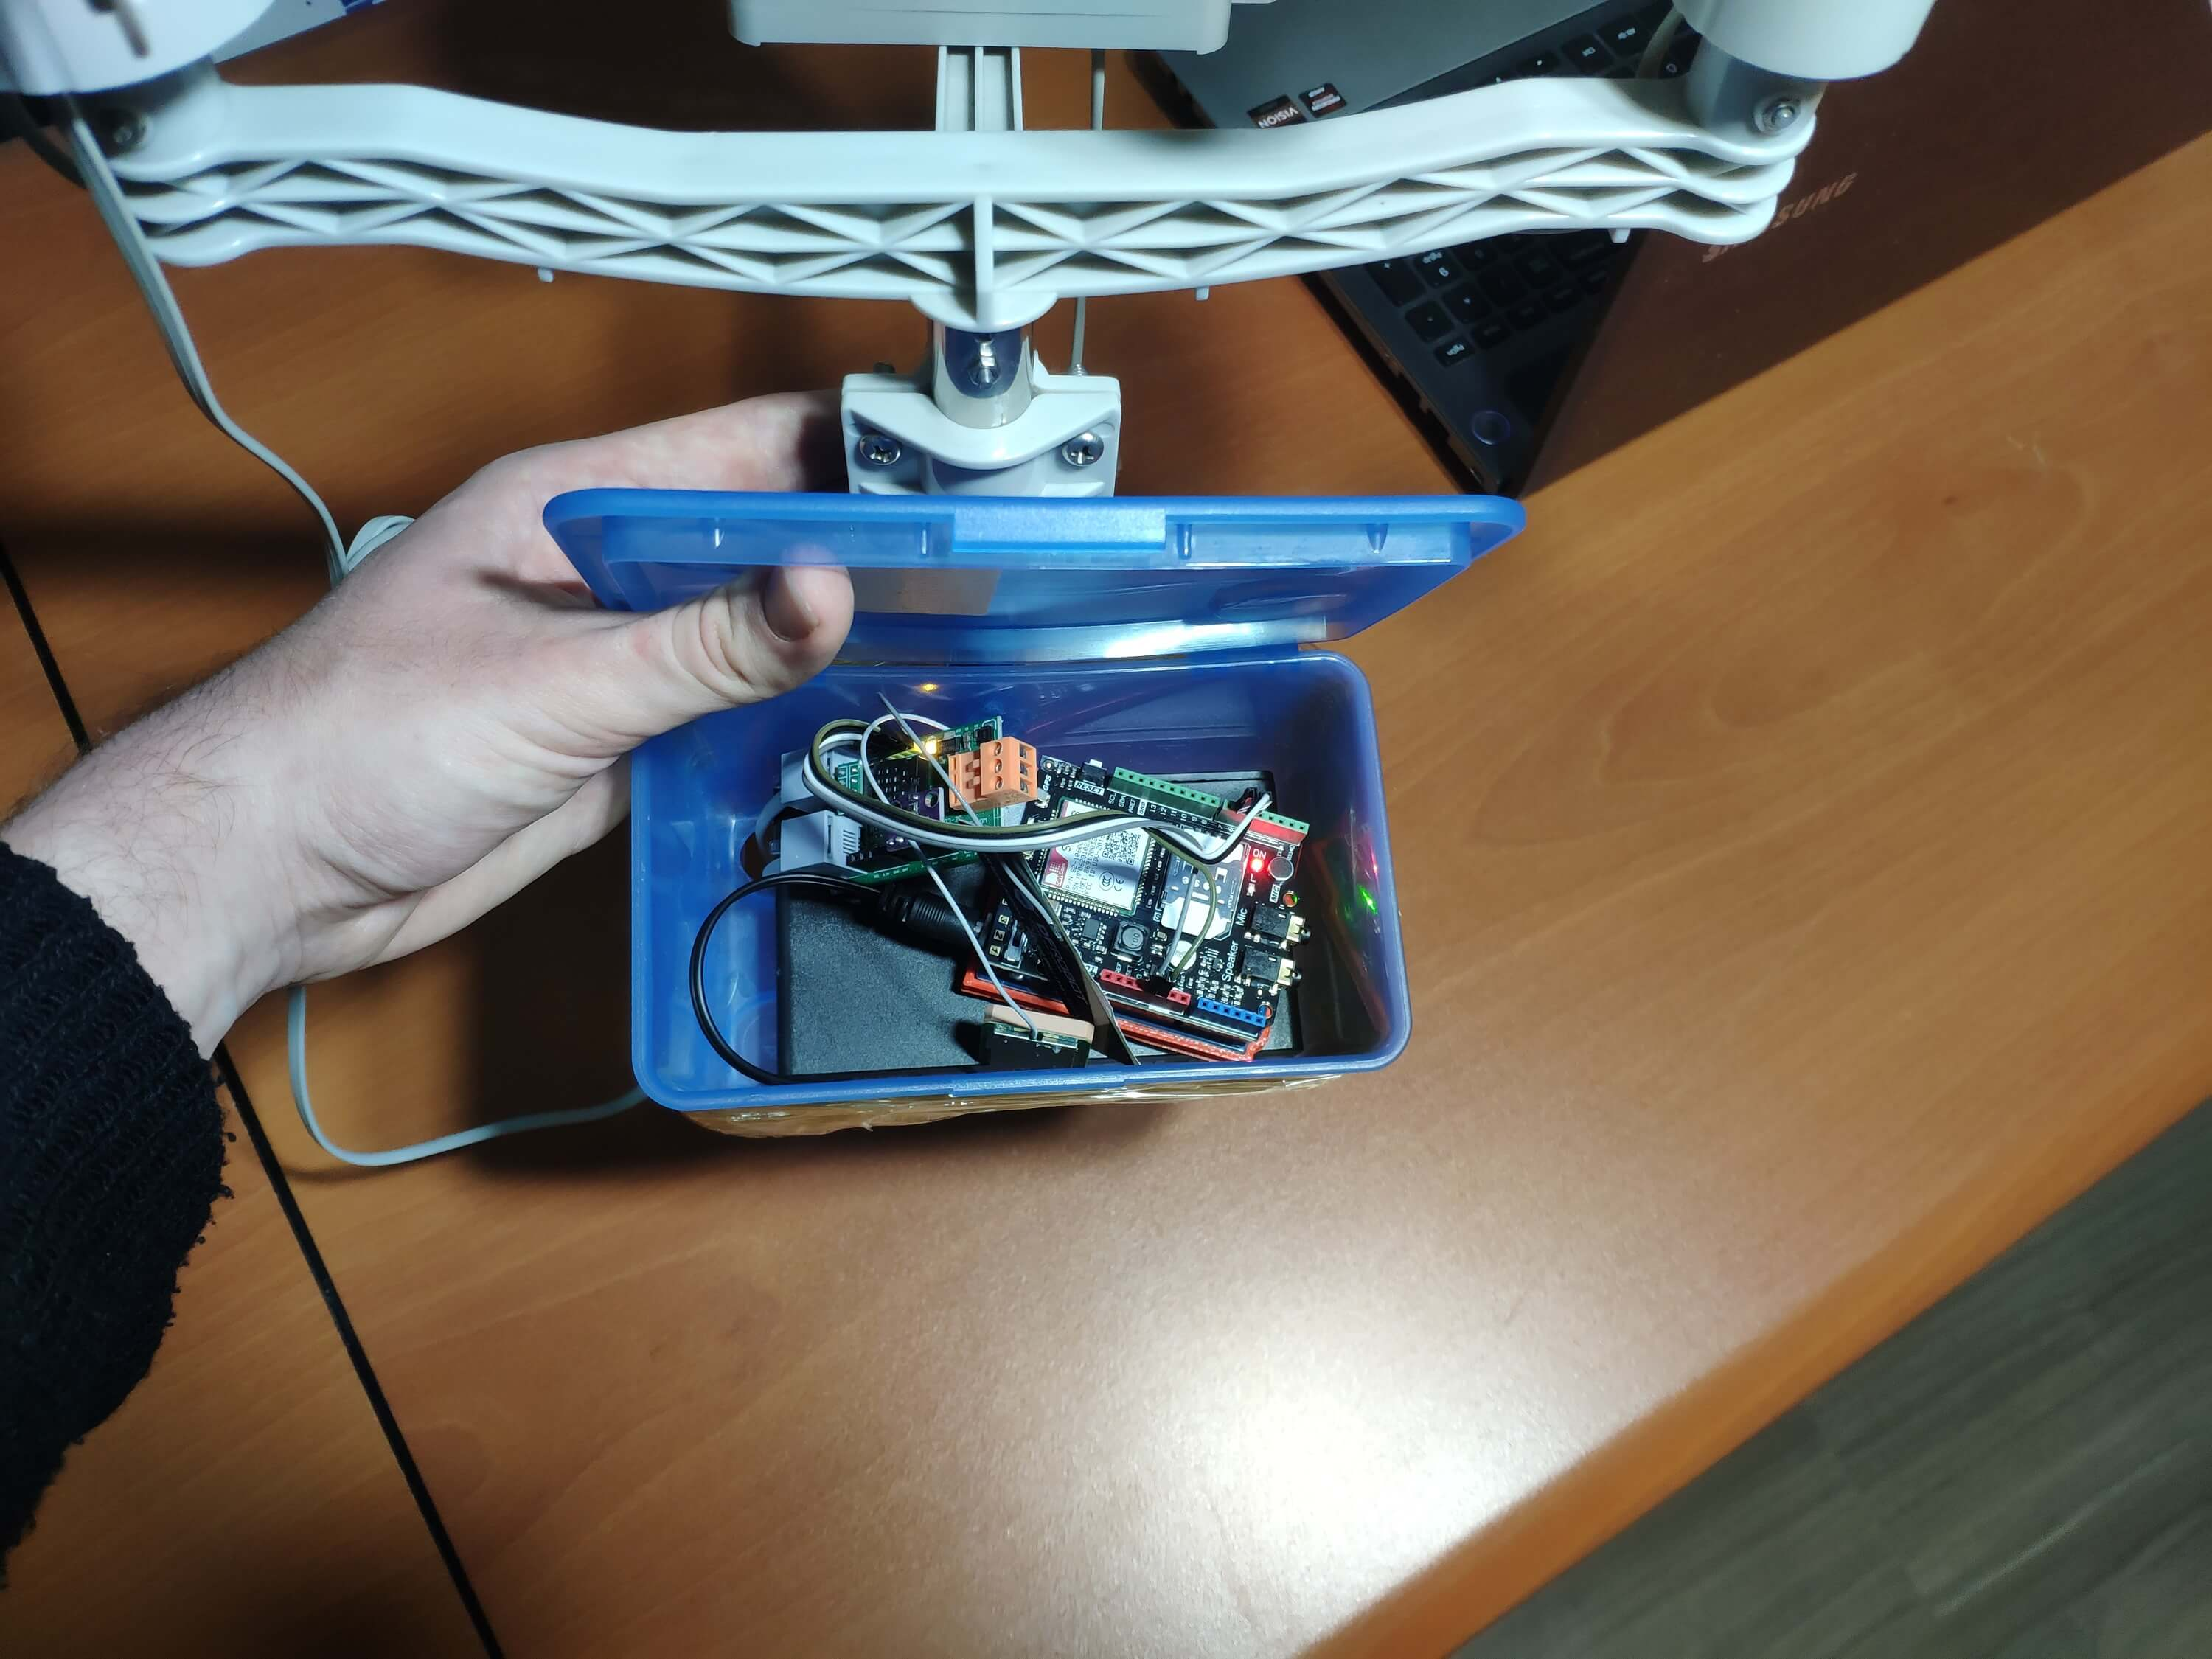
⭐ 이제 극한의 기상 조건에서도 기상 데이터를 수집할 준비가 되었습니다. 하지만 센서(컨버터) 기판은 비바람에 견디지 못하기 때문에 실외에서 센서 기판과 SIM808 실드를 보호하기 위해 기상 관측소에 플라스틱 상자를 추가했습니다.
2단계:Google 스프레드시트에서 날씨 데이터 수집
Google 스프레드시트의 스프레드시트로 정보를 보내려면 Google 개발자 콘솔에서 새 애플리케이션을 만들고 Google 스프레드시트 API를 활용하기 위한 인증 자격 증명을 받아야 합니다. Google 개발자 콘솔로 애플리케이션을 만드는 초보자라면 아래 지침을 따르세요.
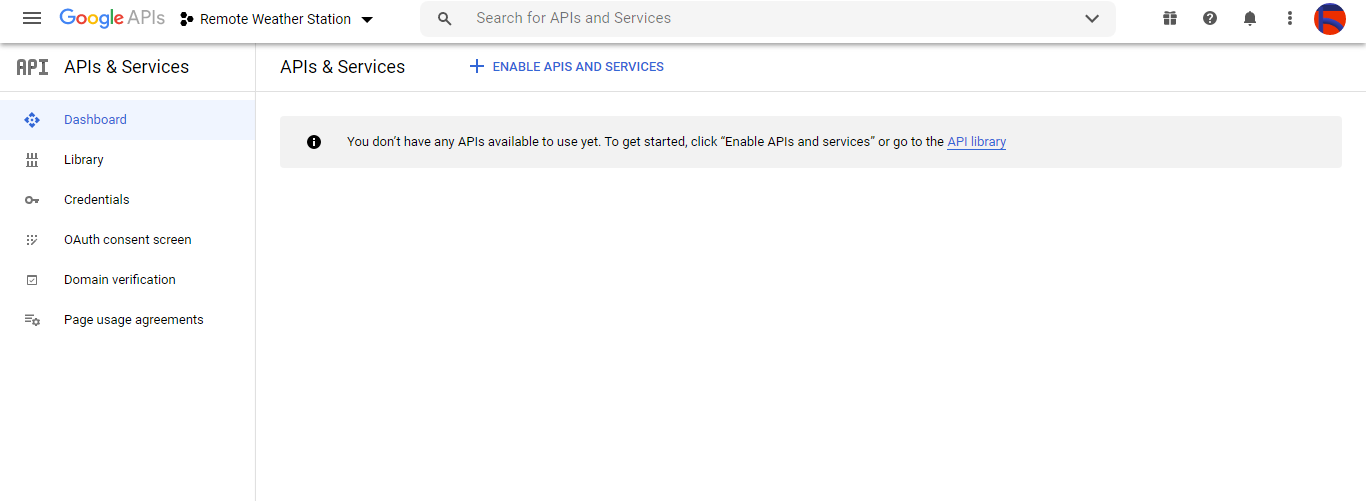
⭐ Google 개발자 콘솔로 이동하여 'NEW PROJECT' 버튼을 클릭합니다. 프로젝트 이름을 Remote Weather Station으로 입력합니다. .

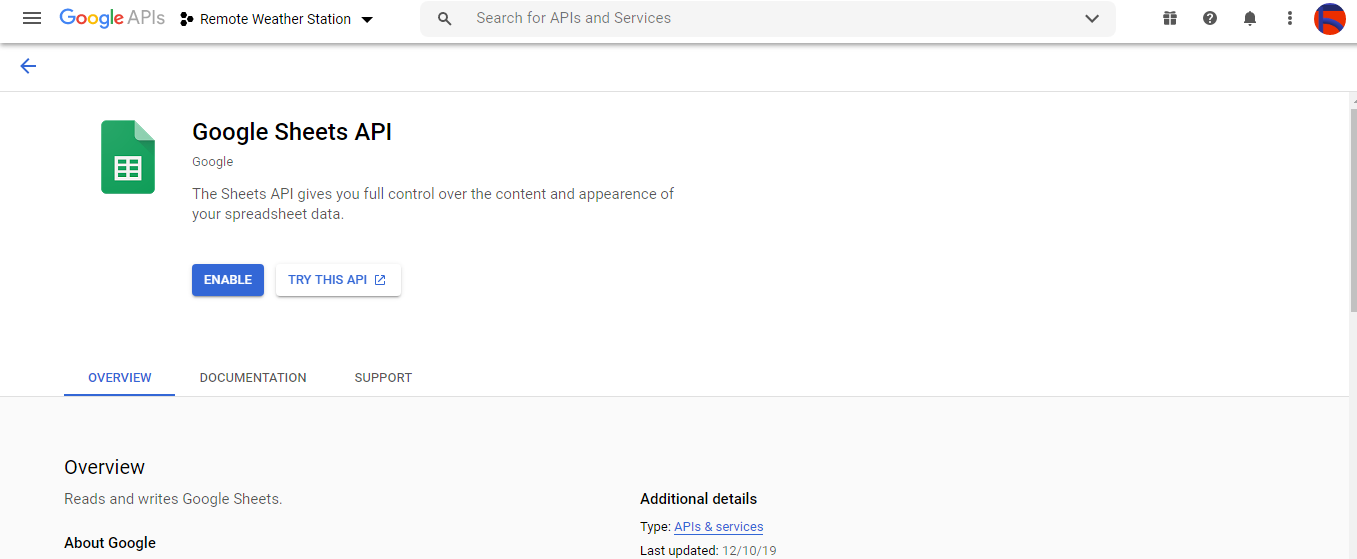
⭐ API 및 서비스로 이동 API 라이브러리를 클릭하여 Google Sheets API를 활성화합니다.
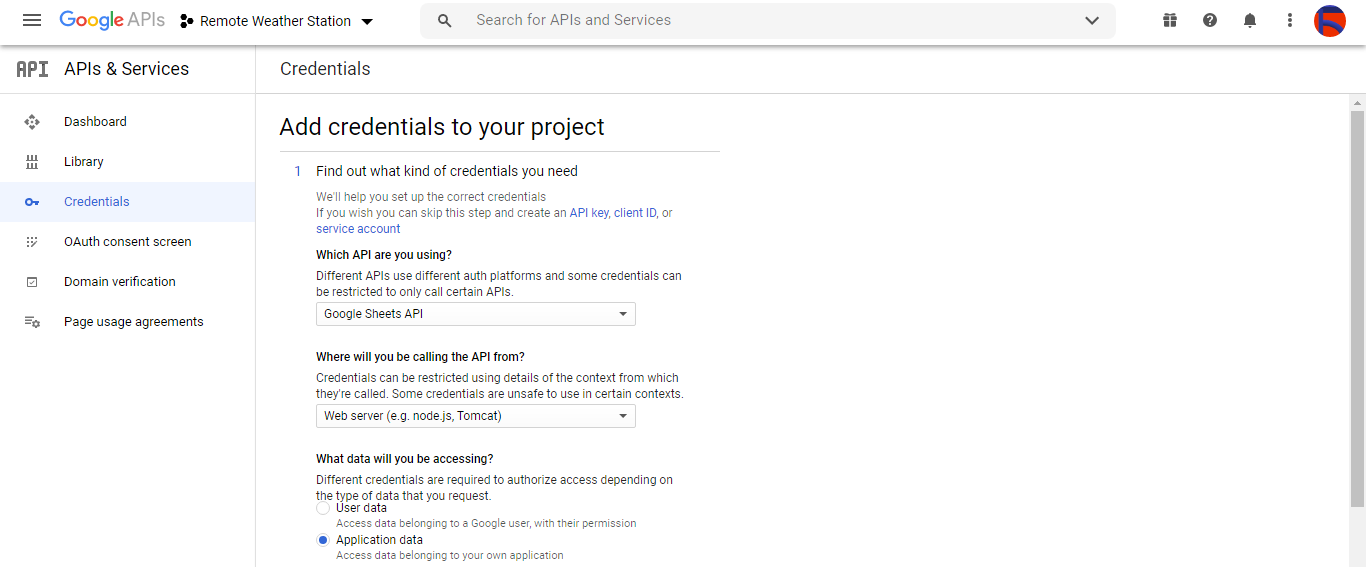
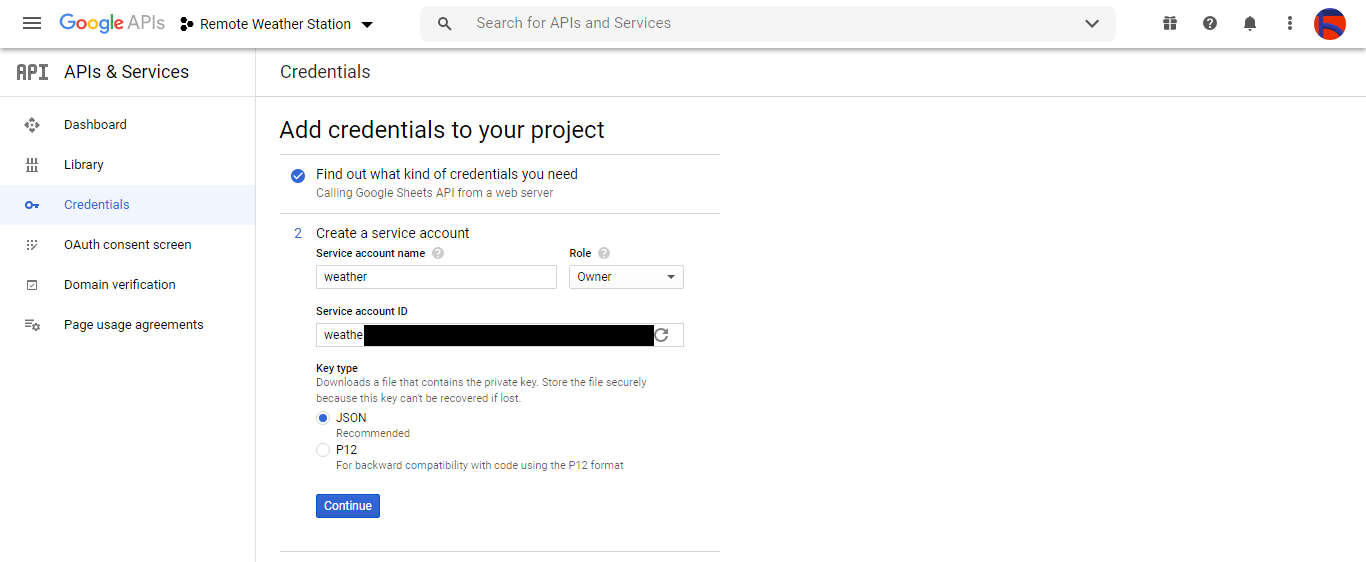
2.1단계:Google Sheets API를 사용하기 위한 자격 증명 얻기
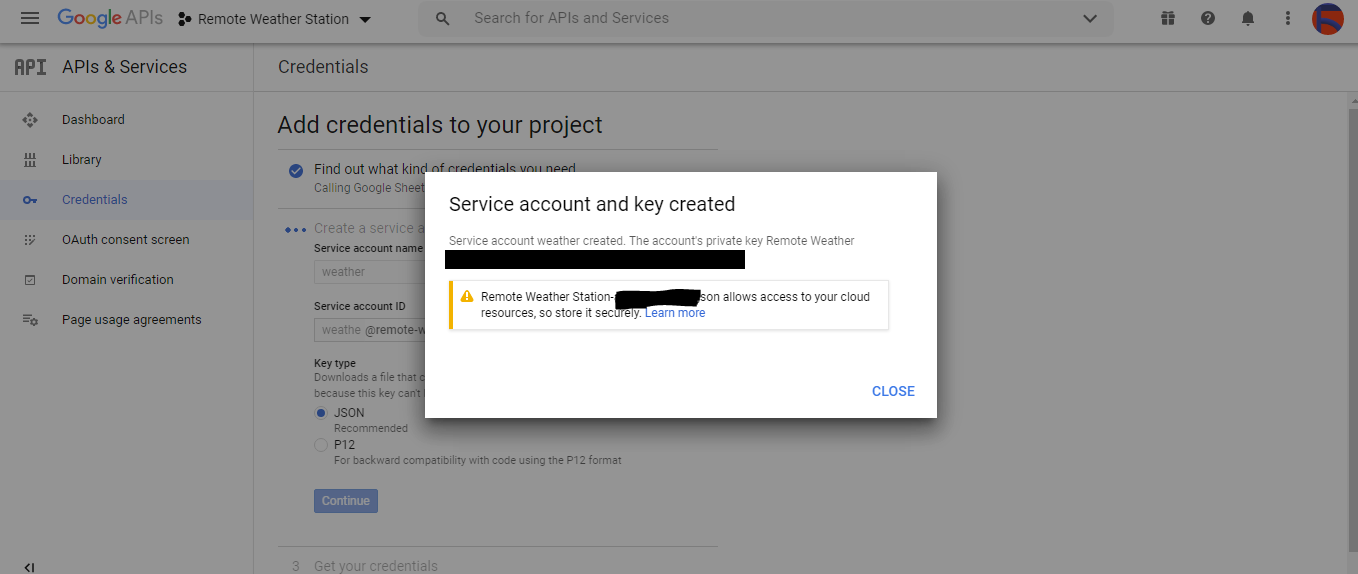
⭐ 프로젝트 대시보드를 열고 자격 증명을 클릭합니다. 단추. 그런 다음 아래 그림과 같이 양식을 작성하여 서비스 계정과 키를 만듭니다.
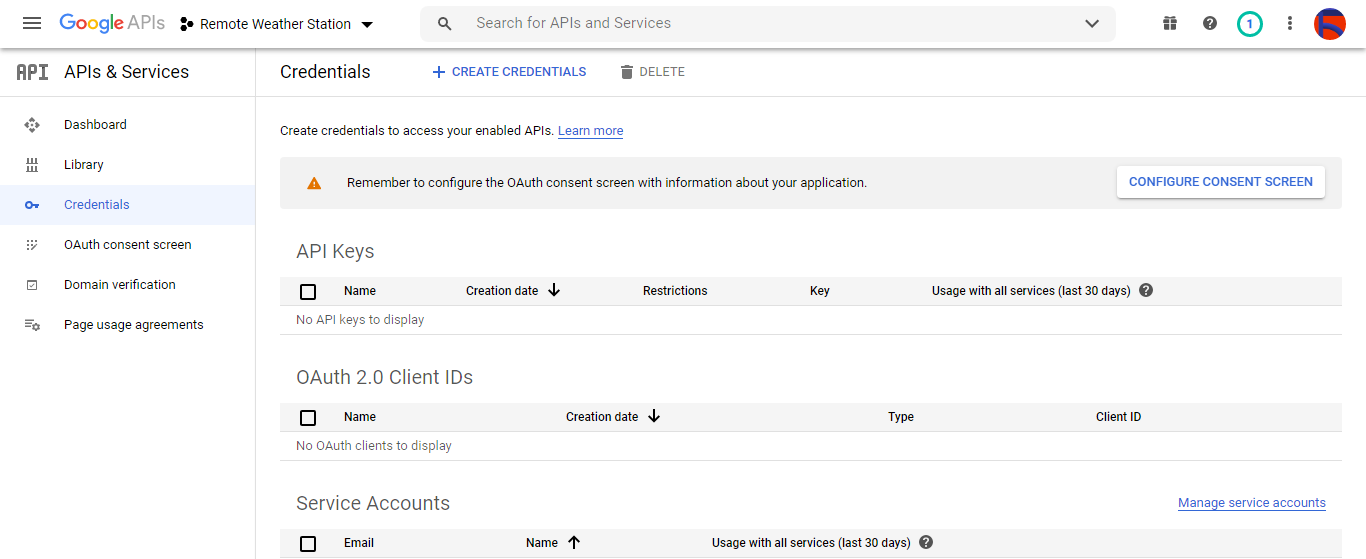
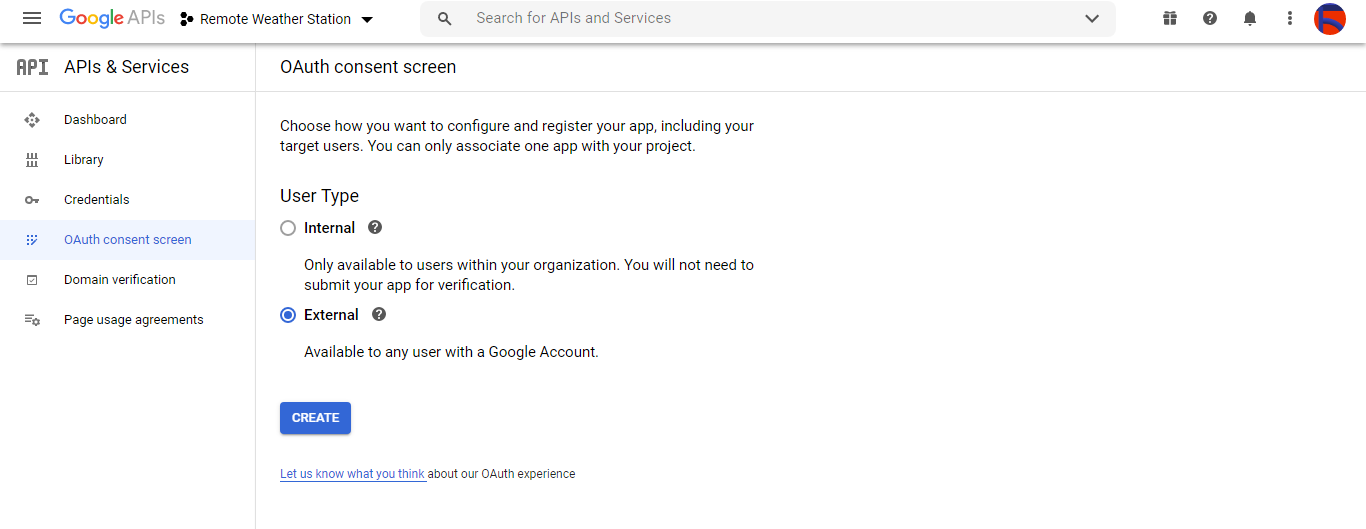
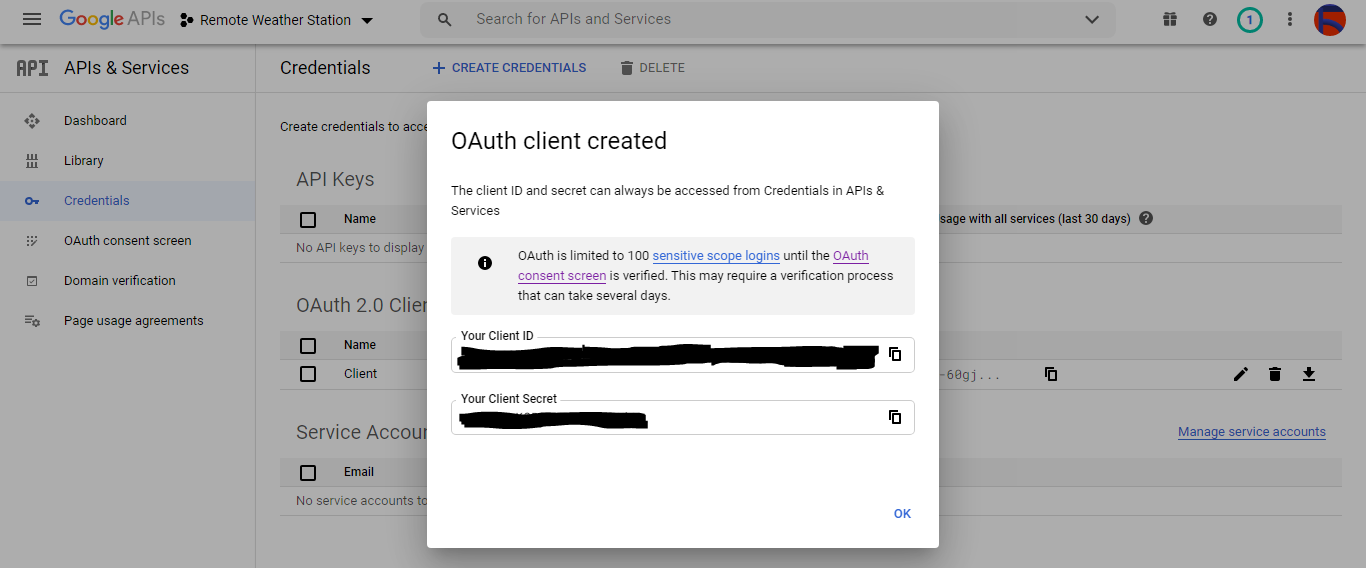
⭐ CREATE CREDENTIALS 클릭 버튼을 클릭하고 동의 화면을 구성하여 OAuth 클라이언트 ID를 생성할 수 있습니다.
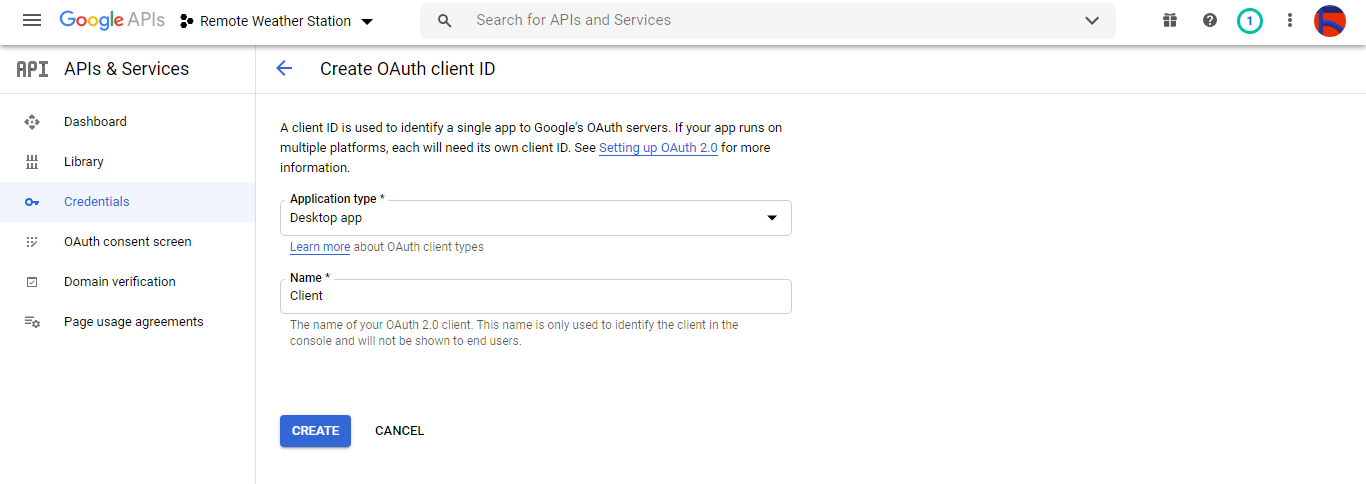
⭐ 그런 다음 클라이언트라는 새 OAuth 클라이언트 ID를 만듭니다. 데스크톱 앱 아래 (응용 프로그램 유형).
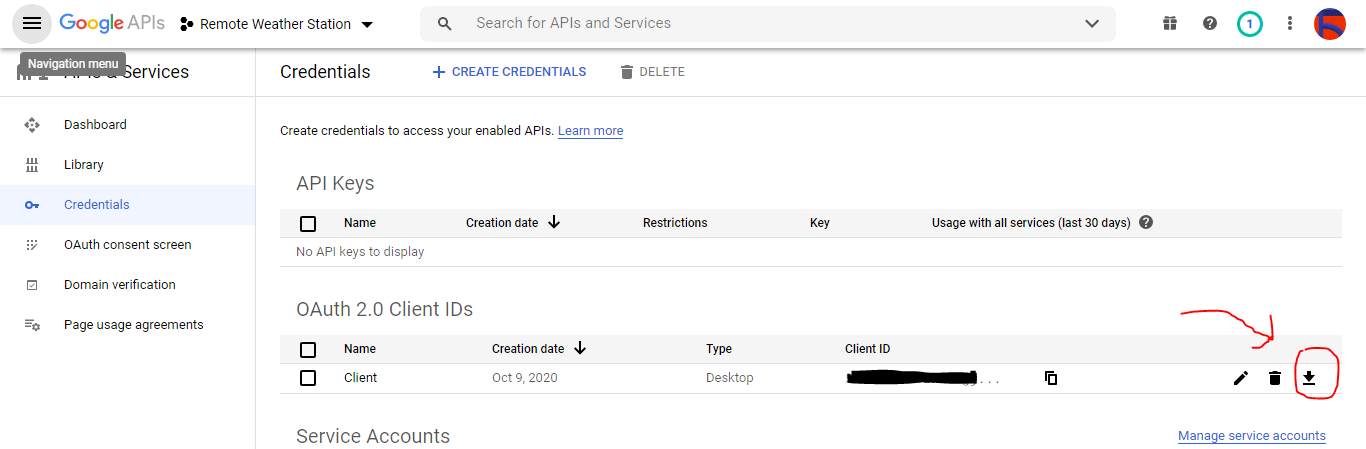
⭐ OAuth 클라이언트 ID (클라이언트) 생성 후 자격 증명(ID 및 비밀)을 다운로드하고 파일 이름을 credentials.json으로 지정합니다. .
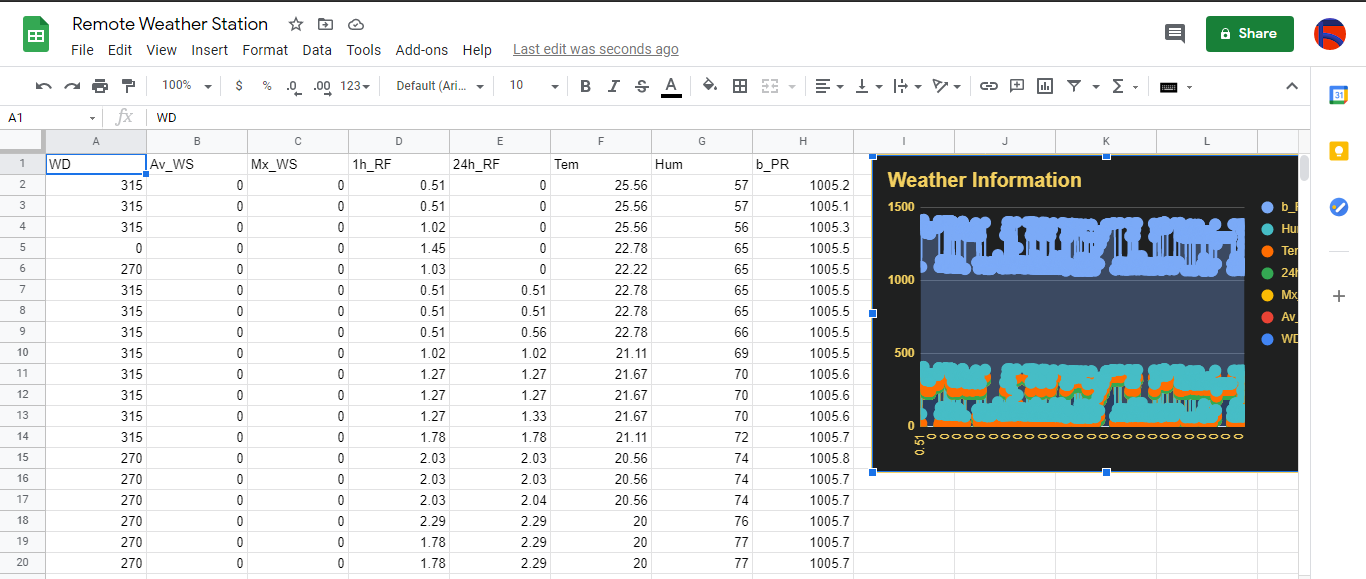
2.2단계:Google 스프레드시트에서 스프레드시트 만들기
⭐ Google 스프레드시트로 이동하여 개인을 선택하세요. .

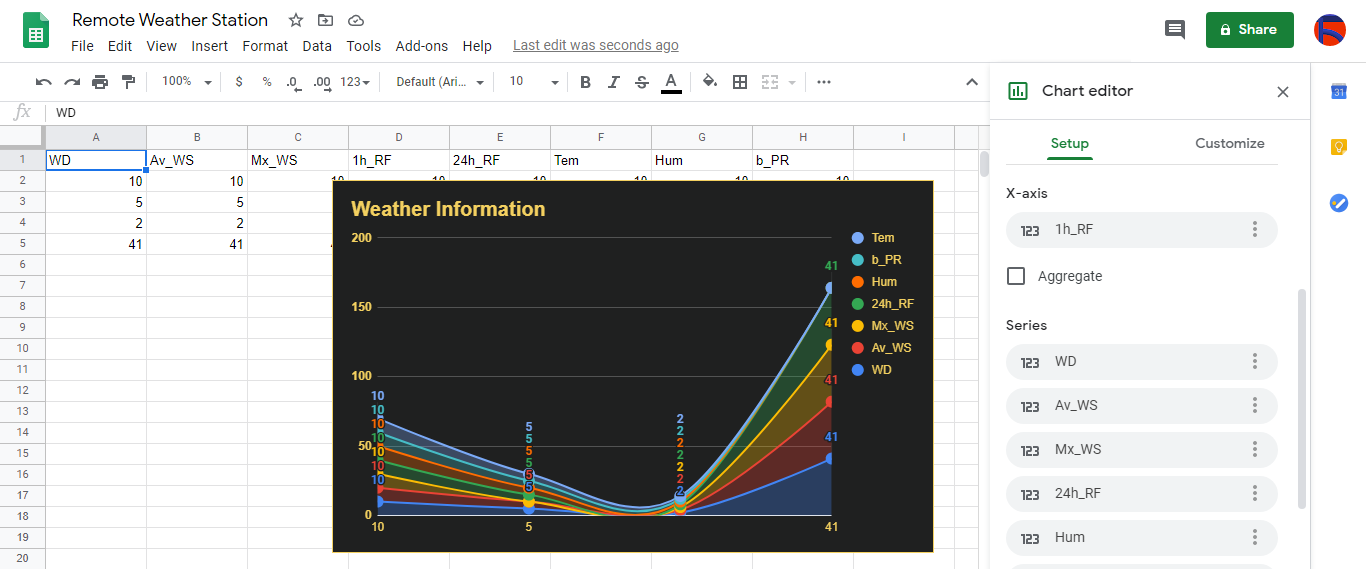
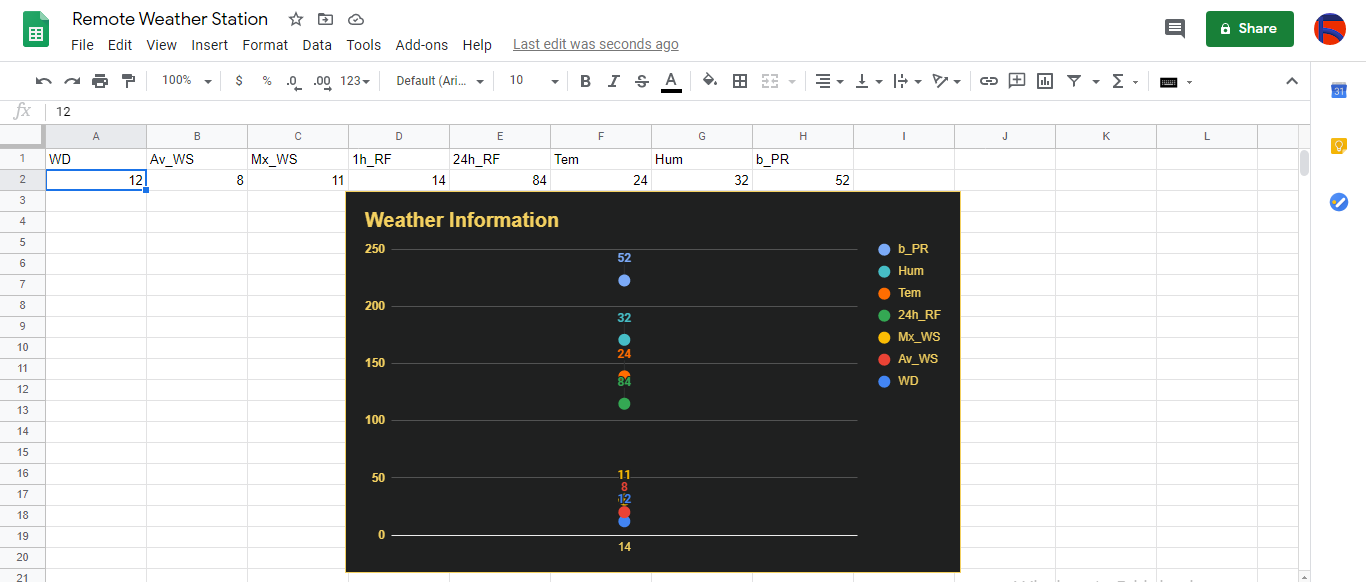
⭐ 공백 만들기 스프레드시트와 이름을 Remote Weather Station으로 지정합니다. .
⭐ 그런 다음 열 이름을 첫 번째 행으로 정의합니다.
<울> WD
Av_WS
Mx_WS
1h_RF
24시간_RF
템
흠
b_PR
⭐ 필요한 경우 차트를 수정하여 저처럼 수집된 데이터를 확인하세요.
3단계:스프레드시트에 날씨 데이터를 추가하기 위해 PHP로 웹 애플리케이션 개발
이 PHP 웹 애플리케이션은 HTTP Get 요청을 통해 개발 보드(ESP8266 및 SIM808)에서 전송한 날씨 데이터를 가져오고 인증된 자격 증명 및 토큰을 사용하여 Google 스프레드시트의 주어진 스프레드시트(ID별)에 해당 데이터를 추가하기 위한 것입니다.
웹 애플리케이션을 사용하려면 PHP용 Google 클라이언트 라이브러리가 Google 스프레드시트의 지정된 스프레드시트에 날씨 데이터를 추가해야 합니다.
⭐ 우선 remote_weather_station이라는 폴더를 만드세요. 서버에 PHP용 Google 클라이언트 라이브러리를 설치합니다.
remote_weather_station 폴더에는 작동하는 Google 클라이언트 라이브러리 외에 다음 4개의 파일이 포함되어야 합니다.
<울> index.php
account_verification_token.php
credentials.json (2.1단계)
token.json (3.1단계)
이 단계에서는 처음 두 파일인 index.php와 account_verification_token.php에 대해 설명하겠습니다.
💻 index.php
⭐ 요청 받기를 통해 기상 관측소에서 지역 날씨 데이터 받기:
// 풍향(wd), 평균 풍속(a_ws), 최대 풍속(m_ws), 1시간 강우량(1_rf), 24시간 강우량(24_rf), 온도(tem), 습도(hum), 기압(b_pr).
$variables_from_module;
if(isset($_GET['wd']) &&isset($_GET['a_ws']) &&isset($_GET['m_ws'] ) &&isset($_GET['1_rf']) &&isset($_GET['24_rf']) &&isset($_GET['tem']) &&isset($_GET['hum']) &&isset($_GET ['b_pr'])){
 $variables_from_module =[
 "wd" => (int)$_GET['wd'],
 "a_ws" => (float)$_GET ['a_ws'],
 "m_ws" => (float)$_GET['m_ws'],
 "1_rf" => (float)$_GET['1_rf'],
 "24_rf" => (float)$_GET['24_rf'],
 "tem" => (float)$_GET['tem'],
 "hum" => (int)$_GET ['hum'],
 "b_pr" => (float)$_GET['b_pr']
 ];
}else{
 $variables_from_module =[
 "wd" => "err",
 "a_ws" => "err",
 "m_ws" => "err",
 "1_rf" => "err",
 "24_rf" => "err",
 "tem" => "err",
 "hum" => "err",
 "b_pr" => "err"
 ];
}
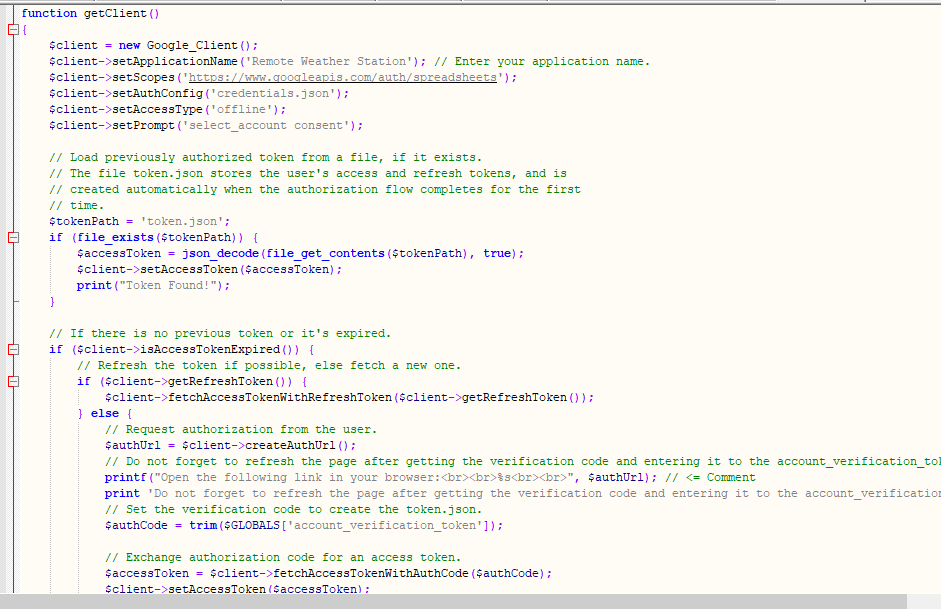
⭐ Remote Weather Station이라는 Google 개발자 콘솔 애플리케이션에 연결합니다. credentials.json을 사용하여 파일 (2.1단계) .
$client =new Google_Client();
 $client->setApplicationName('원격 기상 관측소'); // 애플리케이션 이름을 입력합니다.
 $client->setScopes('https://www.googleapis.com/auth/spreadsheets');
 $client->setAuthConfig('credentials.json');
 $client->setAccessType('오프라인');
 $client->setPrompt('select_account 동의');
⭐ 파일(token.json)에서 이전에 승인된 토큰 로드 ), 존재하는 경우.
$tokenPath ='token.json';
 if (file_exists($tokenPath)) {
 $accessToken =json_decode(file_get_contents($tokenPath), true);
 $client->setAccessToken($accessToken);
 print("토큰을 찾았습니다!");
 }
⭐ 이전 토큰이 없거나 만료된 경우 사용자에게 승인을 요청하고 인증 코드를 설정하여 token.json을 생성합니다. file_put_contents()가 있는 파일 기능.
if ($client->isAccessTokenExpired()) {
 // 가능하면 토큰을 새로고침하고, 그렇지 않으면 새 토큰을 가져옵니다.
 if ($client->getRefreshToken()) {
 $client->fetchAccessTokenWithRefreshToken($client->getRefreshToken());
 } else {
 // 사용자에게 권한 부여를 요청합니다.
 $authUrl =$client->createAuthUrl ();

 ...

 // 인증코드를 설정하여 token.json을 생성합니다.
 $authCode =trim($GLOBALS['account_verification_token' ]);

 ...

 // 오류가 있는지 확인하고 account_verification_token이 입력되었는지 확인합니다.
 if (array_key_exists('error', $accessToken)) {
 throw new Exception(join(', ', $accessToken));
 }else{
 print("성공! 페이지를 새로 고칩니다.");
 }
 }
 // 토큰을 파일에 저장합니다.
 if (!file_exists(dirname($tokenPath))) {
 mkdir(dirname($tokenPath), 0700 , 참);
 }
 file_put_contents($tokenPath, json_encode($client->getAccessToken()));
 }
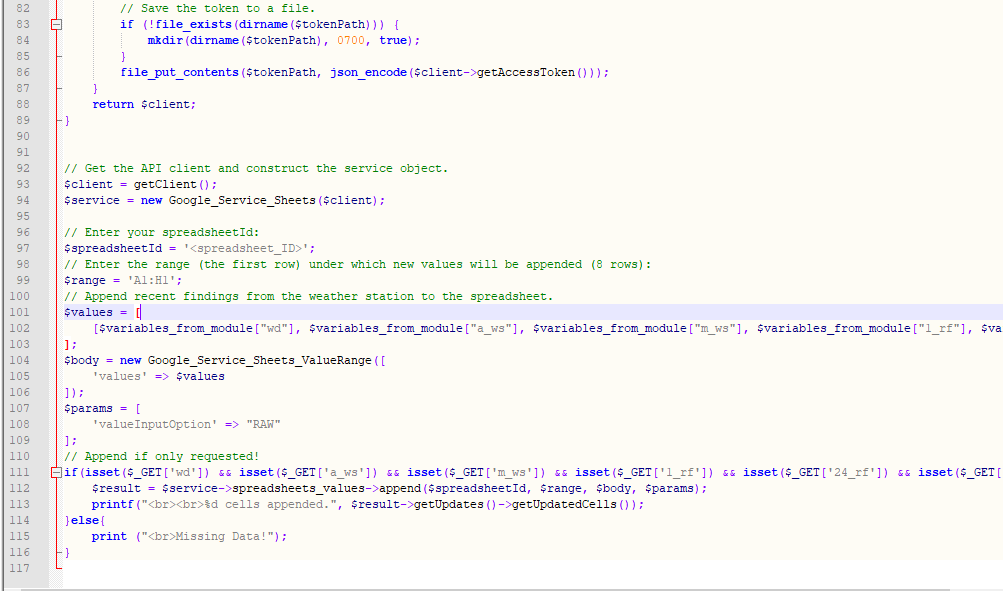
⭐ 스프레드시트 ID와 범위를 입력하여 기상 관측소의 최근 결과를 스프레드시트에 추가합니다.
https://docs.google.com/spreadsheets/d/spreadsheetId/edit#gid=0
// 스프레드시트 ID 입력:
$spreadsheetId ='';
// 새 값이 추가될 범위(첫 번째 행) 입력(8행) :
$range ='A1:H1';
// 기상 관측소의 최근 결과를 스프레드시트에 추가합니다.
$values =[
[$variables_from_module["wd" ], $variables_from_module["a_ws"], $variables_from_module["m_ws"], $variables_from_module["1_rf"], $variables_from_module["24_rf"], $variables_from_module["tem"], $variables["_from"_ $variables_from_module["b_pr"]]
];
$body =new Google_Service_Sheets_ValueRange([
'값' => $values
]);
$params =[
'valueInputOption' => "RAW"
];
...
$result =$service->spreadsheets_values->append( $spreadsheetId, $range, $body, $params);
printf("
%d개의 셀이 추가되었습니다.", $result->getUpdates()->getUpdatedCells());
💻 account_verification_token.php
⭐ 생성된 AuthUrl으로 웹 애플리케이션을 승인한 후 , 주어진 인증 코드를 입력하여 액세스 토큰을 설정하십시오.
$account_verification_token ="<토큰 입력>"; // 인증 후 인증번호를 입력하세요.
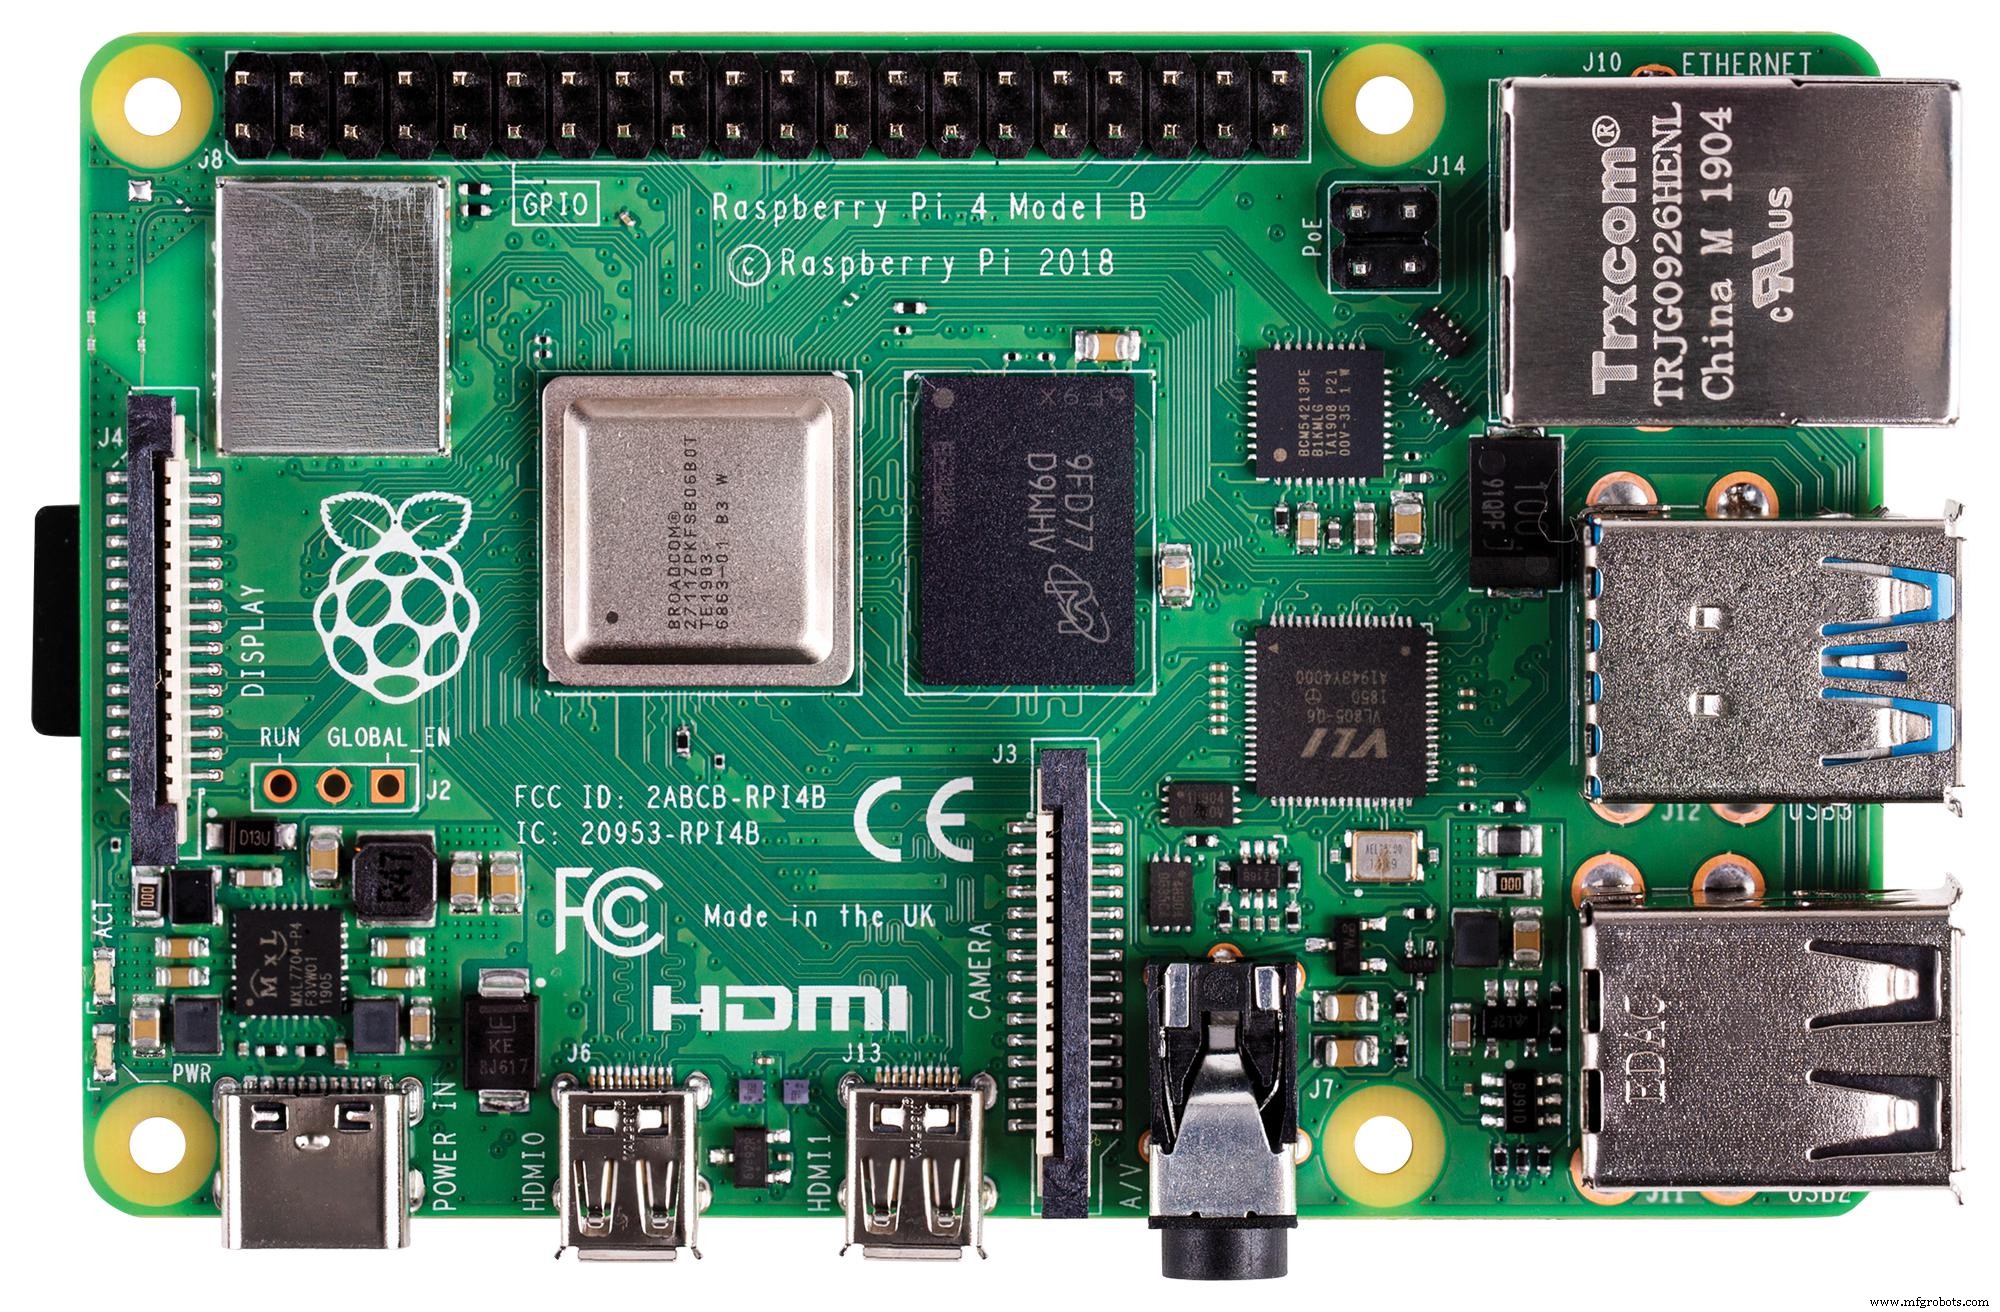
3.1단계:Raspberry Pi(또는 모든 서버)에서 웹 애플리케이션 설정
PHP 웹 애플리케이션을 만든 후 내 라즈베리 파이에서 실행하기로 했지만 PHP 서버라면 어떤 서버에서도 실행할 수 있습니다.
Raspberry Pi를 사용하고 싶지만 Raspberry Pi에서 LAMP 웹 서버를 설정하는 방법을 모르는 경우 이 튜토리얼을 살펴보세요.
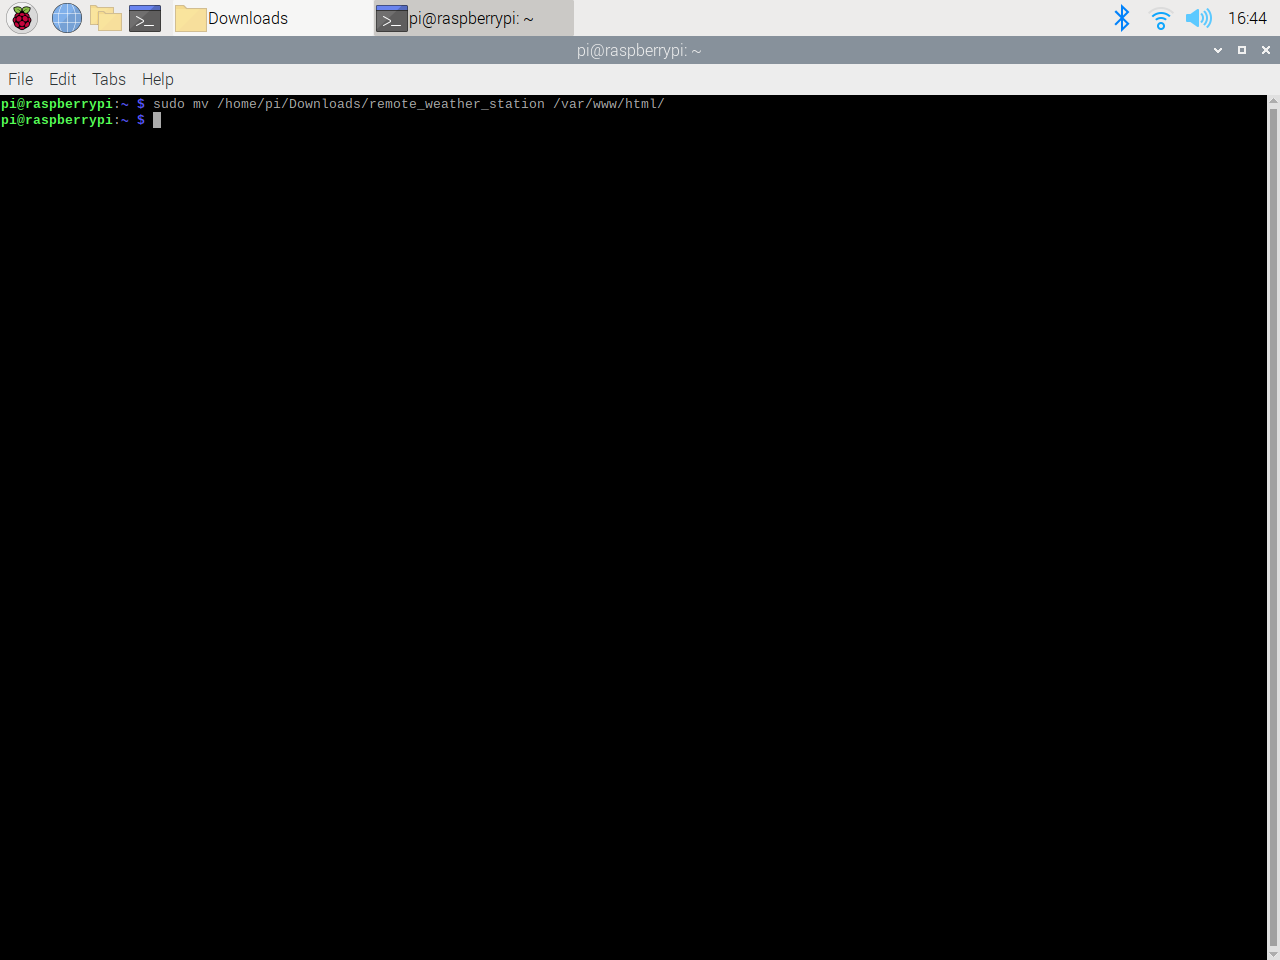
⭐ 우선 아파치 서버는 보호된 위치이므로 터미널을 이용하여 애플리케이션 폴더(remote_weather_station)를 아파치 서버(/var/www/html)로 이동합니다.
sudo mv /home/pi/Downloads/remote_weather_station /var/www/html/
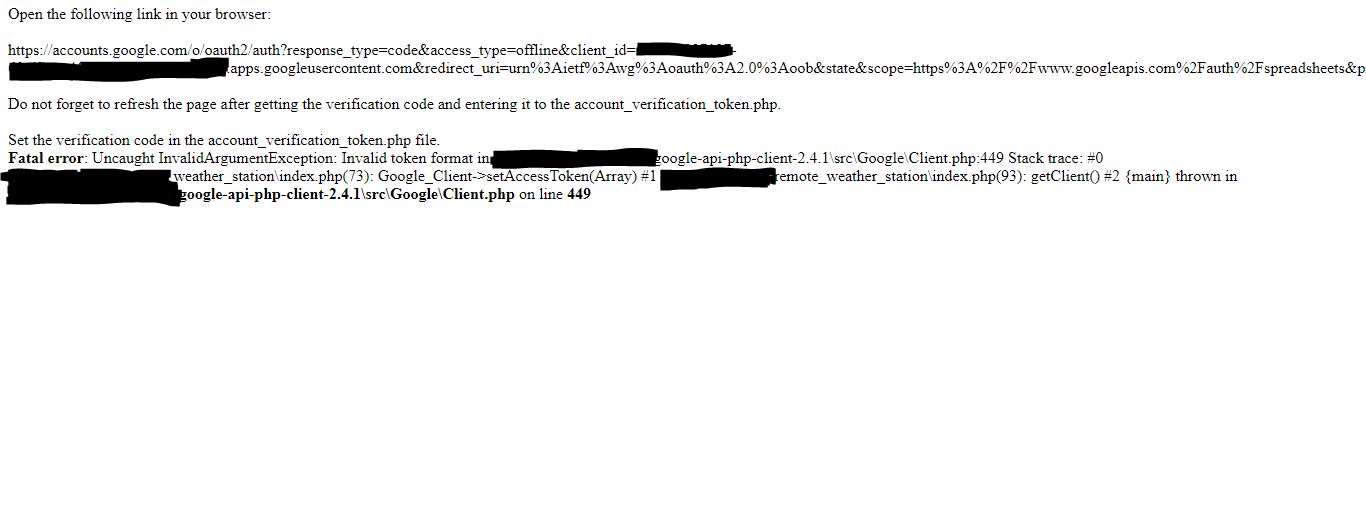
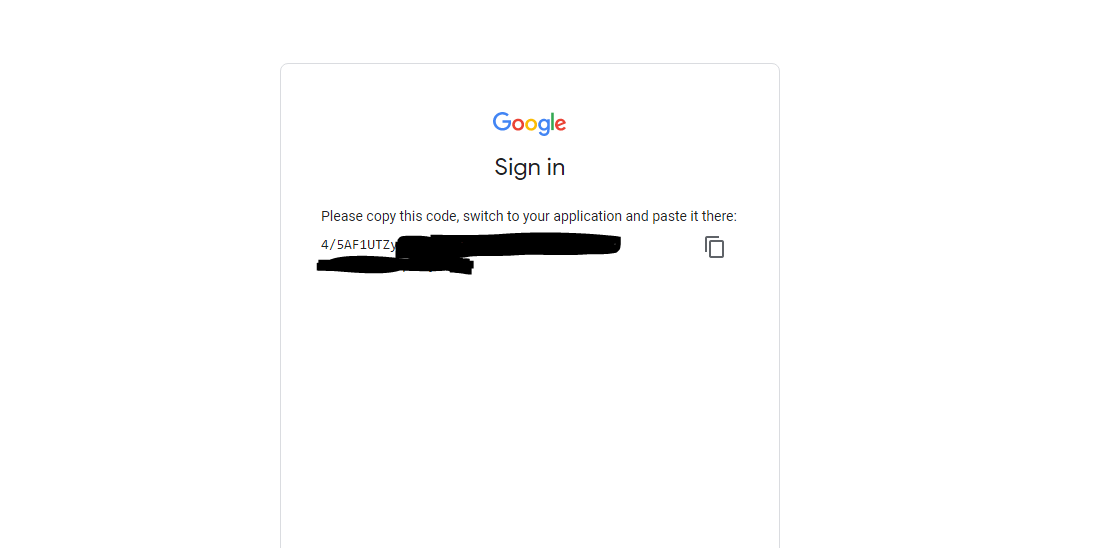
⭐ 웹 애플리케이션을 처음 열 때 인증 코드 누락으로 인해 오류가 발생합니다. 인증 코드를 받으려면 애플리케이션에서 생성된 인증 링크로 이동하십시오.
⭐ 그런 다음 원격 기상 관측소로 이동(안전하지 않음)을 클릭합니다. .
⭐ 필요한 권한을 애플리케이션에 부여합니다.
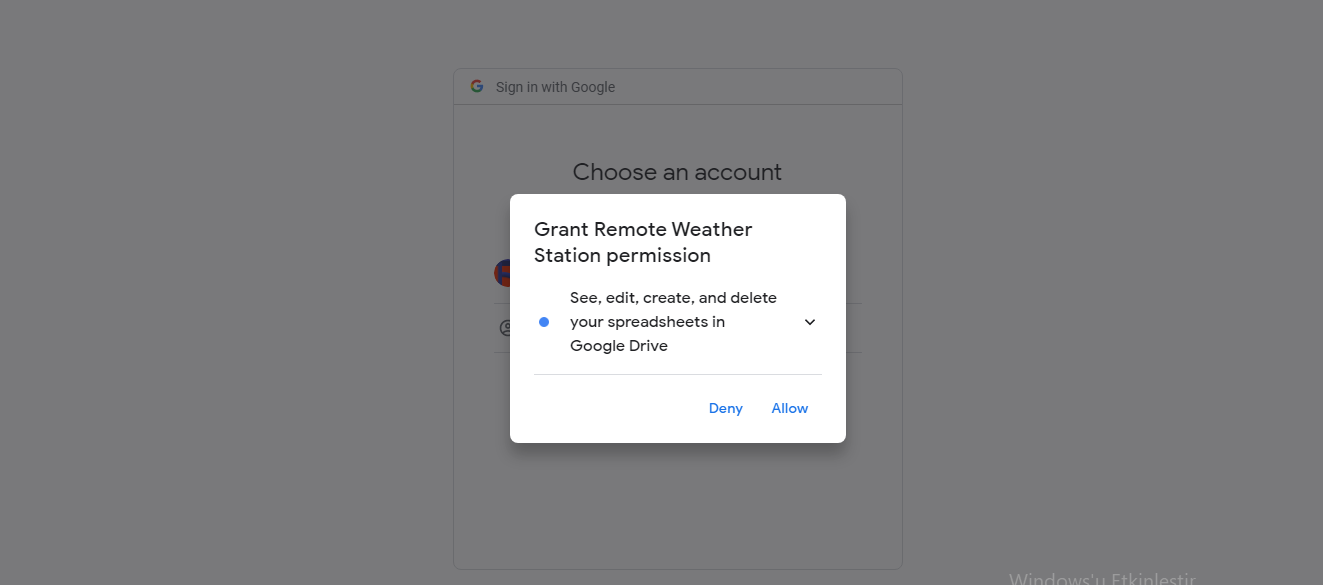
⭐ 이제 인증 코드를 복사하여 account_verification_token.php에 붙여넣으세요. .
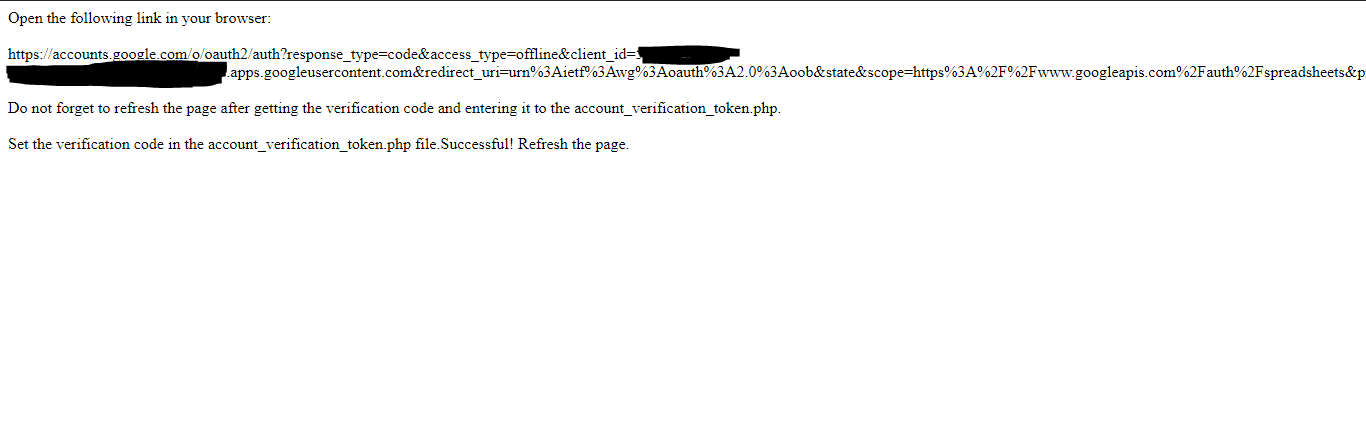
⭐ 웹 애플리케이션으로 돌아갑니다. 확인 메시지가 표시되어야 합니다. 성공! 페이지 새로고침 .
⭐ 페이지를 새로고침한 후 웹 애플리케이션은 인증 코드를 사용하여 액세스 토큰을 가져오고 token.json이라는 파일에 액세스 토큰을 저장합니다. . 따라서 다시 오류가 발생하지 않습니다.

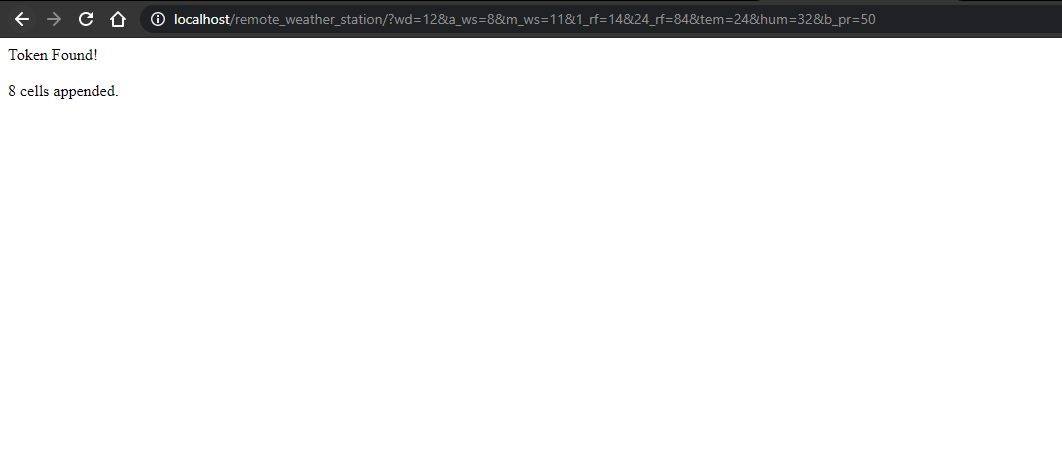
⭐ PHP 웹 애플리케이션이 새 데이터를 주어진 스프레드시트에 정확하게 추가하는지 테스트하려면:
http://localhost/remote_weather_station/?wd=12&a_ws=8&m_ws=11&1_rf=14&24_rf=84&tem=24&hum=32&b_pr=57
4단계:ESP8266(WiFi)으로 날씨 데이터 읽기 및 보내기
발코니에서 기상 데이터를 수집하기 위해 기상 관측소와 함께 NodeMCU ESP-12E(ESP8266) 개발 보드를 사용했습니다.
5분마다 PHP 웹 애플리케이션에 날씨 데이터를 보내도록 프로그래밍했습니다.

⭐ 필수 라이브러리를 포함하고 WiFi 설정을 정의합니다.
#include
#include
#include
#include
 #include

// WiFi 설정을 정의합니다.
const char *ssid ="";
const char *password =" ";
⭐ 기상 관측소 설정 및 직렬 연결 핀 정의 - D6, D5.
// 기상 관측소 설정 정의:
char databuffer[35];
double temp;
int transfer =0;

// Define 직렬 연결 핀 - RX 및 TX.
SoftwareSerial Serial_1(D6, D5); // (수신, 전송)
⭐ getBuffer()에서 기능을 사용하여 기상 관측소에서 데이터를 가져옵니다.
void getBuffer(){
 int index;
 for (index =0;index <35;index ++){
 if(Serial_1.available()){
 데이터 버퍼[인덱스] =Serial_1.read();
 if (databuffer[0] !='c'){
 인덱스 =-1;
 }
 }
 else{
 인덱스 --;
 }
 }
}
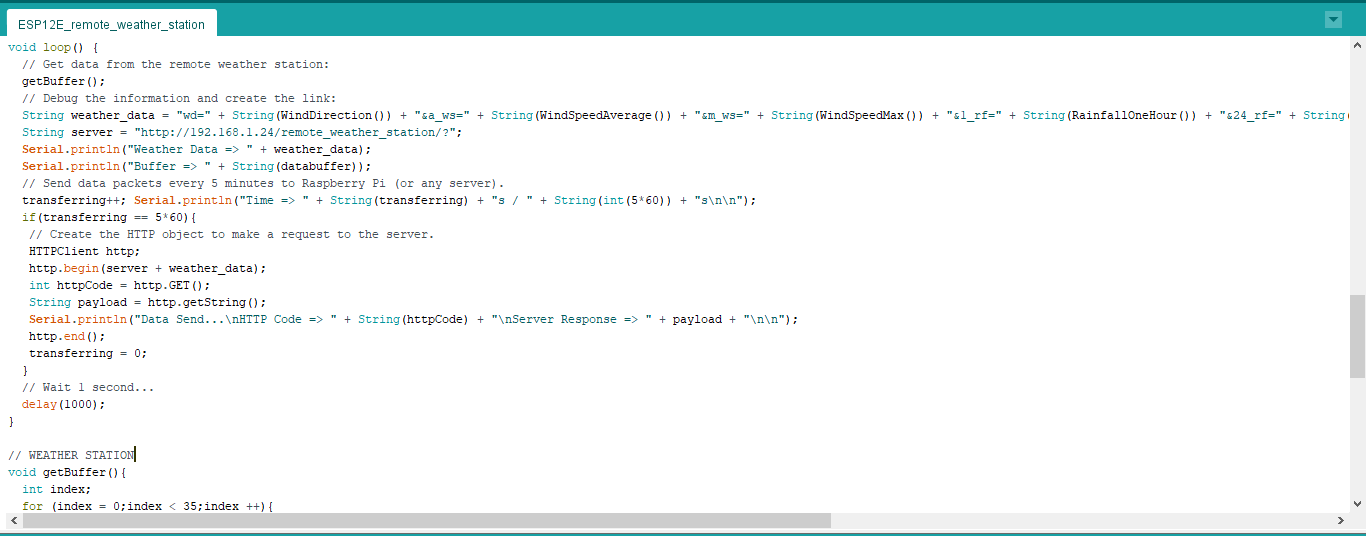
⭐ 날씨 데이터를 디버그하고 링크를 만드세요.
문자열 weather_data ="wd=" + 문자열(WindDirection()) + "&a_ws=" + 문자열(WindSpeedAverage()) + "&m_ws=" + 문자열(WindSpeedMax()) + "&1_rf=" + String(RainfallOneHour()) + "&24_rf=" + String(RainfallOneDay()) + "&tem=" + String(Temperature()) + "&hum=" + String(Humidity()) + "&b_pr=" + String( BarPressure());
문자열 서버 ="http://192.168.1.24/remote_weather_station/?";

...

int WindDirection(){ return transCharToInt(databuffer,1,3); } // 바람의 방향(deg)

float WindSpeedAverage(){ temp =0.44704 * transCharToInt(databuffer,5,7); 반환 온도; } // 평균 공기 속도(1분)

float WindSpeedMax(){ temp =0.44704 * transCharToInt(databuffer,9,11); 반환 온도; } //최대 공기 속도(5분)

float Temperature(){ temp =(transCharToInt(databuffer,13,15) - 32.00) * 5.00 / 9.00; 반환 온도; } // 온도("C")

float RainfallOneHour(){ temp =transCharToInt(databuffer,17,19) * 25.40 * 0.01; 반환 온도; } // 강우량(1시간)

float RainfallOneDay(){ temp =transCharToInt(databuffer,21,23) * 25.40 * 0.01; 반환 온도; } // 강우량(24시간)

int Humidity(){ return transCharToInt(databuffer,25,26); } // 습도(%)

float BarPressure(){ temp =transCharToInt(databuffer,28,32); 반환 온도 / 10.00; } // 기압(hPA)
⭐ 5분마다 데이터 패킷을 Raspberry Pi(또는 모든 서버)로 보냅니다.
<사전><코드>전송++; Serial.println("시간 => " + 문자열(전송) + "s / " + 문자열(int(5*60)) + "s\n\n");
if(전송 ==5* 60){
// 서버에 요청할 HTTP 객체를 생성합니다.
HTTPClient http;
http.begin(서버 + weather_data);
int httpCode =http.GET();
String payload =http.getString();
Serial.println("Data Send...\nHTTP Code => " + String(httpCode) + "\nServer Response => " + payload + "\n\n");
http.end();
transferring =0;
}
// Wait 1 second...
delay(1000);
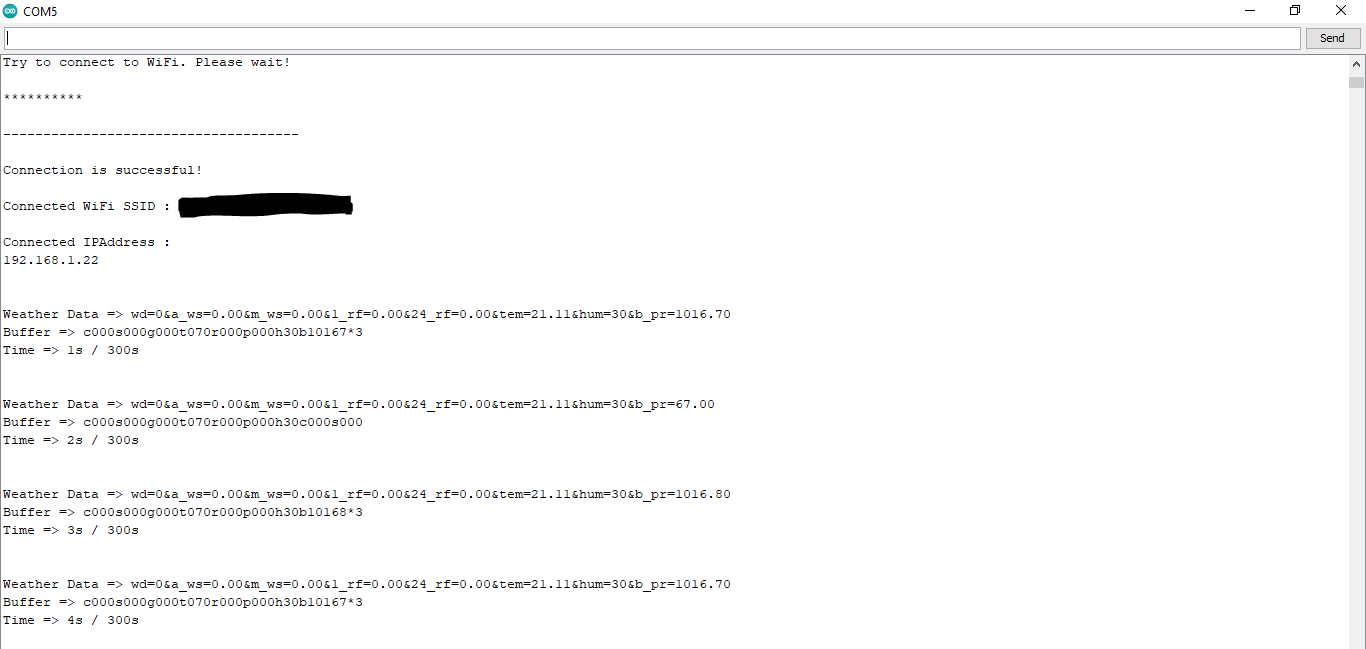
⭐ After uploading the code to the NodeMCU ESP-12E (ESP8266) development board, it displays weather data every second on the serial monitor and sends data packets every five minutes (300 seconds) to the PHP web application.
Connection is successful!

...

Weather Data => wd=0&a_ws=0.00&m_ws=0.00&1_rf=0.00&24_rf=0.00&tem=21.67&hum=29&b_pr=1016.70
Buffer => c000s000g000t071r000p000h29b10167*3
Time => 299s / 300s


Weather Data => wd=0&a_ws=0.00&m_ws=0.00&1_rf=0.00&24_rf=0.00&tem=21.67&hum=29&b_pr=1016.70
Buffer => c000s000g000t071r000p000h29b10167*3
Time => 300s / 300s

...
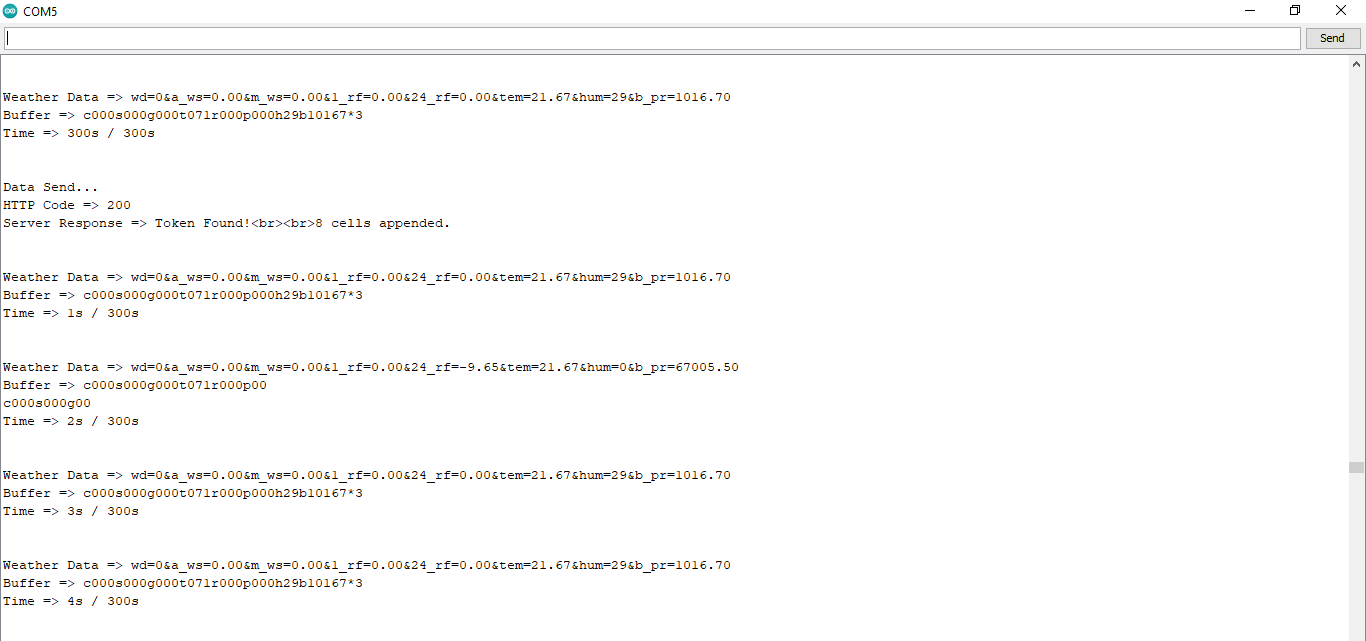
⭐ Then, it shows the response from the server.
...

Data Send...
HTTP Code => 200
Server Response => Token Found!

8 cells appended.

...
Step 4.1:Reading and sending weather data with SIM808 (GPRS)
To collect weather data in my backyard, I used a SIM808 shield for Arduino Uno if the distance between the weather station and my router is too far away.
Most of the code is the same and covered in the previous step aside from the parts below.
⭐ Include required libraries and define the sim808 object.
For SIM808 GPS/GPRS/GSM Shield | Download
#include
#include

// Define the sim808.
DFRobot_SIM808 sim808(&Serial);
⭐ Initialize the SIM808 module and continue if it is working accurately.
//******** Initialize sim808 module *************
 while(!sim808.init()) {
 delay(1000);
 Serial.print("Sim808 init error\r\n");
 }
 delay(2000);
 // Continue if the SIM808 Module is working accurately.
 Serial.println("Sim808 init success");
 delay(5000);
⭐ Send data packets every 5 minutes to the server by establishing a TCP connection to make a GET request.
transferring++; Serial.println("Time => " + String(transferring) + "s / " + String(int(5*60)) + "s\n\n");
 if(transferring ==5*60){
 //*********** Attempt DHCP *******************
 while(!sim808.join(F("cmnet"))) {
 Serial.println("Sim808 join network error!");
 delay(2000);
 }
 //************ Successful DHCP ****************
 delay(5000);
 Serial.println("Successful DHCP");
 //*********** Establish a TCP connection ************
 if(!sim808.connect(TCP,"192.168.1.24", 80)) { // Change it with your server.
 Serial.println("Connection Error");
 }else{
 Serial.println("Connection OK");
 }
 delay(2000);

 ...
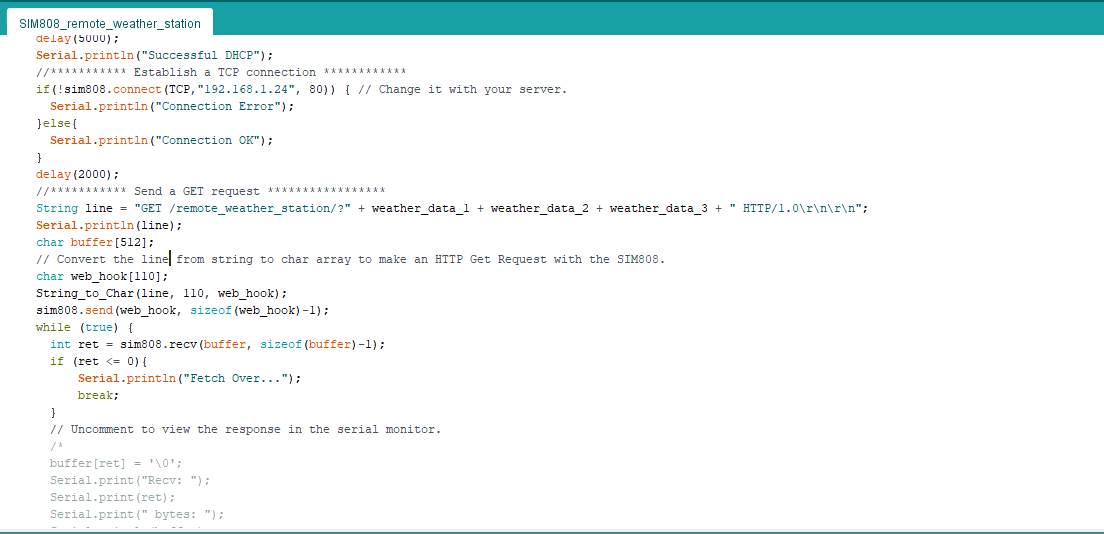
⭐ After creating the line string, convert it from string to char array to make an HTTP Get Request with the SIM808.
...

 String line ="GET /remote_weather_station/?" + weather_data_1 + weather_data_2 + weather_data_3 + " HTTP/1.0\r\n\r\n";
 Serial.println(line);
 char buffer[512];
 // Convert the line from string to char array to make an HTTP Get Request with the SIM808.
 char web_hook[110];
 String_to_Char(line, 110, web_hook);
 sim808.send(web_hook, sizeof(web_hook)-1);
 while (true) {
 int ret =sim808.recv(buffer, sizeof(buffer)-1);
 if (ret <=0){
 Serial.println("Fetch Over...");
 break;
 }

 ...
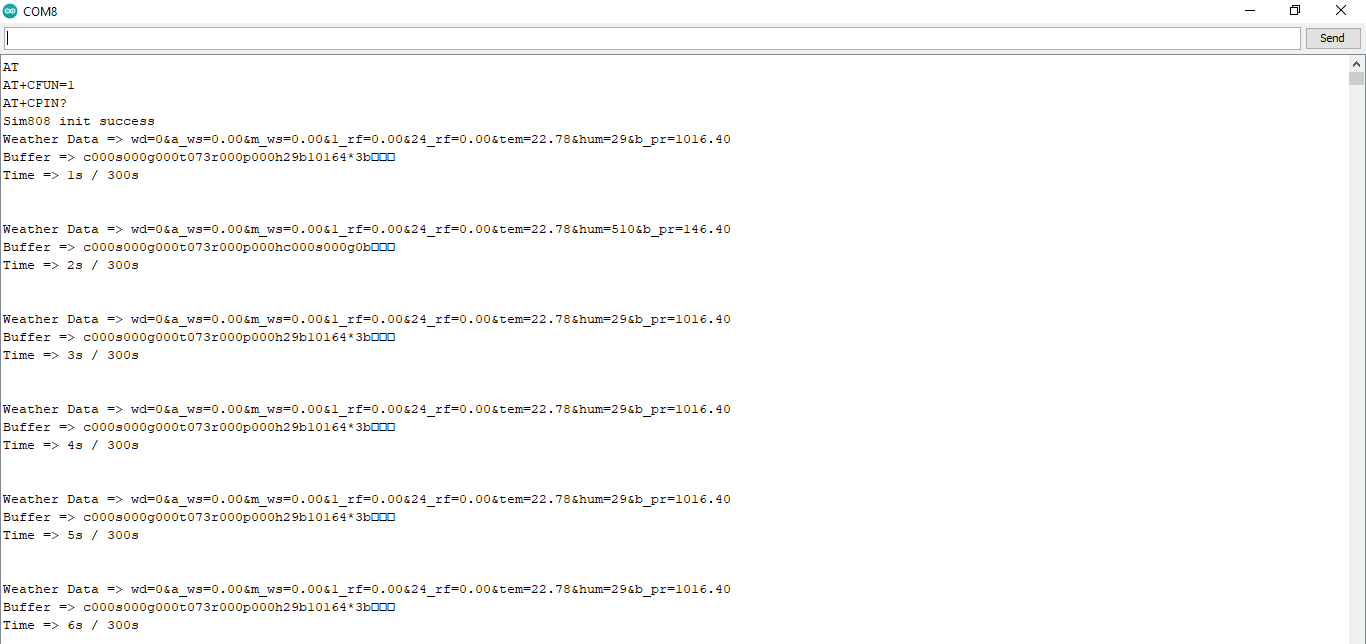
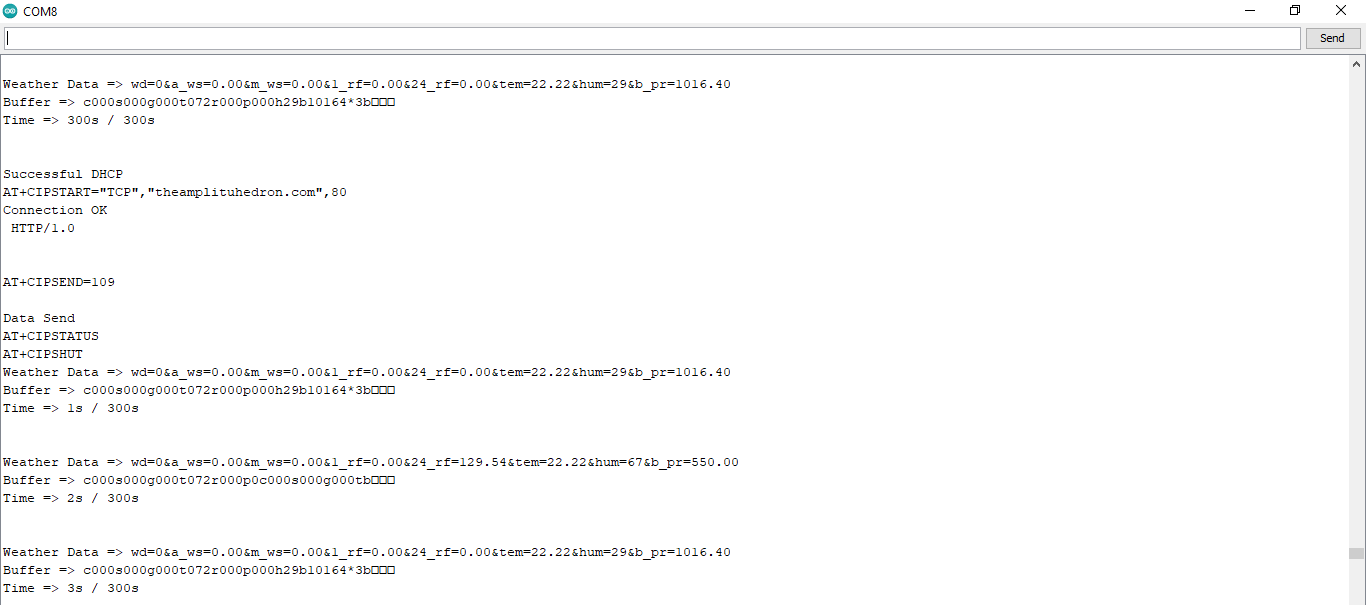
⭐ After uploading the code to the SIM808 shield, it displays weather data every second on the serial monitor and sends data packets every five minutes (300 seconds) to the PHP web application.
Step 4.2:Creating the weather data set for more than three months
After finishing coding, I started to collate weather data on Google Sheets every five minutes for more than three months to build a neural network model and make predictions on the rainfall intensity.
Collected Weather Data:
<울> Wind Direction (deg)
Average Wind Speed (m/s)
Max Wind Speed (m/s)
One-Hour Rainfall (mm)
24-Hours Rainfall (mm)
Temperature (°C)
Humidity (%)
Barometric Pressure (hPa)
Then, I downloaded the spreadsheet as Remote Weather Station.csv , consisting of 32219 rows as my preliminary local weather data set. I am still collating weather data to improve my data set and model :)
Step 5:Building an Artificial Neural Network (ANN) with TensorFlow
When I completed collating my preliminary local weather data set, I started to work on my artificial neural network (ANN) model to make predictions on the rainfall intensity.
I decided to create my neural network model with TensorFlow in Python. So, first of all, I followed the steps below to grasp a better understanding of the weather data:
<울> Data Visualization
Data Scaling (Normalizing)
Data Preprocessing
Data Splitting
After applying these steps, I decided to use my neural network model to classify different rainfall intensity classes theoretically assigned as labels (outputs) for each input (row). I created my classes according to the rate of precipitation, which depends on the considered time.
The following categories are used to classify rainfall intensity by the rate of precipitation (rainfall):
<울> Light rain — when the precipitation rate is <2.5 mm per hour
Moderate rain — when the precipitation rate is between 2.5 mm and 7.6 mm per hour
Heavy rain — when the precipitation rate is between 7.6 mm and 50 mm per hour
Violent rain — when the precipitation rate is> 50 mm per hour
According to the precipitation (rainfall) rates, I preprocessed the weather data to assign one of these five classes for each input as its label:
<울> 0 (None)
1 (Light Rain)
2 (Moderate Rain)
3 (Heavy Rain)
4 (Violent Rain)
After scaling (normalizing) and preprocessing the weather data, I elicited seven input variables and one label for each reading, classified with the five mentioned classes. Then, I built an artificial neural network model with TensorFlow to obtain the best possible results and predictions with my preliminary data set.
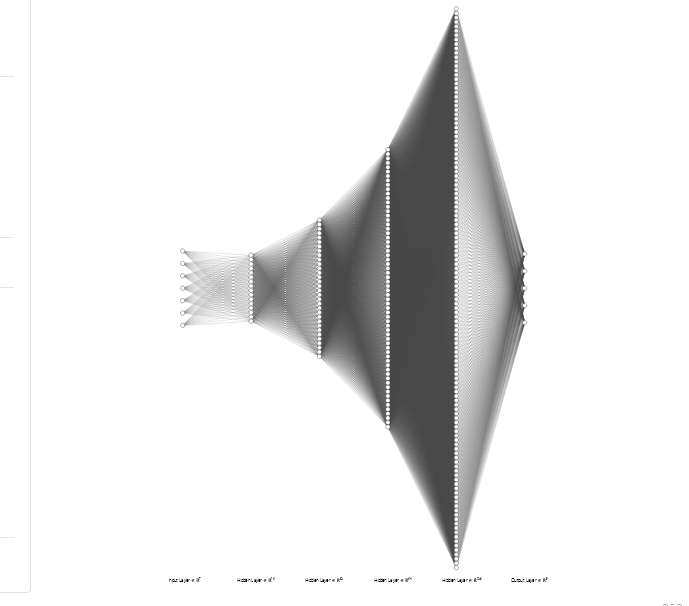
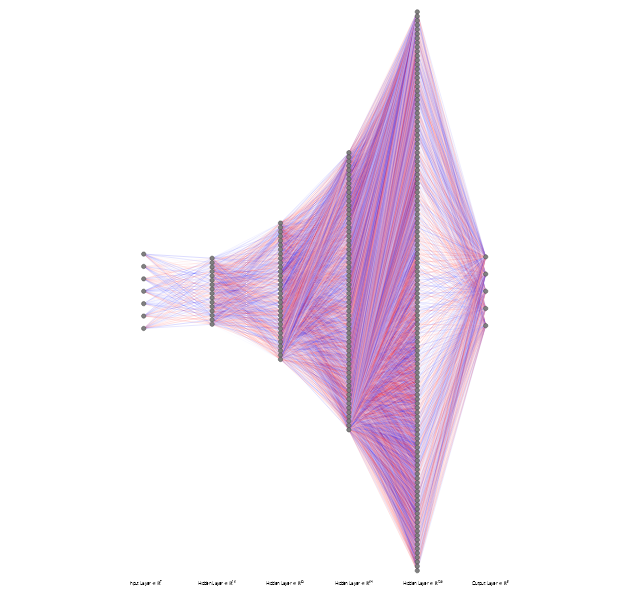
Layers:
<울> 7 [Input]
16 [Hidden]
32 [Hidden]
64 [Hidden]
128 [Hidden]
5 [Output]
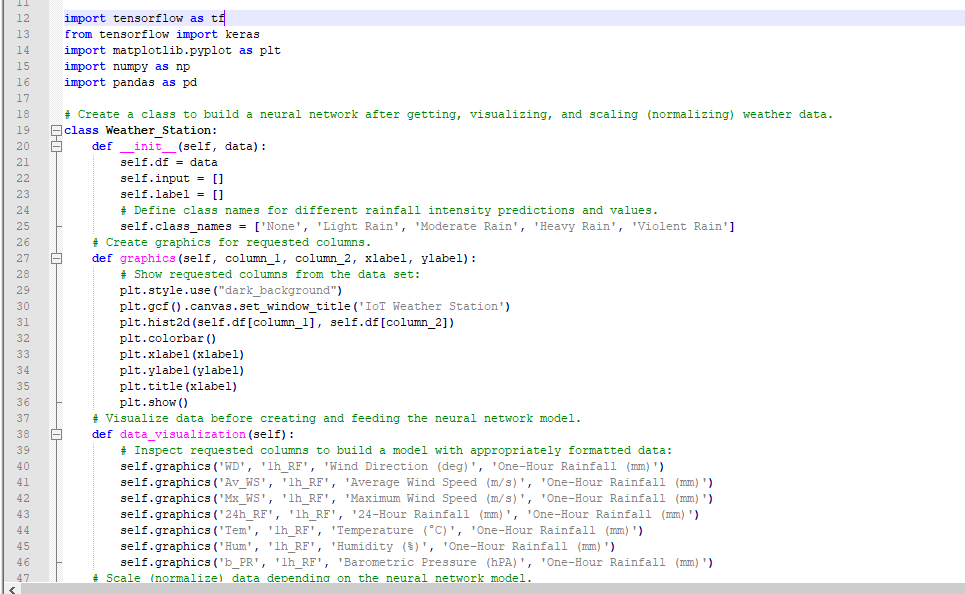
To execute all steps above, I created a class named Weather_Station in Python after including the required libraries:
import tensorflow as tf
from tensorflow import keras
import matplotlib.pyplot as plt
import numpy as np
import pandas as pd
Subsequently, I will discuss coding in Python for each step I mentioned above.
Also, you can download IoT_weather_station_neural_network.py to inspect coding.
Step 5.1:Visualizing and scaling (normalizing) the weather data
Before diving in to build a model, it is important to understand the weather data to pass the model appropriately formatted data.
So, in this step, I will show you how to visualize weather data and scale (normalize) in Python.
⭐ First of all, read the weather data from Remote Weather Station.csv .
csv_path ="E:\PYTHON\Remote Weather Station.csv"
df =pd.read_csv(csv_path)
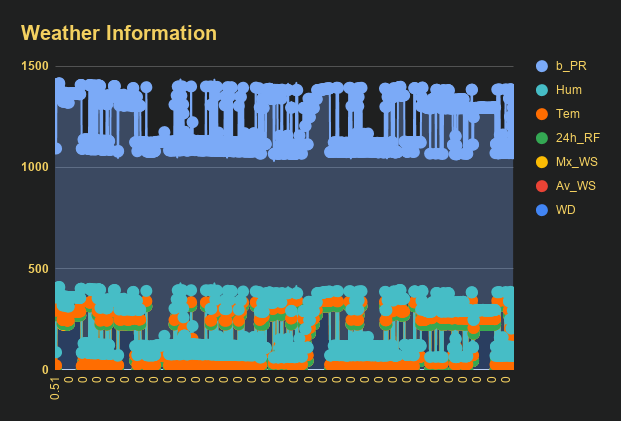
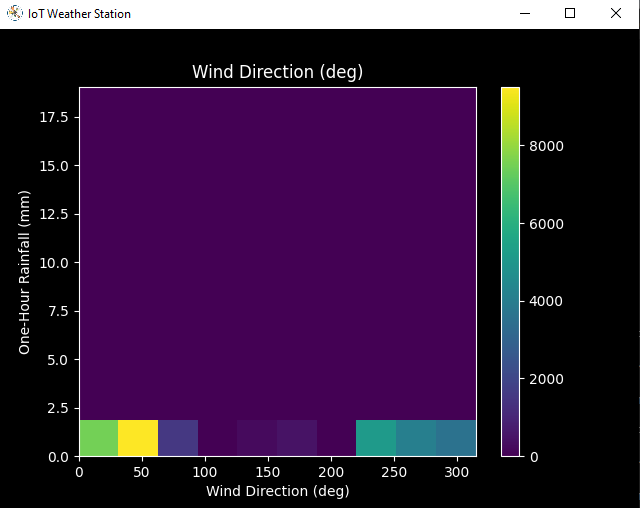
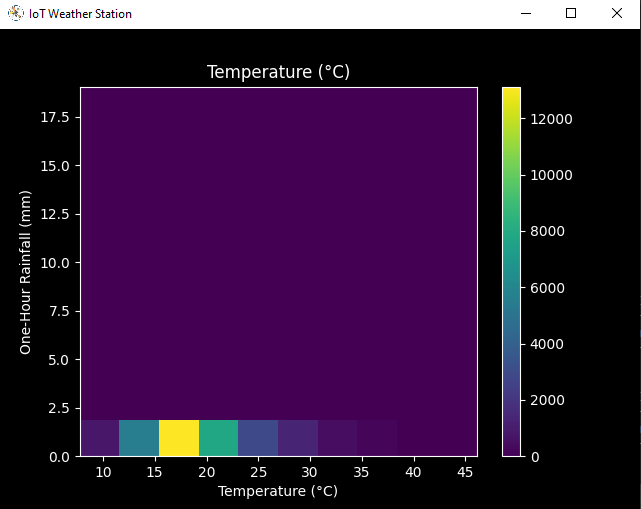
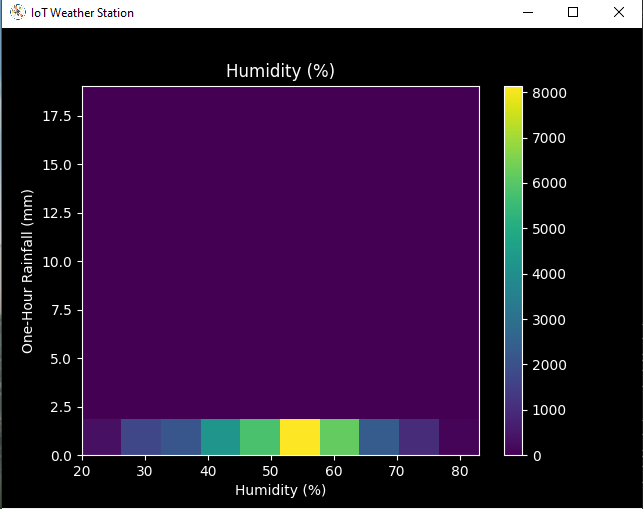
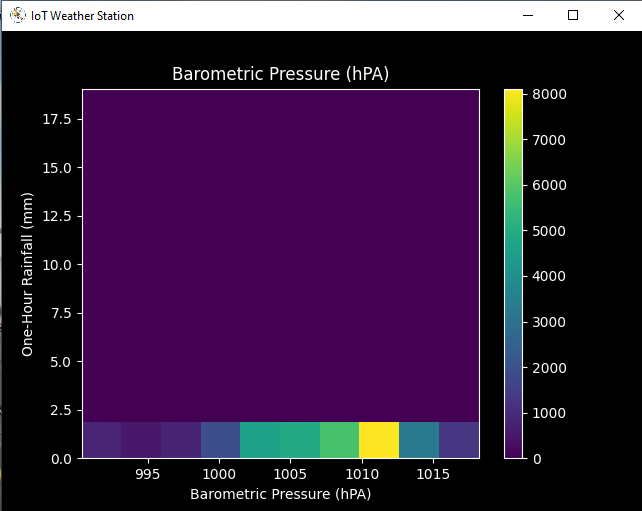
⭐ In the graphics() function, visualize the requested columns from the weather data set by using the Matplotlib library.
def graphics(self, column_1, column_2, xlabel, ylabel):
 # Show requested columns from the data set:
 plt.style.use("dark_background")
 plt.gcf().canvas.set_window_title('IoT Weather Station')
 plt.hist2d(self.df[column_1], self.df[column_2])
 plt.colorbar()
 plt.xlabel(xlabel)
 plt.ylabel(ylabel)
 plt.title(xlabel)
 plt.show()
⭐ In the data_visualization() function, inspect all columns before scaling weather data to build a model with appropriately formatted data.
def data_visualization(self):
 # Inspect requested columns to build a model with appropriately formatted data:
 self.graphics('WD', '1h_RF', 'Wind Direction (deg)', 'One-Hour Rainfall (mm)')
 self.graphics('Av_WS', '1h_RF', 'Average Wind Speed (m/s)', 'One-Hour Rainfall (mm)')
 self.graphics('Mx_WS', '1h_RF', 'Maximum Wind Speed (m/s)', 'One-Hour Rainfall (mm)')
 self.graphics('24h_RF', '1h_RF', '24-Hour Rainfall (mm)', 'One-Hour Rainfall (mm)')
 self.graphics('Tem', '1h_RF', 'Temperature (°C)', 'One-Hour Rainfall (mm)')
 self.graphics('Hum', '1h_RF', 'Humidity (%)', 'One-Hour Rainfall (mm)')
 self.graphics('b_PR', '1h_RF', 'Barometric Pressure (hPA)', 'One-Hour Rainfall (mm)')
After visualizing weather data, I scaled (normalized) each column to format it properly.
Normally, each row (reading) looked like this before scaling:
<울> 315, 0.45, 0, 0.51, 0.51, 22.78, 65, 1005.5
⭐ In the scale_data() function:
⭐ The wind direction in units of degrees and angles do not make good model inputs. 360° and 0° should be close to each other and wrap around smoothly. The direction should not matter if the wind is not blowing. Thus, convert the wind direction and velocity columns to a wind vector to interpret them easily with a neural network model.
def scale_data(self):
 # Wind Direction and Speed:
 wv =self.df.pop('Av_WS')
 max_wv =self.df.pop('Mx_WS')
 # Convert to radians.
 wd_rad =self.df.pop('WD')*np.pi / 180
 # Calculate the wind x and y components.
 self.df['scaled_WX'] =wv*np.cos(wd_rad)
 self.df['scaled_WY'] =wv*np.sin(wd_rad)
 # Calculate the max wind x and y components.
 self.df['scaled_max_WX'] =max_wv*np.cos(wd_rad)
 self.df['scaled_max_WY'] =max_wv*np.sin(wd_rad)

 ...
⭐ For the remaining columns except for 1h_RF , divide them into average reading values to scale (normalize) and format.
...

 # Temperature:
 tem =self.df.pop('Tem')
 self.df['scaled_Tem'] =tem / 25
 # Humidity:
 hum =self.df.pop('Hum')
 self.df['scaled_Hum'] =hum / 70
 # Barometric Pressure:
 bPR =self.df.pop('b_PR')
 self.df["scaled_bPR"] =bPR / 1013
 # 24 Hour Rainfall (Approx.)
 rain_24 =self.df.pop('24h_RF')
 self.df['scaled_24h_RF'] =rain_24 / 24
After completing scaling (normalizing), I extracted these new columns from the weather data set:
<울> scaled_WX
scaled_WY
scaled_max_WX
scaled_max_WY
scaled_Tem
scaled_Hum
scaled_bPR
scaled_24h_RF
Step 5.2:Training the model (ANN) on the rainfall intensity classes
Before building and training a neural network model in TensorFlow, I needed to create the input array and the label array by preprocessing the scaled and normalized weather data set.
⭐ In the create_input_and_label() function:
⭐ Firstly, append each input element as a NumPy array to the input array and convert it to a NumPy array by using the asarray() 기능.
⭐ Each input element includes seven variables [shape=(7, )]:
<울> [scaled_WX, scaled_WY, scaled_max_WX, scaled_max_WY, scaled_Tem, scaled_Hum, scaled_bPR]
def create_input_and_label(self):
 n =len(self.df)
 # Create the input array using the scaled variables:
 for i in range(n):
 self.input.append(np.array([self.df['scaled_WX'][i], self.df['scaled_WY'][i], self.df['scaled_max_WX'][i], self.df['scaled_max_WY'][i], self.df['scaled_Tem'][i], self.df['scaled_Hum'][i], self.df['scaled_bPR'][i]]))
 self.input =np.asarray(self.input)

 ...
⭐ Then, evaluate the approximate rainfall (precipitation) rate for each reading (row).
approx_RF_rate =(1h_RF + scaled_24h_RF) * 100
⭐ According to the rainfall rate, assign a class [0 - 4] for each input element and append them to the label array.
...

 for i in range(n):
 _class =0
 # Evaluate the approximate rainfall rate:
 approx_RF_rate =(self.df['1h_RF'][i] + self.df['scaled_24h_RF'][i]) * 100
 # As labels, assign classes of rainfall intensity according to the approximate rainfall rate (mm):
 if approx_RF_rate ==0:
 _class =0
 elif approx_RF_rate <2.5:
 _class =1
 elif 2.5  _class =2
 elif 7.6  _class =3
 else:
 _class =4
 self.label.append(_class)
 self.label =np.asarray(self.label)
After preprocessing the scaled weather data to create input and label arrays, I split them as training (60%) and test (40%) data sets:
def split_data(self):
 n =len(self.df)
 # (60%, 40%) - (training, test)
 self.train_input =self.input[0:int(n*0.6)]
 self.test_input =self.input[int(n*0.6):]
 self.train_label =self.label[0:int(n*0.6)]
 self.test_label =self.label[int(n*0.6):]
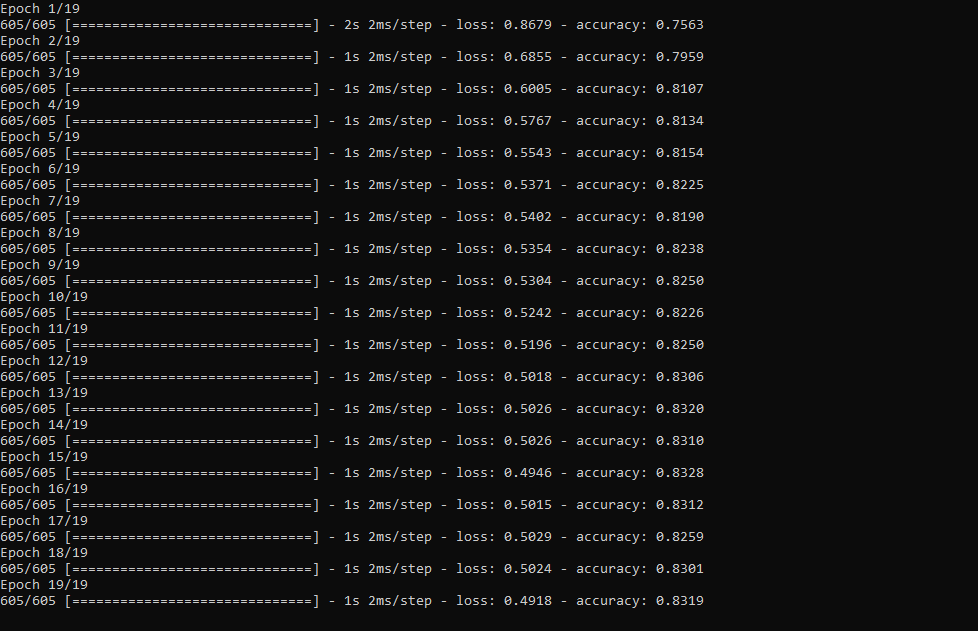
Then, I built my artificial neural network (ANN) model by using Keras and trained it with the training data set for nineteen epochs.
You can inspect these tutorials to learn about activation functions, loss functions, epochs, etc.
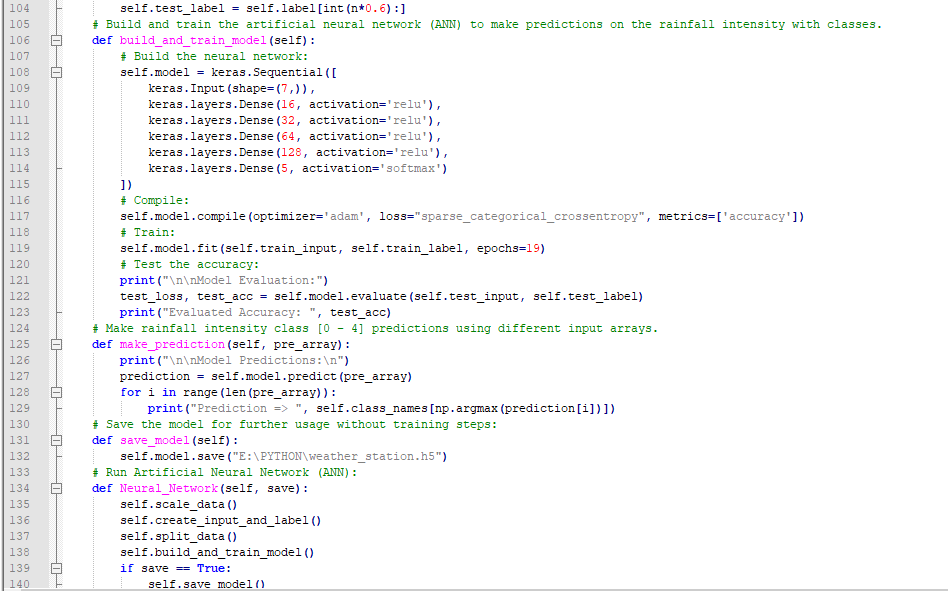
def build_and_train_model(self):
 # Build the neural network:
 self.model =keras.Sequential([
 keras.Input(shape=(7,)),
 keras.layers.Dense(16, activation='relu'),
 keras.layers.Dense(32, activation='relu'),
 keras.layers.Dense(64, activation='relu'),
 keras.layers.Dense(128, activation='relu'),
 keras.layers.Dense(5, activation='softmax')
 ])
 # Compile:
 self.model.compile(optimizer='adam', loss="sparse_categorical_crossentropy", metrics=['accuracy'])
 # Train:
 self.model.fit(self.train_input, self.train_label, epochs=19)

 ...
After training with the preliminary training data set, the accuracy of the model is between 0.83 and 0.85 .
Step 5.3:Evaluating the model and making predictions on the rainfall intensity
After building and training my artificial neural network model, I tested its accuracy by using the preliminary testing data set.
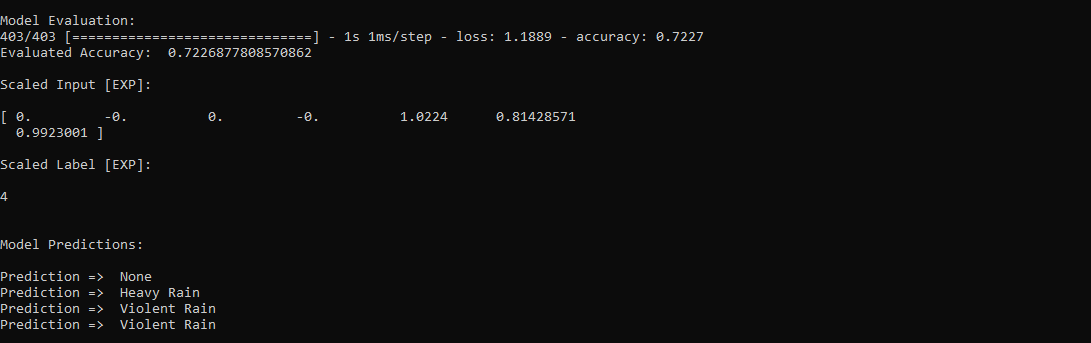
For now, the evaluated accuracy of the model is between 0.72 and 0.73 due to inadequate testing data set overfitting the model. However, I am still collecting weather data to improve the model accuracy.
...

 # Test the accuracy:
 print("\n\nModel Evaluation:")
 test_loss, test_acc =self.model.evaluate(self.test_input, self.test_label)
 print("Evaluated Accuracy:", test_acc)
Then, I used my neural network model to make predictions on the rainfall intensity with a given prediction array consisting of readings from the weather station after the training of the model. As a starting point, the model works fine :)
The model predicts possibilities of labels for each input element as an array of 5 numbers. They represent the model's "confidence" that the given input element corresponds to each of the five different classes of rainfall intensity [0 - 4].
⭐ In the make_prediction() function, make a prediction for each input element in a given array and get the most accurate label [0 - 4] by using the argmax() function to display its class name.
def make_prediction(self, pre_array):
 print("\n\nModel Predictions:\n")
 prediction =self.model.predict(pre_array)
 for i in range(len(pre_array)):
 print("Prediction => ", self.class_names[np.argmax(prediction[i])])
Prediction Inputs:
<울> [0, 0, 0.31819805, 0.31819805, 0.6988, 0.81498571, 0.99349753]
[0, -0, 0, -0, 0.8444, 1, 0.96835143]
[0, 0, 0.45, 0, 0.87577, 0.95857143, 1.00128332]
[-0, -0, -0, -0, 0.8224, 1.05714286, 0.99279368]
Prediction Outputs:
<울> 0 [None]
3 [Heavy Rain]
4 [Violent Rain]
4 [Violent Rain]

Connections and Adjustments (ESP8266) // Connections
// NodeMCU ESP-12E (ESP8266) :
// Weather Station
// VV --------------------------- 5V
// D5 --------------------------- RX
// D6 --------------------------- TX
// G --------------------------- GND
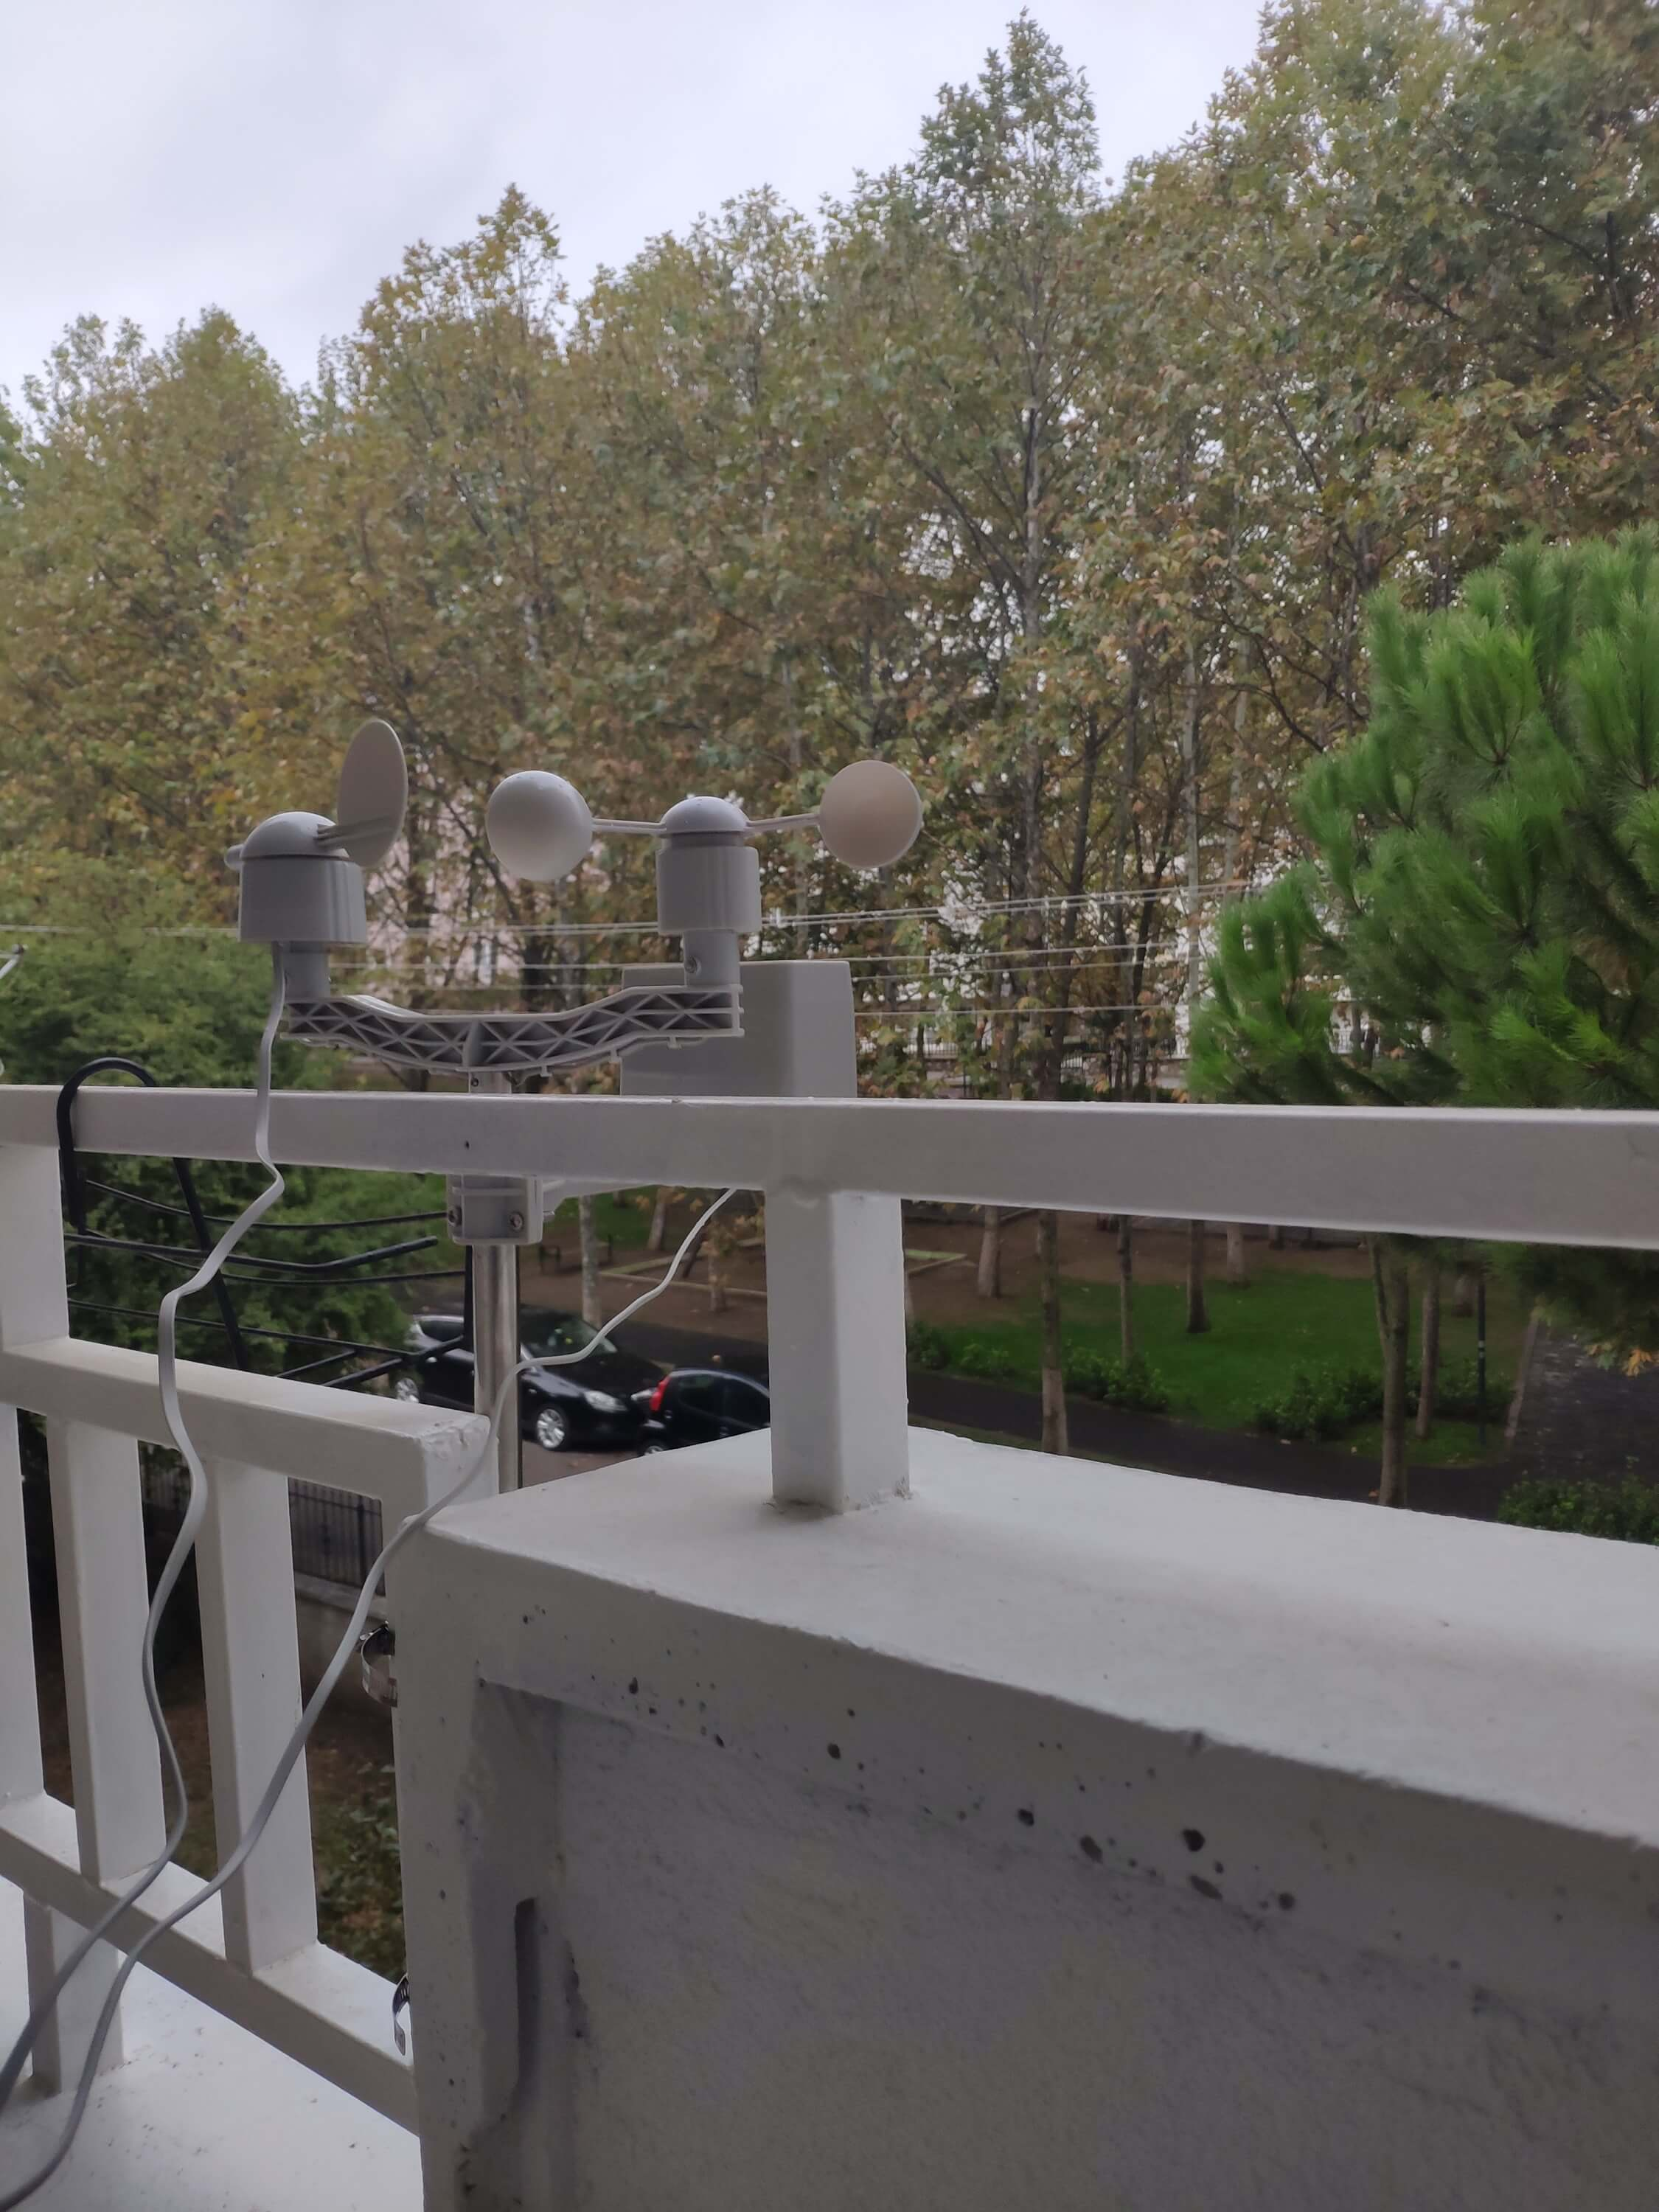
I connected the sensor (converter) board to the NodeMCU ESP-12E (ESP8266) development board and fastened them to a plastic box while collecting weather data at my balcony.
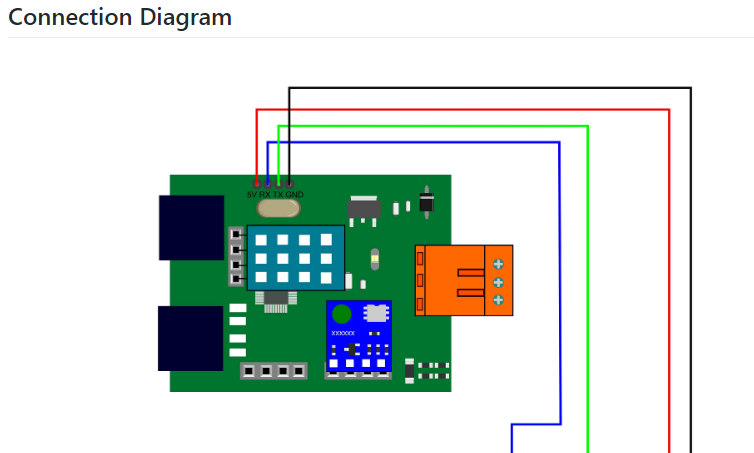
Connections and Adjustments (SIM808) // Connections
// Arduino Uno:
// SIM808 GPS/GPRS/GSM Shield For Arduino
// D0 --------------------------- RX
// D1 --------------------------- TX
// D12 --------------------------- POWER
// Weather Station
// 5V --------------------------- 5V
// D5 --------------------------- RX
// D6 --------------------------- TX
// GND --------------------------- GND
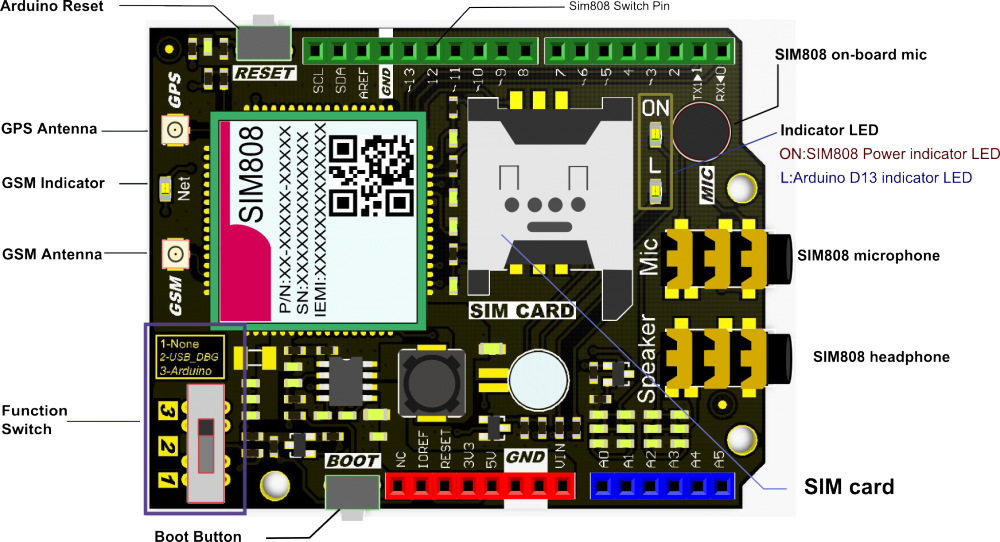
⭐ Note:D0, D1, D12 pins are occupied by the SIM808 GPS/GPRS/GSM Shield.
⭐ Connect an external battery (7-23V) for the SIM808 module to work properly.
⭐ Attach the GPS antenna and the GSM antenna to the SIM808 shield.
⭐ Insert a SIM card into the SIM slot on the SIM808 shield.
⭐ Before uploading the code, set the function switch on the shield to None (1).
⭐ Upload the code.
⭐ Then, set the function switch to Arduino (3).
⭐ Press the Boot button on the shield until seeing the Net indicator LED flashing every 1 second and wait for the SIM card to register the network - the Net indicator LED will slowly flash every 3 seconds.
⭐ Click here to get more information about the SIM808 GSM/GPS/GPRS Shield.
After setting up the SIM808 shield with Arduino Uno, I connected the sensor (converter) board to it.
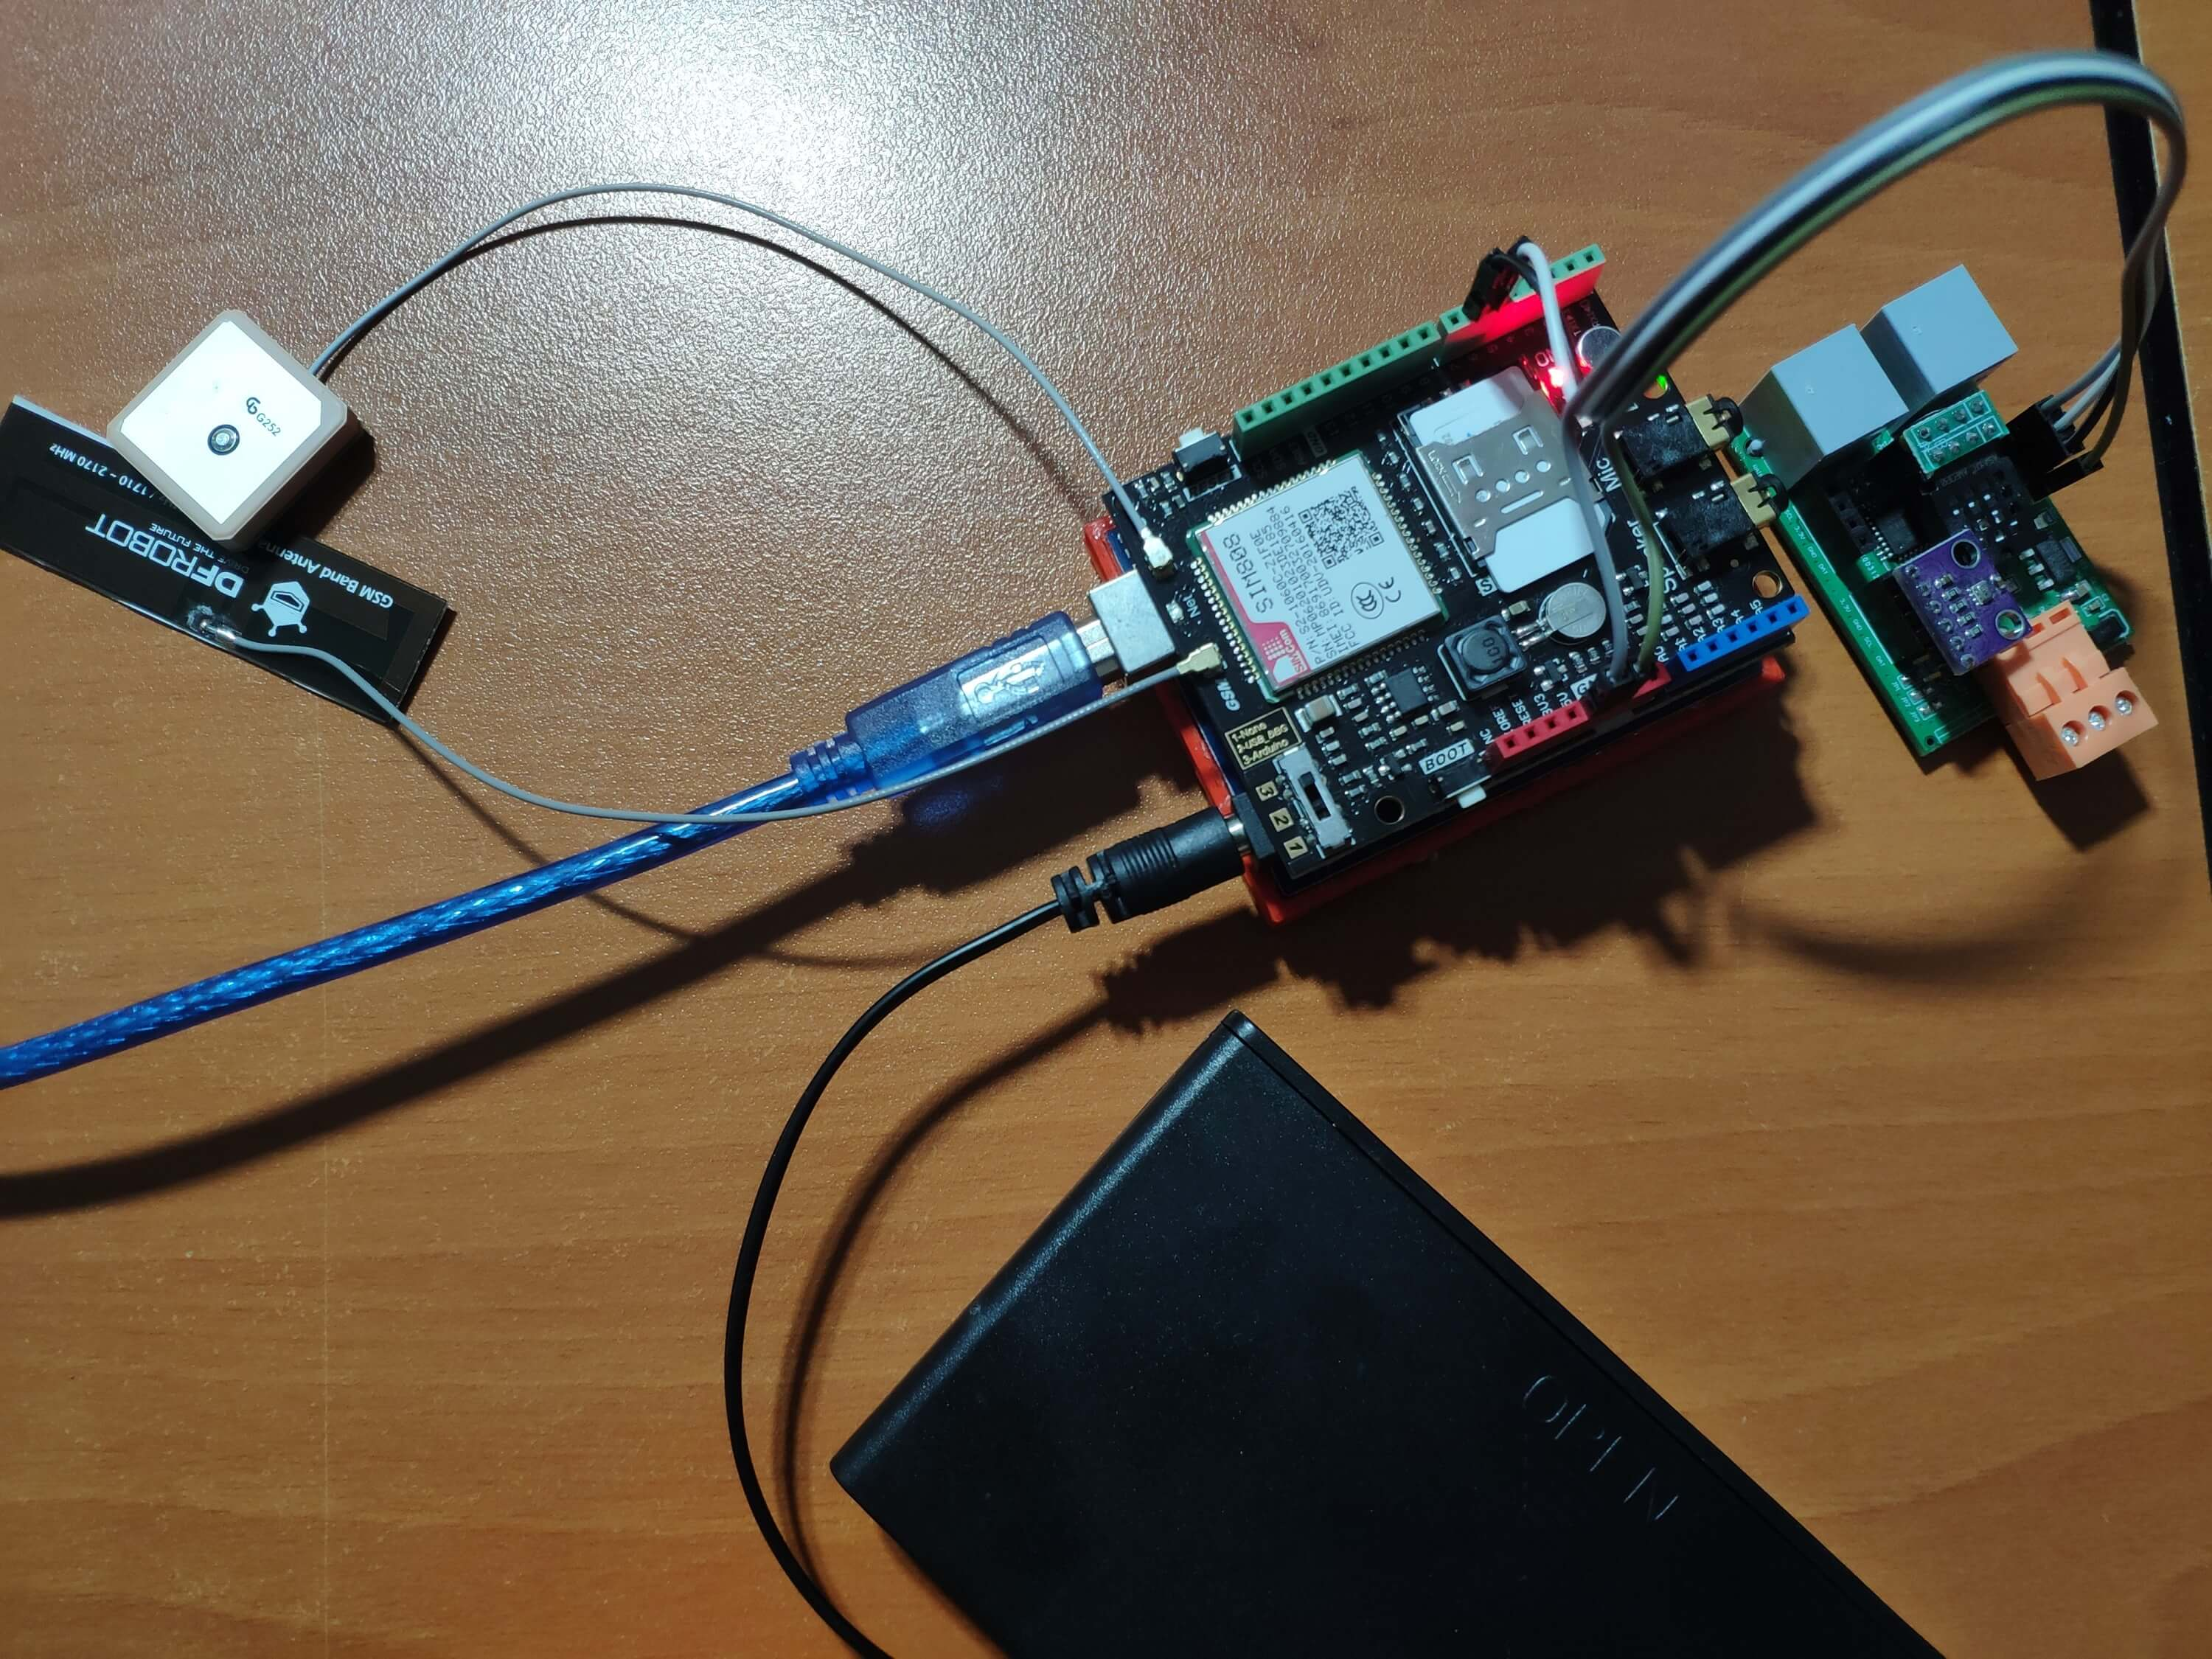
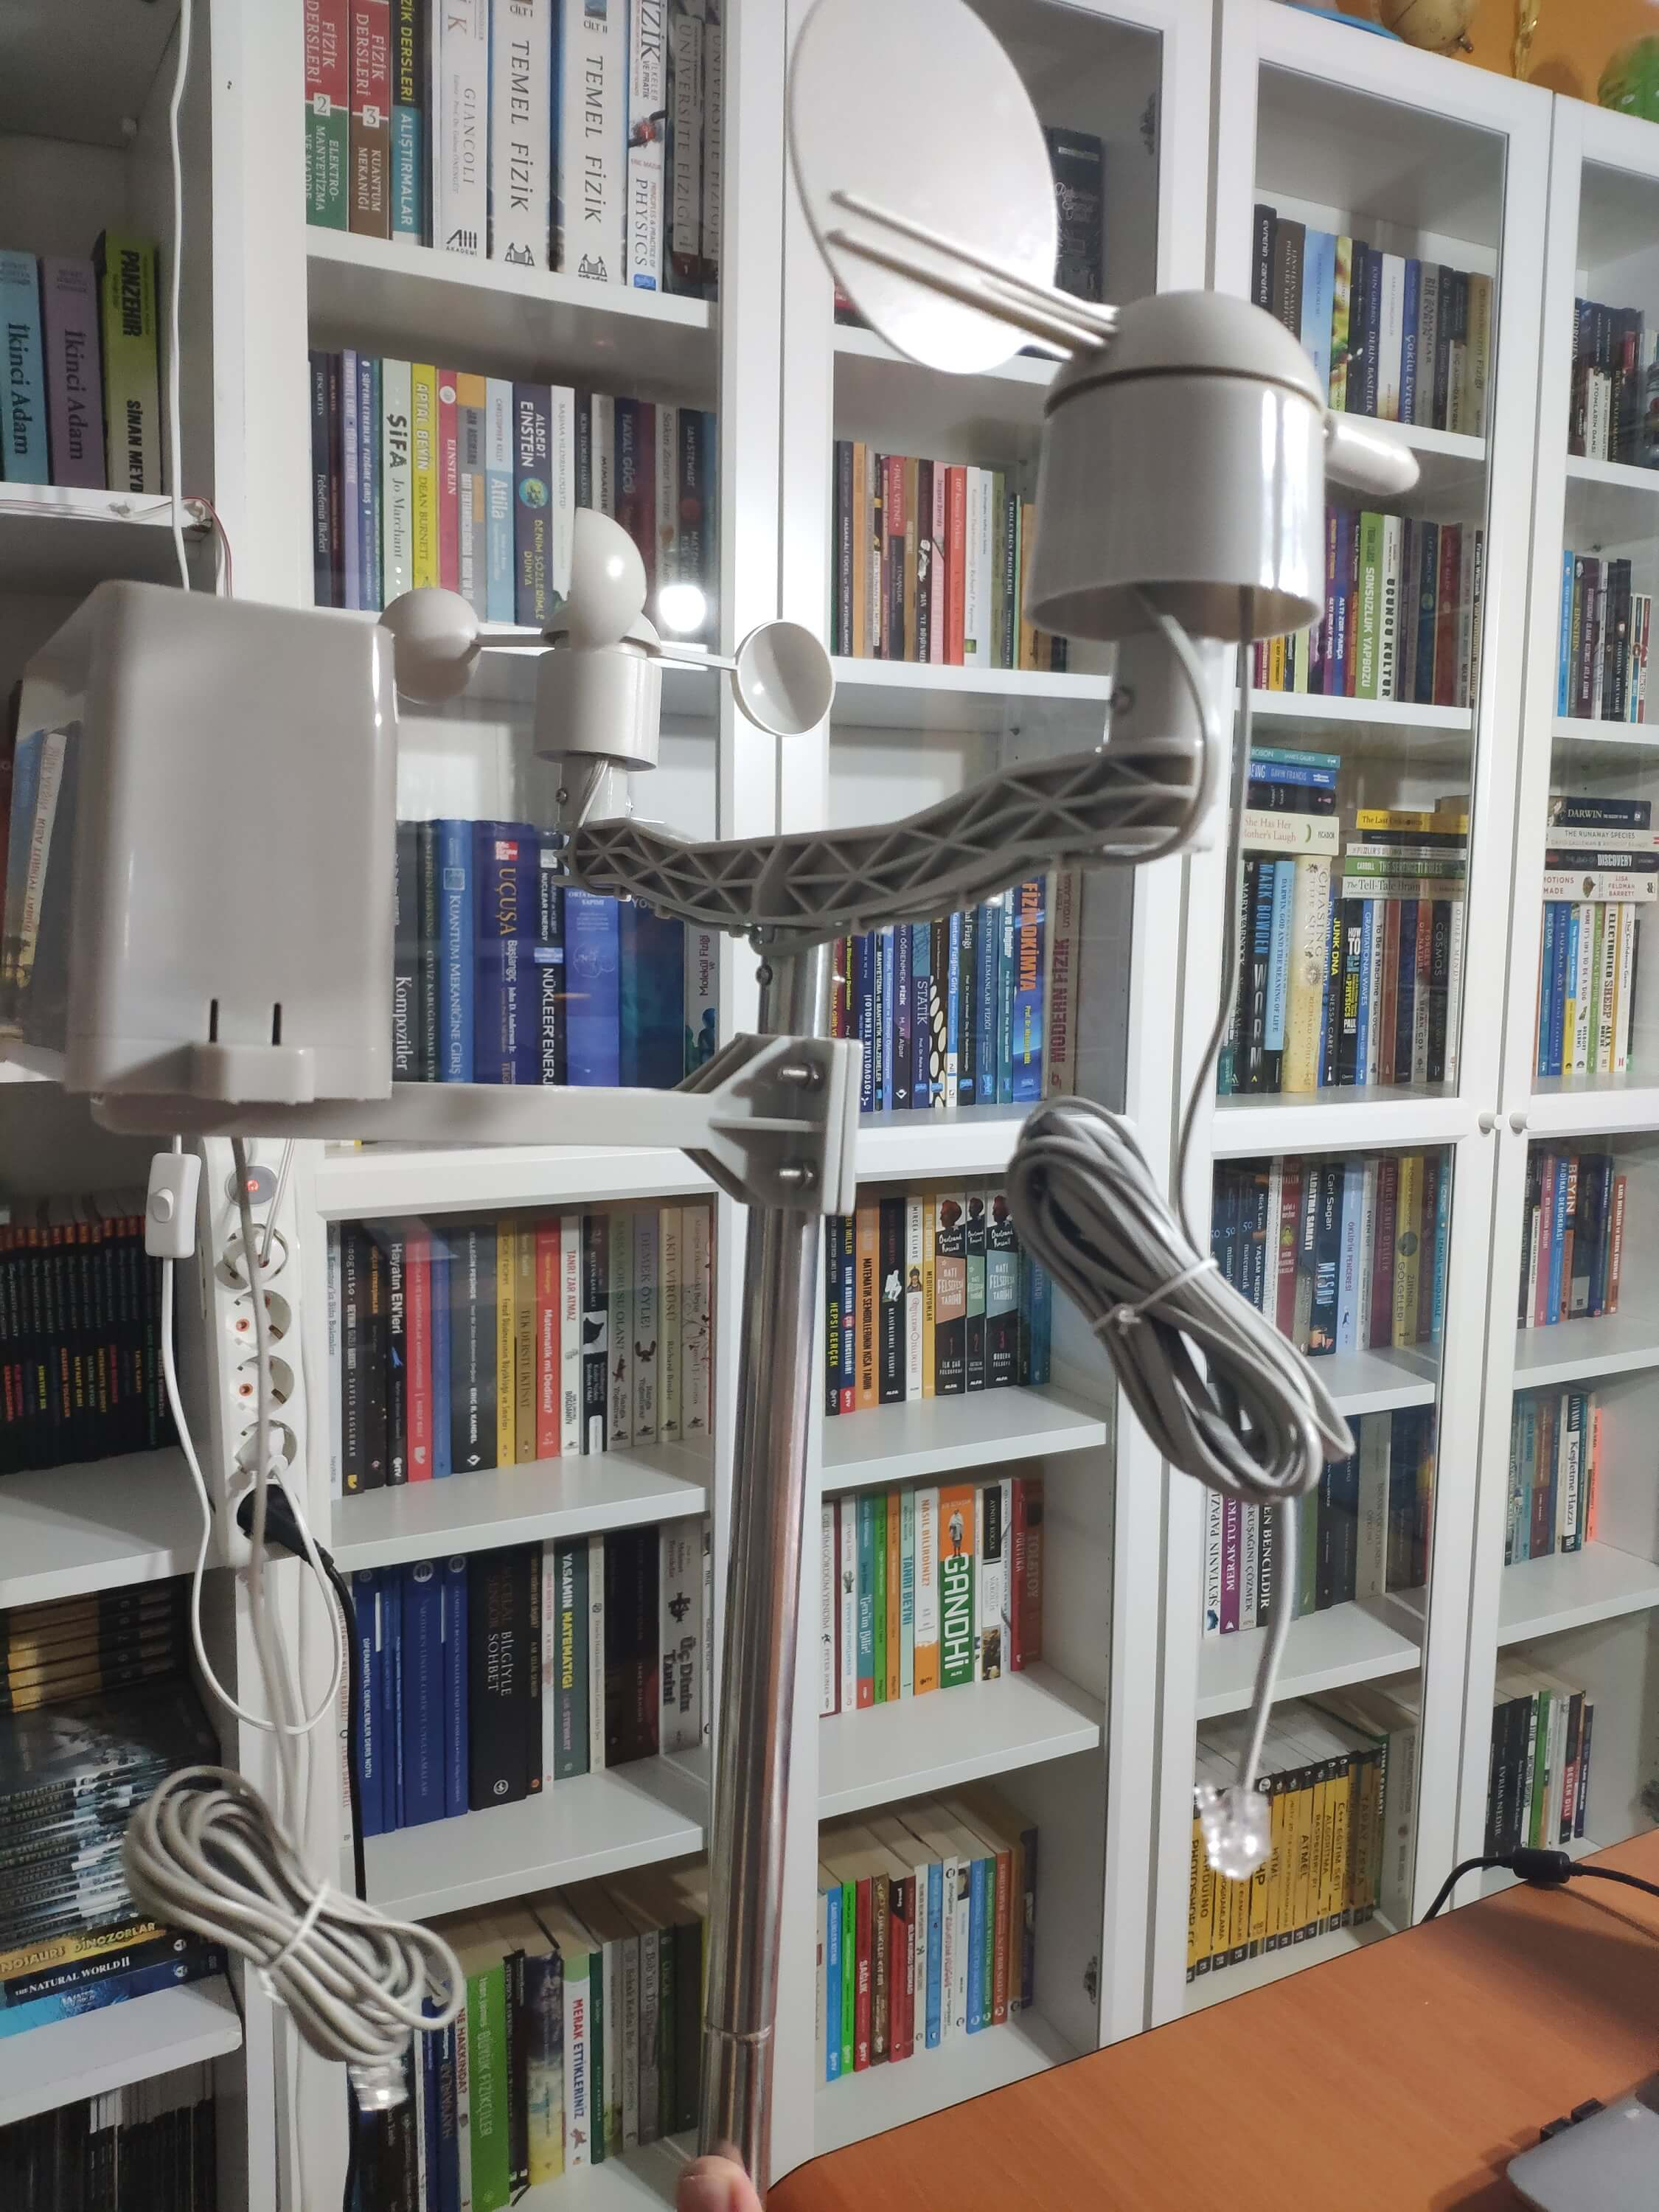
I placed all components into a plastic box to collect weather data outside, even in extreme weather conditions, since the sensor board is not weather-proof.
Then, I fastened the plastic box to the weather station.
Videos and Conclusion
After completing coding and assembling the weather station, I collated local weather data for more than three months every five minutes to build my neural network model successfully.
I am still collecting weather data at my balcony and backyard to improve my neural network model and its accuracy :)
Further Discussions
☔ 💧 Since we need local weather data sets to get more accurate predictions on weather phenomena, budget-friendly NN-enabled weather stations like this can be placed on farms and greenhouses to avert the detrimental effects of excessive rainfall on agriculture.
☔ 💧 As early warning systems working with neural networks, we can use them simultaneously to create a swarm of weather stations communicating and feeding each other to forecast rainfall intensity precisely in local areas.
☔ 💧 Also, we can utilize that information for assessing:
<울> vital water resources,
agriculture,
crop productivity,
ecosystems,
hydrology.
참조
[1] Extreme weather - heavy rainfall , NIWA, https://niwa.co.nz/natural-hazards/extreme-weather-heavy-rainfall
[2] University of Illinois at Urbana-Champaign, News Bureau. "Excessive rainfall as damaging to corn yield as extreme heat, drought. " ScienceDaily. ScienceDaily, 30 April 2019. www.sciencedaily.com/releases/2019/04/190430121744.htm.
[3] Andrew Culclasure, Using Neural Networks to Provide Local Weather Forecasts , Georgia Southern University, Spring 2013, 29https://digitalcommons.georgiasouthern.edu/cgi/viewcontent.cgi?article=1031&context=etd.
<섹션 클래스="섹션 컨테이너 섹션 축소 가능" id="코드"> 코드
<울> IoT_weather_station_neural_network.py
ESP12E_remote_weather_station.ino
SIM808_remote_weather_station.ino
index.php (web application)
account_verification_token.php (web application)
IoT_weather_station_neural_network.pyPython
# IoT Weather Station Predicting Rainfall Intensity w/ TensorFlow# Windows, Linux, or Ubuntu# By Kutluhan Aktar# Collates weather data on Google Sheets and interprets it with a neural network built in TensorFlow to make predictions on the rainfall intensity. # For more information:# https://www.theamplituhedron.com/projects/IoT_Weather_Station_Predicting_Rainfall_Intensity_with_TensorFlowimport tensorflow as tffrom tensorflow import kerasimport matplotlib.pyplot as pltimport numpy as npimport pandas as pd# Create a class to build a neural network after getting, visualizing, and scaling (normalizing) weather data.class Weather_Station:def __init__(self, data):self.df =data self.input =[] self.label =[] # Define class names for different rainfall intensity predictions and values. self.class_names =['None', 'Light Rain', 'Moderate Rain', 'Heavy Rain', 'Violent Rain'] # Create graphics for requested columns. def graphics(self, column_1, column_2, xlabel, ylabel):# Show requested columns from the data set:plt.style.use("dark_background") plt.gcf().canvas.set_window_title('IoT Weather Station') plt.hist2d(self.df[column_1], self.df[column_2]) plt.colorbar() plt.xlabel(xlabel) plt.ylabel(ylabel) plt.title(xlabel) plt.show() # Visualize data before creating and feeding the neural network model. def data_visualization(self):# Inspect requested columns to build a model with appropriately formatted data:self.graphics('WD', '1h_RF', 'Wind Direction (deg)', 'One-Hour Rainfall (mm)') self.graphics('Av_WS', '1h_RF', 'Average Wind Speed (m/s)', 'One-Hour Rainfall (mm)') self.graphics('Mx_WS', '1h_RF', 'Maximum Wind Speed (m/s)', 'One-Hour Rainfall (mm)') self.graphics('24h_RF', '1h_RF', '24-Hour Rainfall (mm)', 'One-Hour Rainfall (mm)') self.graphics('Tem', '1h_RF', 'Temperature (C)', 'One-Hour Rainfall (mm)') self.graphics('Hum', '1h_RF', 'Humidity (%)', 'One-Hour Rainfall (mm)') self.graphics('b_PR', '1h_RF', 'Barometric Pressure (hPA)', 'One-Hour Rainfall (mm)') # Scale (normalize) data depending on the neural network model. def scale_data(self):# Wind Direction and Speed:wv =self.df.pop('Av_WS') max_wv =self.df.pop('Mx_WS') # Convert to radians. wd_rad =self.df.pop('WD')*np.pi / 180 # Calculate the wind x and y components. self.df['scaled_WX'] =wv*np.cos(wd_rad) self.df['scaled_WY'] =wv*np.sin(wd_rad) # Calculate the max wind x and y components. self.df['scaled_max_WX'] =max_wv*np.cos(wd_rad) self.df['scaled_max_WY'] =max_wv*np.sin(wd_rad) # Temperature:tem =self.df.pop('Tem') self.df['scaled_Tem'] =tem / 25 # Humidity:hum =self.df.pop('Hum') self.df['scaled_Hum'] =hum / 70 # Barometric Pressure:bPR =self.df.pop('b_PR') self.df["scaled_bPR"] =bPR / 1013 # 24 Hour Rainfall (Approx.) rain_24 =self.df.pop('24h_RF') self.df['scaled_24h_RF'] =rain_24 / 24 # Define the input and label arrays. def create_input_and_label(self):n =len(self.df) # Create the input array using the scaled variables:for i in range(n):self.input.append(np.array([self.df['scaled_WX'][i], self.df['scaled_WY'][i], self.df['scaled_max_WX'][i], self.df['scaled_max_WY'][i], self.df['scaled_Tem'][i], self.df['scaled_Hum'][i], self.df['scaled_bPR'][i]])) self.input =np.asarray(self.input) # Create the label array using the one-hour and 24-hour rainfall variables:for i in range(n):_class =0 # Evaluate the approximate rainfall rate:approx_RF_rate =(self.df['1h_RF'][i] + self.df['scaled_24h_RF'][i]) * 100 # As labels, assign classes of rainfall intensity according to the approximate rainfall rate (mm):if approx_RF_rate ==0:_class =0 elif approx_RF_rate <2.5:_class =1 elif 2.5 ", self.class_names[np.argmax(prediction[i])]) # Save the model for further usage without training steps:def save_model(self):self.model.save("E:\PYTHON\weather_station.h5") # Run Artificial Neural Network (ANN):def Neural_Network(self, save):self.scale_data() self.create_input_and_label() self.split_data() self.build_and_train_model() if save ==True:self.save_model() # Example Input and Layer:print("\nScaled Input [EXP]:\n") print(self.train_input[0]) print("\nScaled Label [EXP]:\n") print(self.train_label[0]) # Read data (Remote Weather Station.csv):csv_path ="E:\PYTHON\Remote Weather Station.csv"df =pd.read_csv(csv_path)# Define a new class object named 'station':station =Weather_Station(df)# Visualize data:#station.data_visualization()# Artificial Neural Network (ANN):station.Neural_Network(False)# Enter inputs for making predictions:prediction_array =np.array([ [0, 0, 0.31819805, 0.31819805, 0.6988, 0.81498571, 0.99349753], [0, -0, 0, -0, 0.8444, 1, 0.96835143], [0, 0, 0.45, 0, 0.87577, 0.95857143, 1.00128332], [-0, -0, -0, -0, 0.8224, 1.05714286, 0.99279368]])# Prediction Results:station.make_prediction(prediction_array) ESP12E_remote_weather_station.inoArduino
///////////////////////////////////////////// // IoT Weather Station Predicting // // Rainfall Intensity w/ TensorFlow // // ------------------------ // // NodeMCU (ESP-12E) // // by Kutluhan Aktar // // // ///////////////////////////////////////////////// Collates weather data on Google Sheets and interprets it with a neural network built in TensorFlow to make predictions on the rainfall intensity. //// For more information:// https://www.theamplituhedron.com/projects/IoT_Weather_Station_Predicting_Rainfall_Intensity_with_TensorFlow//// Connections// NodeMCU (ESP-12E) :// Weather Station// VV --------------------------- 5V// D5 --------------------------- RX// D6 --------------------------- TX// G --------------------------- GND// Include required libraries:#include #include #include #include #include // Define your WiFi settings.const char *ssid ="";const char *password ="";// Define weather station settings:char databuffer[35];double temp;int transferring =0;// Define the serial connection pins - RX and TX.SoftwareSerial Serial_1(D6, D5); // (Rx, Tx)void setup() { // Wait until connected. 지연(1000); // Initiate serial ports:Serial.begin(115200); Serial_1.begin(9600); // It is just for assuring if connection is alive. WiFi.mode(WIFI_OFF); 지연(1000); // This mode allows NodeMCU to connect any WiFi directly. WiFi.mode(WIFI_STA); // Connect NodeMCU to your WiFi. WiFi.begin(ssid, password); Serial.print("\n\n"); Serial.print("Try to connect to WiFi. Please wait! "); Serial.print("\n\n"); // Halt the code until connected to WiFi. while (WiFi.status() !=WL_CONNECTED) { delay(500); Serial.print("*"); } // If connection is successful:Serial.print("\n\n"); Serial.print("-------------------------------------"); Serial.print("\n\n"); Serial.print("Connection is successful!"); Serial.print("\n\n"); Serial.print("Connected WiFi SSID :"); Serial.print(ssid); Serial.print("\n\n"); Serial.println("Connected IPAddress :"); Serial.println(WiFi.localIP()); Serial.print("\n\n");}void loop() { // Get data from the remote weather station:getBuffer(); // Debug the information and create the link:String weather_data ="wd=" + String(WindDirection()) + "&a_ws=" + String(WindSpeedAverage()) + "&m_ws=" + String(WindSpeedMax()) + "&1_rf=" + String(RainfallOneHour()) + "&24_rf=" + String(RainfallOneDay()) + "&tem=" + String(Temperature()) + "&hum=" + String(Humidity()) + "&b_pr=" + String(BarPressure()); String server ="http://192.168.1.24/remote_weather_station/?"; Serial.println("Weather Data => " + weather_data); Serial.println("Buffer => " + String(databuffer)); // Send data packets every 5 minutes to Raspberry Pi (or any server). transferring++; Serial.println("Time => " + String(transferring) + "s / " + String(int(5*60)) + "s\n\n"); if(transferring ==5*60){ // Create the HTTP object to make a request to the server. HTTPClient http; http.begin(server + weather_data); int httpCode =http.GET(); String payload =http.getString(); Serial.println("Data Send...\nHTTP Code => " + String(httpCode) + "\nServer Response => " + payload + "\n\n"); http.end(); transferring =0; } // Wait 1 second... delay(1000);}// WEATHER STATIONvoid getBuffer(){ int index; for (index =0;index <35;index ++){ if(Serial_1.available()){ databuffer[index] =Serial_1.read(); if (databuffer[0] !='c'){ index =-1; } } else{ index --; } }}int transCharToInt(char *_buffer, int _start, int _stop){ int _index; int result =0; int num =_stop - _start + 1; int _temp[num]; for (_index =_start;_index <=_stop;_index ++){ _temp[_index - _start] =_buffer[_index] - '0'; result =10*result + _temp[_index - _start]; } return result;}int WindDirection(){ return transCharToInt(databuffer,1,3); } // Wind Direction (deg)float WindSpeedAverage(){ temp =0.44704 * transCharToInt(databuffer,5,7); return temp; } // Average Air Speed (1 minute)float WindSpeedMax(){ temp =0.44704 * transCharToInt(databuffer,9,11); return temp; } //Max Air Speed (5 minutes)float Temperature(){ temp =(transCharToInt(databuffer,13,15) - 32.00) * 5.00 / 9.00; return temp; } // Temperature ("C")float RainfallOneHour(){ temp =transCharToInt(databuffer,17,19) * 25.40 * 0.01; return temp; } // Rainfall (1 hour)float RainfallOneDay(){ temp =transCharToInt(databuffer,21,23) * 25.40 * 0.01; return temp; } // Rainfall (24 hours)int Humidity(){ return transCharToInt(databuffer,25,26); } // Humidity (%)float BarPressure(){ temp =transCharToInt(databuffer,28,32); return temp / 10.00; } // Barometric Pressure (hPA)
SIM808_remote_weather_station.inoArduino
///////////////////////////////////////////// // IoT Weather Station Predicting // // Rainfall Intensity w/ TensorFlow // // ------------------------ // // Arduino Uno (SIM808) // // by Kutluhan Aktar // // // ///////////////////////////////////////////////// Collates weather data on Google Sheets and interprets it with a neural network built in TensorFlow to make predictions on the rainfall intensity. //// For more information:// https://www.theamplituhedron.com/projects/IoT_Weather_Station_Predicting_Rainfall_Intensity_with_TensorFlow//// Connections// Arduino Uno:// SIM808 GPS/GPRS/GSM Shield For Arduino// D0 --------------------------- RX// D1 --------------------------- TX// D12 --------------------------- POWER // Weather Station// 5V --------------------------- 5V// D5 --------------------------- RX// D6 --------------------------- TX// GND --------------------------- GND// Include required libraries:#include #include // Define the sim808.DFRobot_SIM808 sim808(&Serial);// Define weather station settings:char databuffer[35];double temp;int transferring =0;// Define the serial connection pins - RX and TX.SoftwareSerial Serial_1(6, 5); // (Rx, Tx)void setup() { // Wait until connected. 지연(1000); // Initiate serial ports:Serial.begin(9600); Serial_1.begin(9600); //******** Initialize sim808 module ************* while(!sim808.init()) { delay(1000); Serial.print("Sim808 init error\r\n"); } delay(2000); // Continue if the SIM808 Module is working accurately. Serial.println("Sim808 init success"); delay(5000);}void loop() { // Get data from the remote weather station:getBuffer(); // Debug the information and create the link:String weather_data_1 ="wd=" + String(WindDirection()) + "&a_ws=" + String(WindSpeedAverage()) + "&m_ws=" + String(WindSpeedMax()); String weather_data_2 ="&1_rf=" + String(RainfallOneHour()) + "&24_rf=" + String(RainfallOneDay()) + "&tem=" + String(Temperature()); String weather_data_3 ="&hum=" + String(Humidity()) + "&b_pr=" + String(BarPressure()); Serial.print("Weather Data => " + weather_data_1); Serial.print(weather_data_2); Serial.println(weather_data_3); Serial.println("Buffer => " + String(databuffer)); // Send data packets every 5 minutes to the server. transferring++; Serial.println("Time => " + String(transferring) + "s / " + String(int(5*60)) + "s\n\n"); if(transferring ==5*60){ //*********** Attempt DHCP ******************* while(!sim808.join(F("cmnet"))) { Serial.println("Sim808 join network error!"); 지연(2000); } //************ Successful DHCP **************** delay(5000); Serial.println("Successful DHCP"); //*********** Establish a TCP connection ************ if(!sim808.connect(TCP,"192.168.1.24", 80)) { // Change it with your server. Serial.println("Connection Error"); }else{ Serial.println("Connection OK"); } delay(2000); //*********** Send a GET request ***************** String line ="GET /remote_weather_station/?" + weather_data_1 + weather_data_2 + weather_data_3 + " HTTP/1.0\r\n\r\n"; Serial.println(줄); char buffer[512]; // Convert the line from string to char array to make an HTTP Get Request with the SIM808. char web_hook[110]; String_to_Char(line, 110, web_hook); sim808.send(web_hook, sizeof(web_hook)-1); while (true) { int ret =sim808.recv(buffer, sizeof(buffer)-1); if (ret <=0){ Serial.println("Fetch Over..."); 부서지다; } // Uncomment to view the response in the serial monitor. /* buffer[ret] ='\0'; Serial.print("Recv:"); Serial.print(ret); Serial.print(" bytes:"); Serial.println(buffer); */ Serial.println("\nData Send"); 부서지다; } //************* Close TCP or UDP connections ********** sim808.close(); //*** Disconnect wireless connection, Close Moving Scene ******* sim808.disconnect(); // Exit. transferring =0; } // Wait 1 second... delay(1000);}// WEATHER STATIONvoid getBuffer(){ int index; for (index =0;index <35;index ++){ if(Serial_1.available()){ databuffer[index] =Serial_1.read(); if (databuffer[0] !='c'){ index =-1; } } else{ index --; } }}int transCharToInt(char *_buffer, int _start, int _stop){ int _index; int result =0; int num =_stop - _start + 1; int _temp[num]; for (_index =_start;_index <=_stop;_index ++){ _temp[_index - _start] =_buffer[_index] - '0'; result =10*result + _temp[_index - _start]; } return result;}int WindDirection(){ return transCharToInt(databuffer,1,3); } // Wind Direction (deg)float WindSpeedAverage(){ temp =0.44704 * transCharToInt(databuffer,5,7); return temp; } // Average Air Speed (1 minute)float WindSpeedMax(){ temp =0.44704 * transCharToInt(databuffer,9,11); return temp; } //Max Air Speed (5 minutes)float Temperature(){ temp =(transCharToInt(databuffer,13,15) - 32.00) * 5.00 / 9.00; return temp; } // Temperature ("C")float RainfallOneHour(){ temp =transCharToInt(databuffer,17,19) * 25.40 * 0.01; return temp; } // Rainfall (1 hour)float RainfallOneDay(){ temp =transCharToInt(databuffer,21,23) * 25.40 * 0.01; return temp; } // Rainfall (24 hours)int Humidity(){ return transCharToInt(databuffer,25,26); } // Humidity (%)float BarPressure(){ temp =transCharToInt(databuffer,28,32); return temp / 10.00; } // Barometric Pressure (hPA)void String_to_Char(String _String, int _size, char _convert[]){ for(int i=0;i<_size;i++){ _convert[i] =_String[i]; }}
index.php (web application)PHP
 (int)$_GET['wd'], "a_ws" => (float)$_GET['a_ws'], "m_ws" => (float)$_GET['m_ws'], "1_rf" => (float)$_GET['1_rf'], "24_rf" => (float)$_GET['24_rf'], "tem" => (float)$_GET['tem'], "hum" => (int)$_GET['hum'], "b_pr" => (float)$_GET['b_pr'] ];}else{ $variables_from_module =[ "wd" => "err", "a_ws" => "err", "m_ws" => "err", "1_rf" => "err", "24_rf" => "err", "tem" => "err", "hum" => "err", "b_pr" => "err" ];}/** * Returns an authorized API client. * @return Google_Client the authorized client object */function getClient(){ $client =new Google_Client(); $client->setApplicationName('Remote Weather Station'); // Enter your application name. $client->setScopes('https://www.googleapis.com/auth/spreadsheets'); $client->setAuthConfig('credentials.json'); $client->setAccessType('offline'); $client->setPrompt('select_account consent'); // Load previously authorized token from a file, if it exists. // The file token.json stores the user's access and refresh tokens, and is // created automatically when the authorization flow completes for the first // time. $tokenPath ='token.json'; if (file_exists($tokenPath)) { $accessToken =json_decode(file_get_contents($tokenPath), true); $client->setAccessToken($accessToken); print("Token Found!"); } // If there is no previous token or it's expired. if ($client->isAccessTokenExpired()) { // Refresh the token if possible, else fetch a new one. if ($client->getRefreshToken()) { $client->fetchAccessTokenWithRefreshToken($client->getRefreshToken()); } else { // Request authorization from the user. $authUrl =$client->createAuthUrl(); // Do not forget to refresh the page after getting the verification code and entering it to the account_verification_token.php. printf("Open the following link in your browser:

%s

", $authUrl); // <=Comment print 'Do not forget to refresh the page after getting the verification code and entering it to the account_verification_token.php.

Set the verification code in the account_verification_token.php file.'; // <=Comment // Set the verification code to create the token.json. $authCode =trim($GLOBALS['account_verification_token']); // Exchange authorization code for an access token. $accessToken =$client->fetchAccessTokenWithAuthCode($authCode); $client->setAccessToken($accessToken); // Check to see if there was an error and the account_verification_token is entered. if (array_key_exists('error', $accessToken)) { throw new Exception(join(', ', $accessToken)); }else{ print("Successful! Refresh the page."); } } // Save the token to a file. if (!file_exists(dirname($tokenPath))) { mkdir(dirname($tokenPath), 0700, true); } file_put_contents($tokenPath, json_encode($client->getAccessToken())); } return $client;}// Get the API client and construct the service object.$client =getClient();$service =new Google_Service_Sheets($client);// Enter your spreadsheetId:$spreadsheetId ='';// Enter the range (the first row) under which new values will be appended (8 rows):$range ='A1:H1';// Append recent findings from the weather station to the spreadsheet.$values =[ [$variables_from_module["wd"], $variables_from_module["a_ws"], $variables_from_module["m_ws"], $variables_from_module["1_rf"], $variables_from_module["24_rf"], $variables_from_module["tem"], $variables_from_module["hum"], $variables_from_module["b_pr"]]];$body =new Google_Service_Sheets_ValueRange([ 'values' => $values]);$params =[ 'valueInputOption' => "RAW"];// Append if only requested!if(isset($_GET['wd']) &&isset($_GET['a_ws']) &&isset($_GET['m_ws']) &&isset($_GET['1_rf']) &&isset($_GET['24_rf']) &&isset($_GET['tem']) &&isset($_GET['hum']) &&isset($_GET['b_pr'])){ $result =$service->spreadsheets_values->append($spreadsheetId, $range, $body, $params); printf("

%d cells appended.", $result->getUpdates()->getUpdatedCells());}else{ print ("
Missing Data!");}
account_verification_token.php (web application)PHP
"; // Enter the verification code after authorization. ?>
맞춤형 부품 및 인클로저
remote_weather_station_OobOCQNPSW.csv 회로도