이 프로젝트 정보
먼저 이 프로젝트의 동기, 관련 기술 및 구축할 최종 제품에 대한 몇 마디입니다.
따라서 여기서 큰 목표는 분명히 미래의 비를 예측하는 것입니다(6시간 동안 시도할 것입니다). 예측은 예 또는 아니오(프로그래밍 용어의 부울)입니다. 이 문제에 대한 자습서에서 검색했지만 모든 면에서 완전한 것을 찾지 못했습니다. 그래서 내 것은 이것을 완전히 새로운 접근 방식으로 받아들이고 그것의 모든 측면을 다룰 것입니다. 이를 위해 우리는:
 <울> 구축 기상 관측소 우리 자신. 스테이션은 태양열 패널과 극도로 낮은 전력 모드(수십 마이크로암페어 시간)로 그리드에서 완전히 떨어져 있어야 합니다.
<울> 프로그램 스테이션에서 데이터를 수집하여 10분마다 기지국으로 전송합니다.
<울> 수집 베이스 스테이션에 데이터를 저장하고 (데이터베이스에) 저장
<울> 신경망 사용 (Keras 라이브러리) 및 pandas와 같은 기타 Python 라이브러리는 데이터를 필터링하고 정리 및 사전 처리한 다음 신경망에 공급하여 비가 올지 여부를 예측하는 "모델"을 훈련시킵니다.
<울> 마침내 예측 앞으로 6시간 동안 비가 올 것인지 이메일을 통해 사용자에게 알릴 것인지 여부
<울> 구축 기상 관측소 우리 자신. 스테이션은 태양열 패널과 극도로 낮은 전력 모드(수십 마이크로암페어 시간)로 그리드에서 완전히 떨어져 있어야 합니다.
<울> 프로그램 스테이션에서 데이터를 수집하여 10분마다 기지국으로 전송합니다.
<울> 수집 베이스 스테이션에 데이터를 저장하고 (데이터베이스에) 저장
<울> 신경망 사용 (Keras 라이브러리) 및 pandas와 같은 기타 Python 라이브러리는 데이터를 필터링하고 정리 및 사전 처리한 다음 신경망에 공급하여 비가 올지 여부를 예측하는 "모델"을 훈련시킵니다.
<울> 마침내 예측 앞으로 6시간 동안 비가 올 것인지 이메일을 통해 사용자에게 알릴 것인지 여부
저는 개인적으로 이 기상 관측소를 사용하여 데이터를 수집했습니다(원하는 경우 다음 단계에서 데이터를 다운로드할 수 있음). 약 600일 간의 날씨 데이터만 있으면 시스템은 매개변수에 따라 약 80%의 정확도로 향후 6시간 동안 비가 올지 여부를 예측할 수 있지만 그렇게 나쁘지는 않습니다.
이 튜토리얼에서는 처음부터 강우량을 예측하는 데 필요한 모든 단계를 안내합니다. 외부 날씨나 기계 학습 API를 사용하지 않고 실용적인 작업을 수행하는 최종 제품을 만들 것입니다. 우리는 유지 관리 없이 장기간에 걸쳐 데이터를 실제로 수집하는 실용적인 기상 관측소(저전력 및 오프 그리드)를 구축하는 방법을 배우게 될 것입니다. 그런 다음 Arduino IDE를 사용하여 프로그래밍하는 방법을 배웁니다. 베이스 스테이션(서버)의 데이터베이스에 데이터를 수집하는 방법. 그리고 어떻게 데이터를 처리(Pandas)하고 신경망(Keras)을 적용한 다음 강우량을 예측하는지.
1단계:스테이션 건설을 위한 부품 및 도구
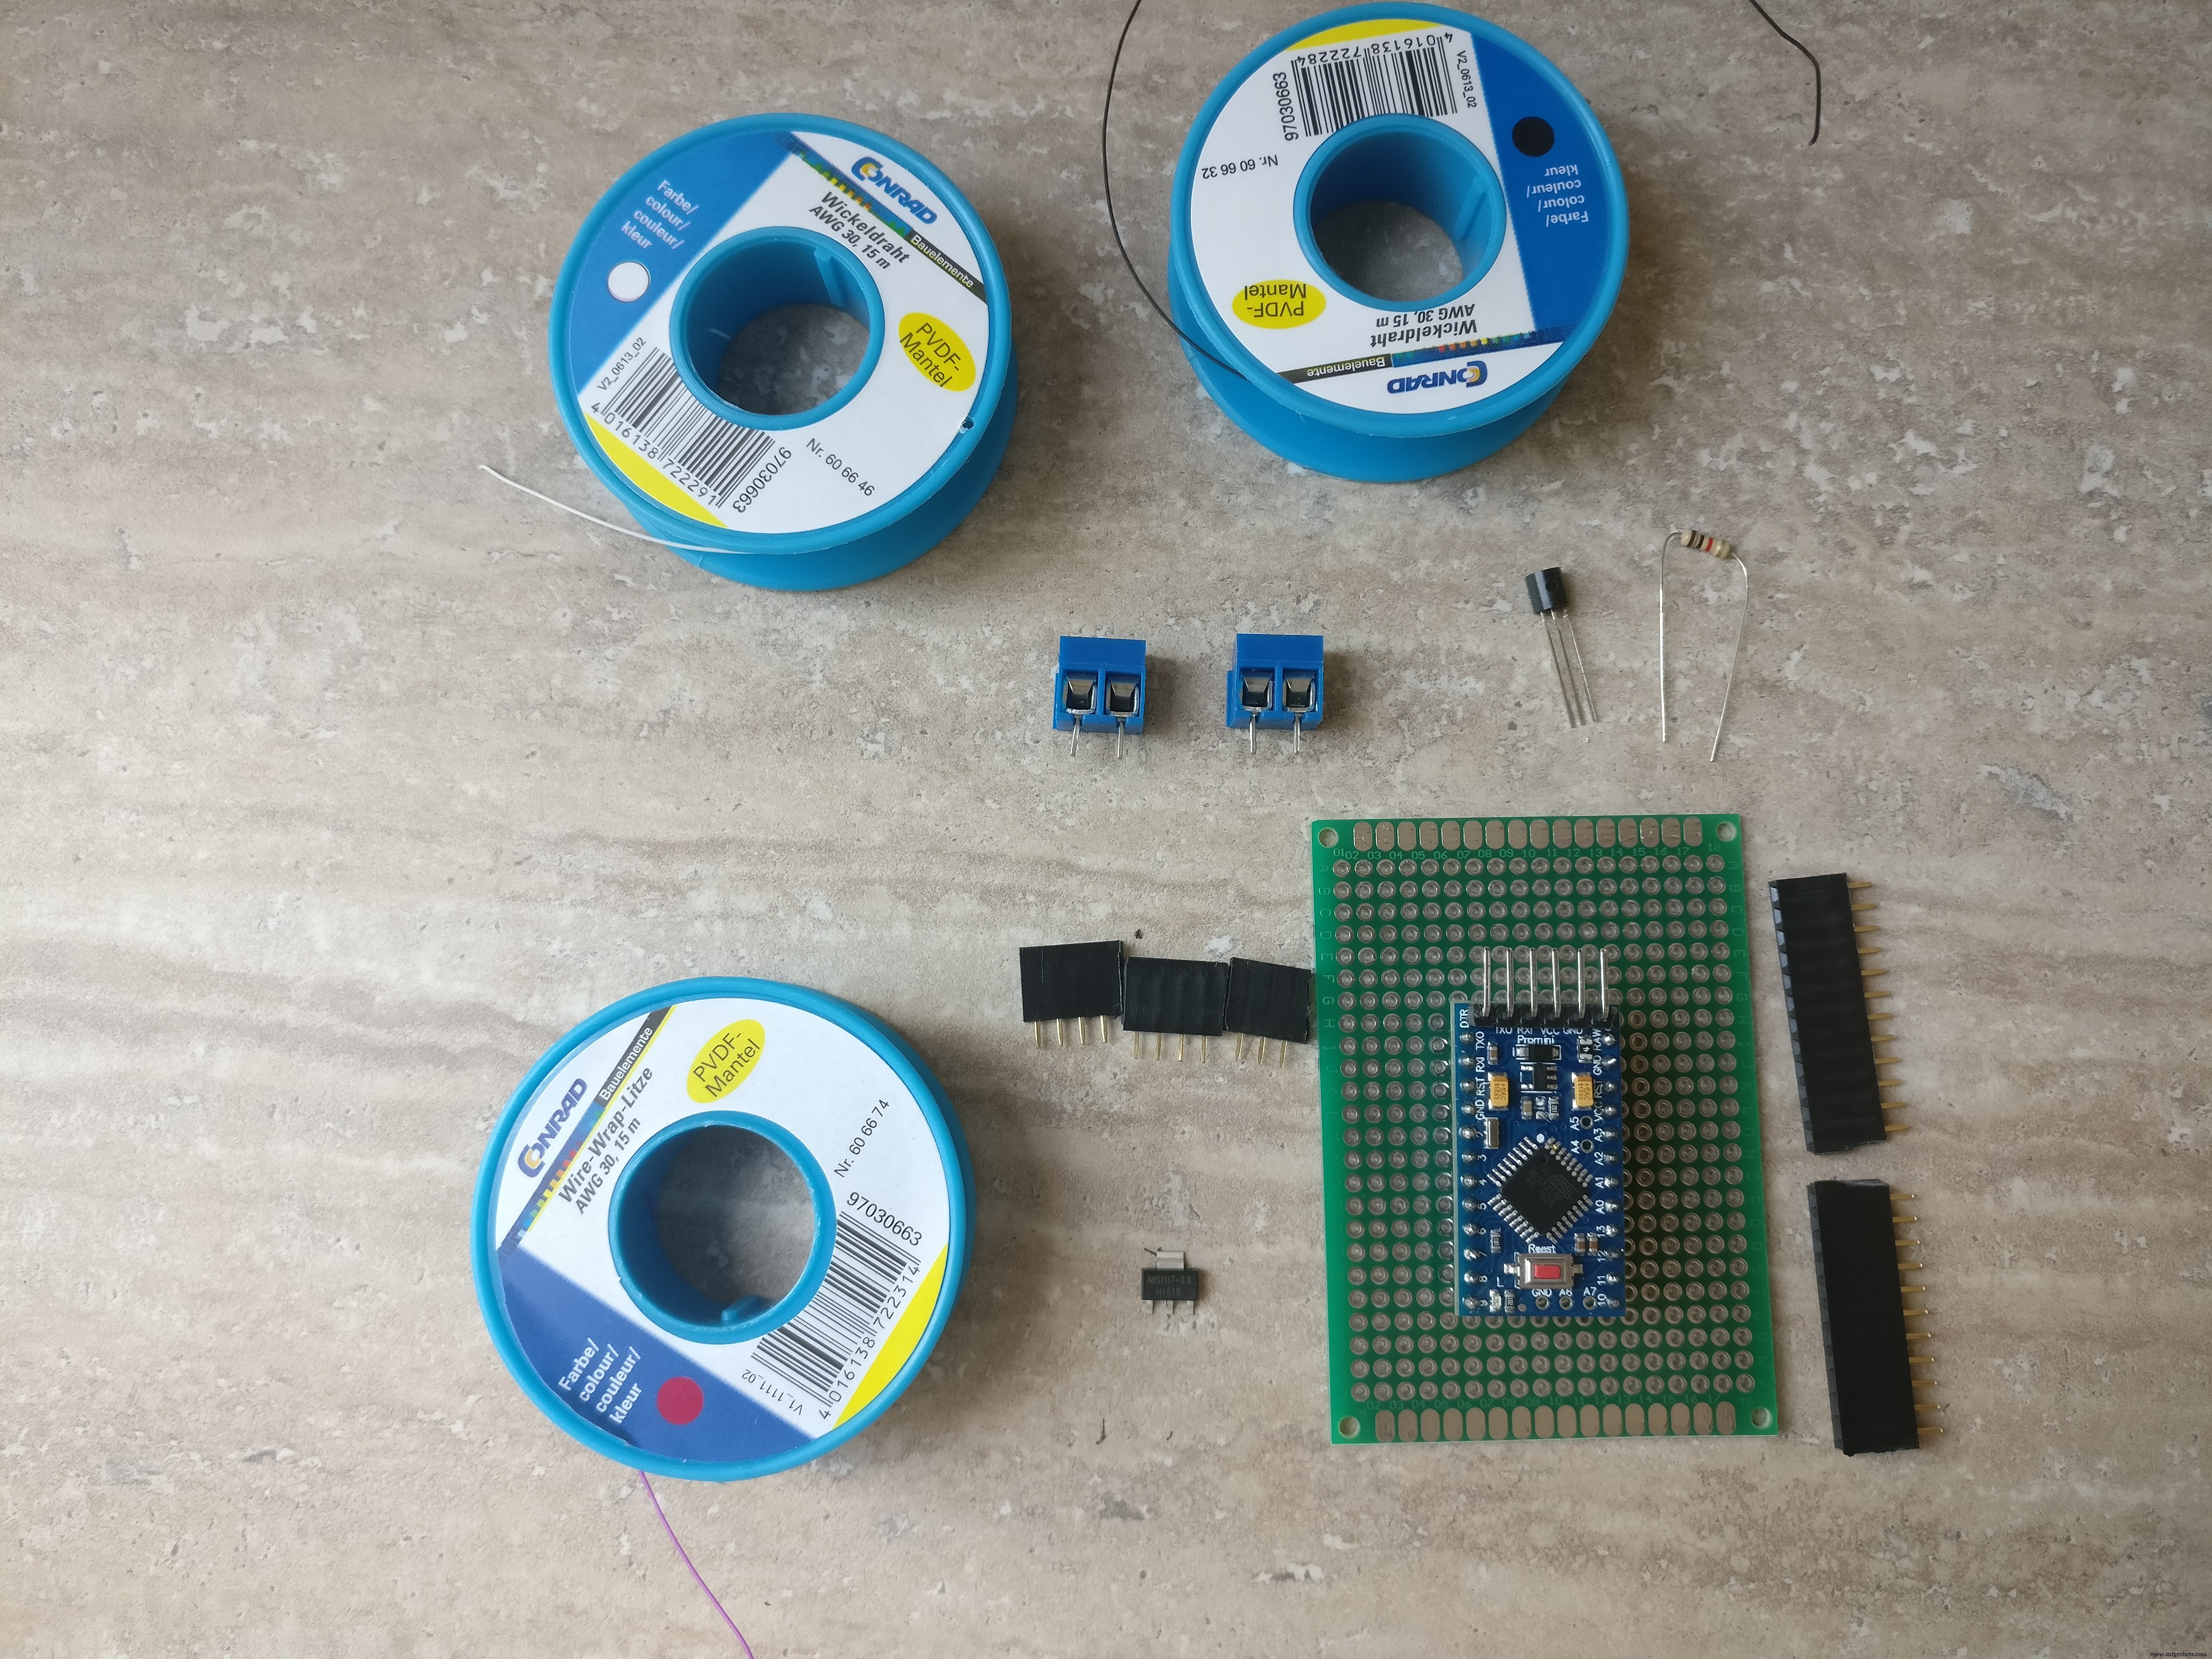
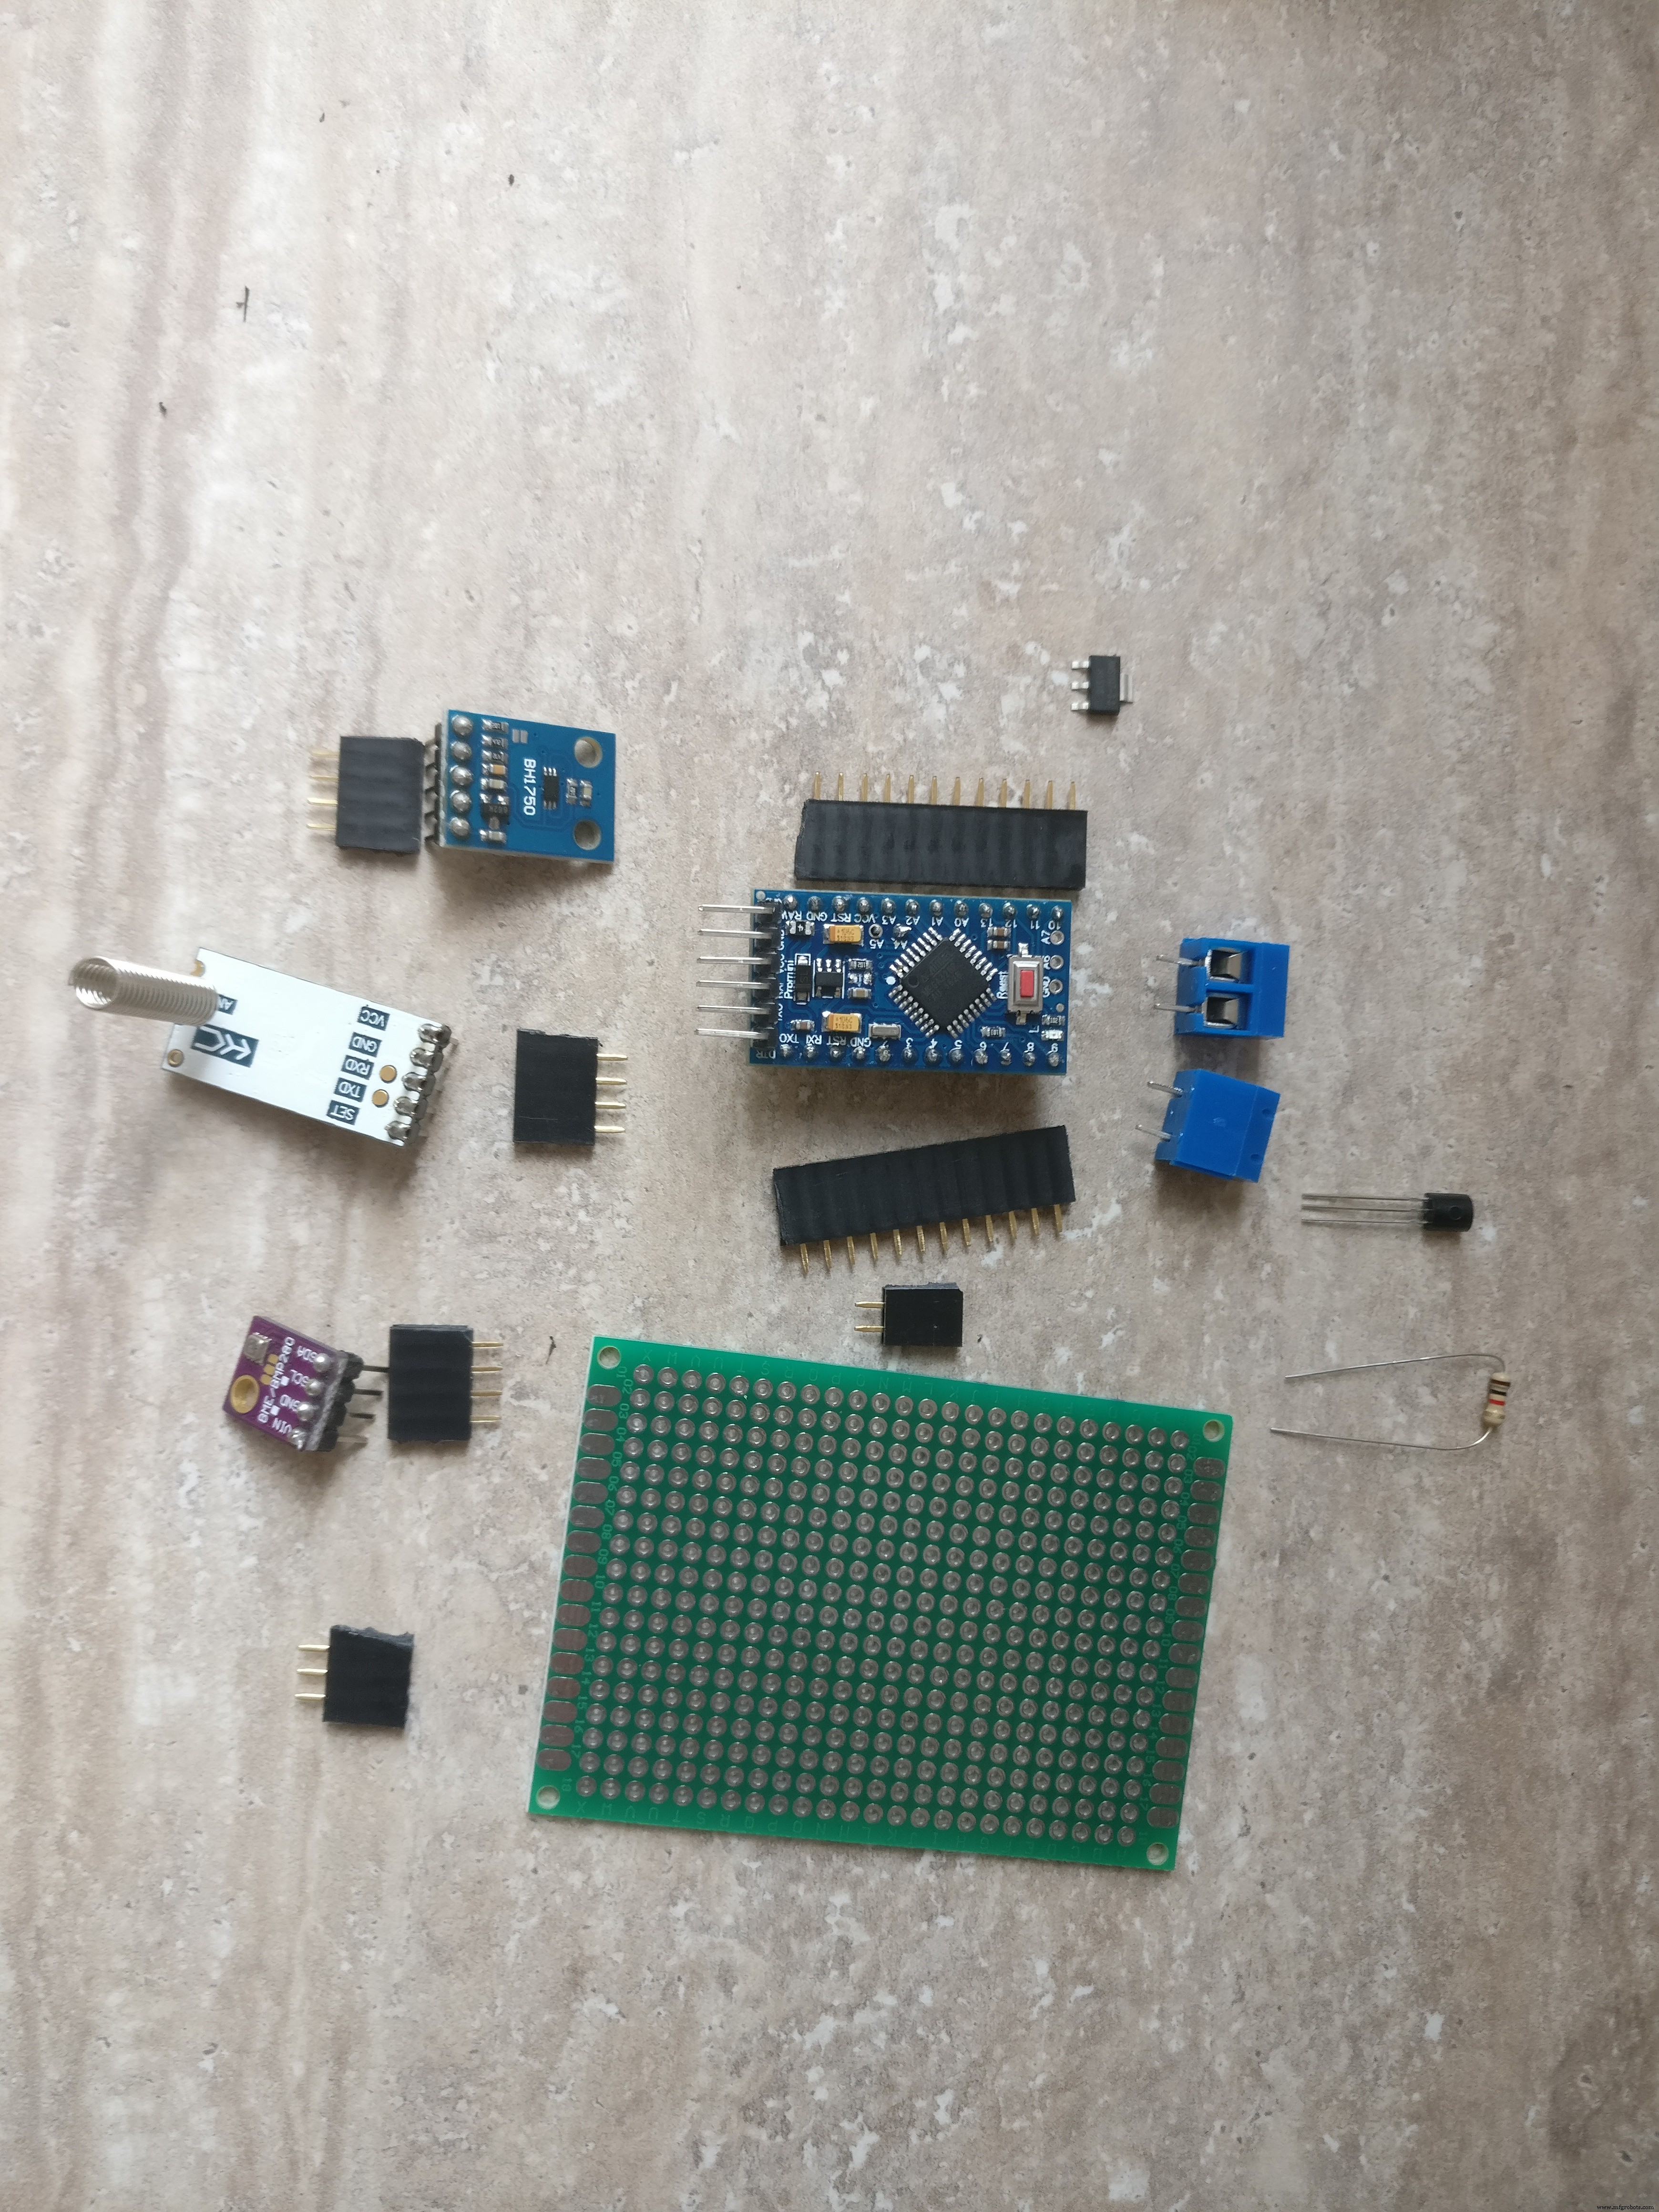
부품:
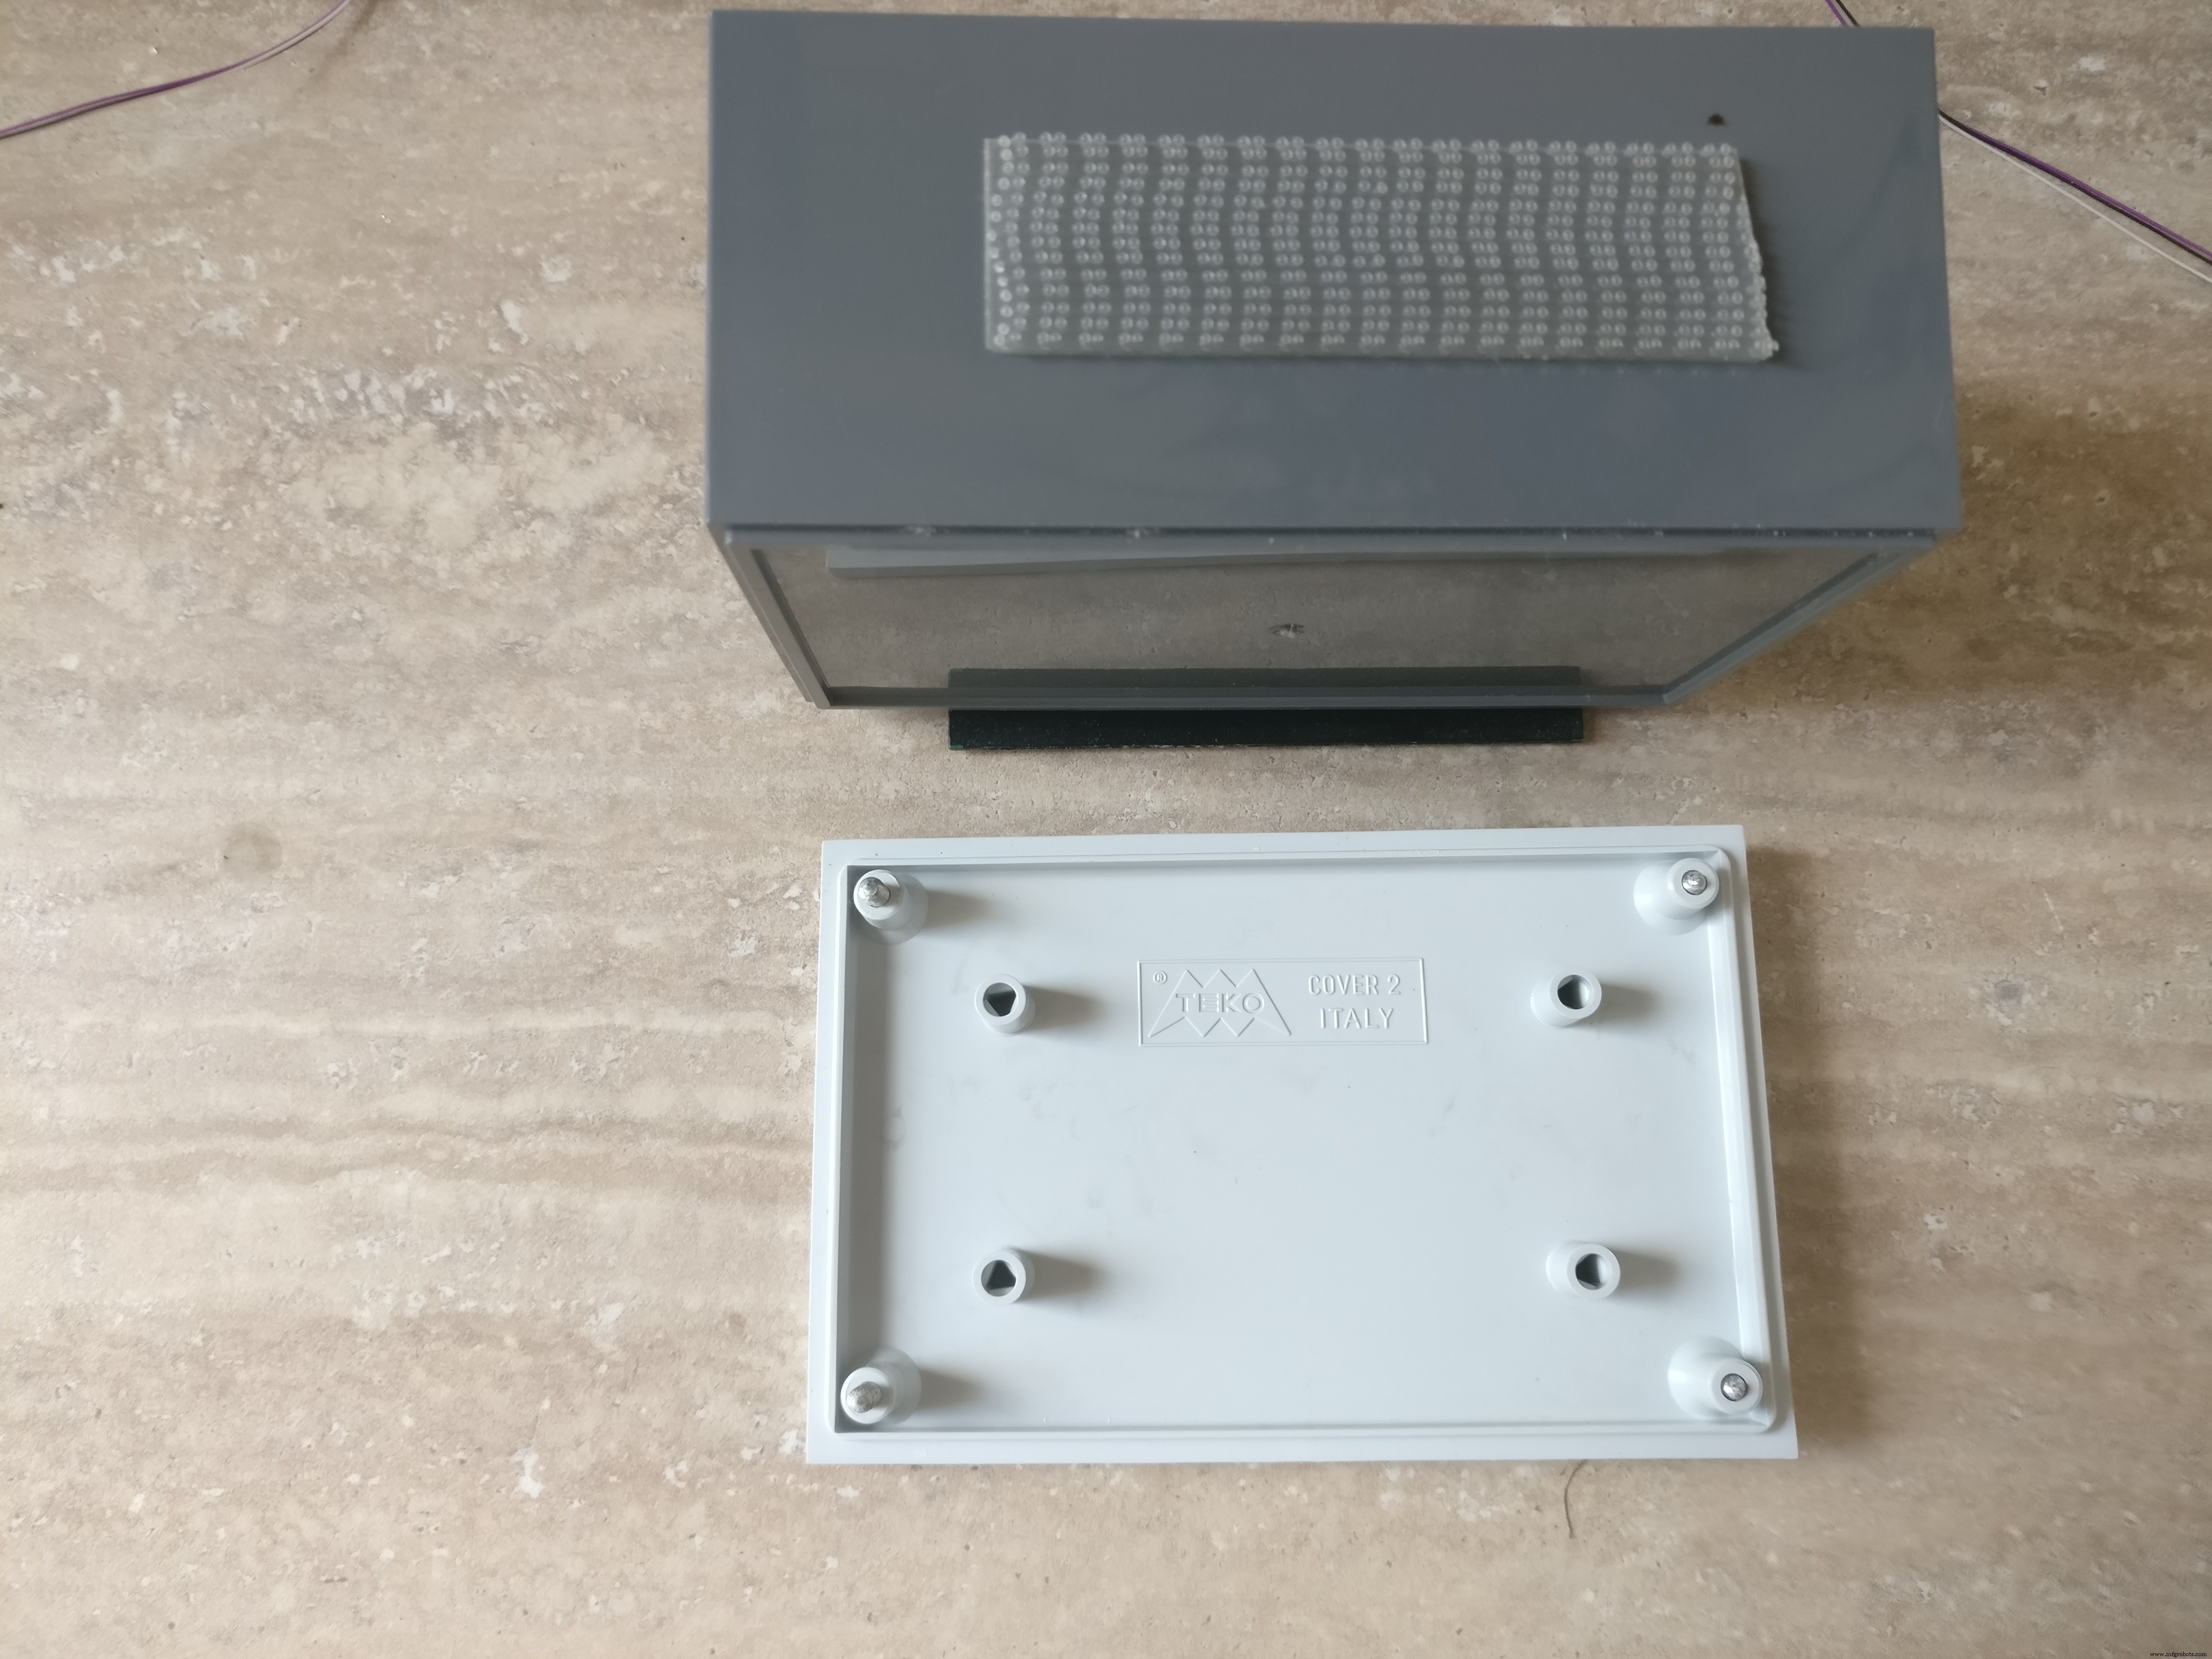
1. 분리 가능한 뚜껑이 있는 작은 플라스틱 상자(나사에는 나사가 있음). 상자 크기는 작은 부품과 배터리를 넣을 수 있을 만큼 커야 합니다. 내 상자의 크기는 11 x 7 x 5cm입니다.
2. AAA 배터리 홀더 3개
3. AAA 충전식 배터리 3개
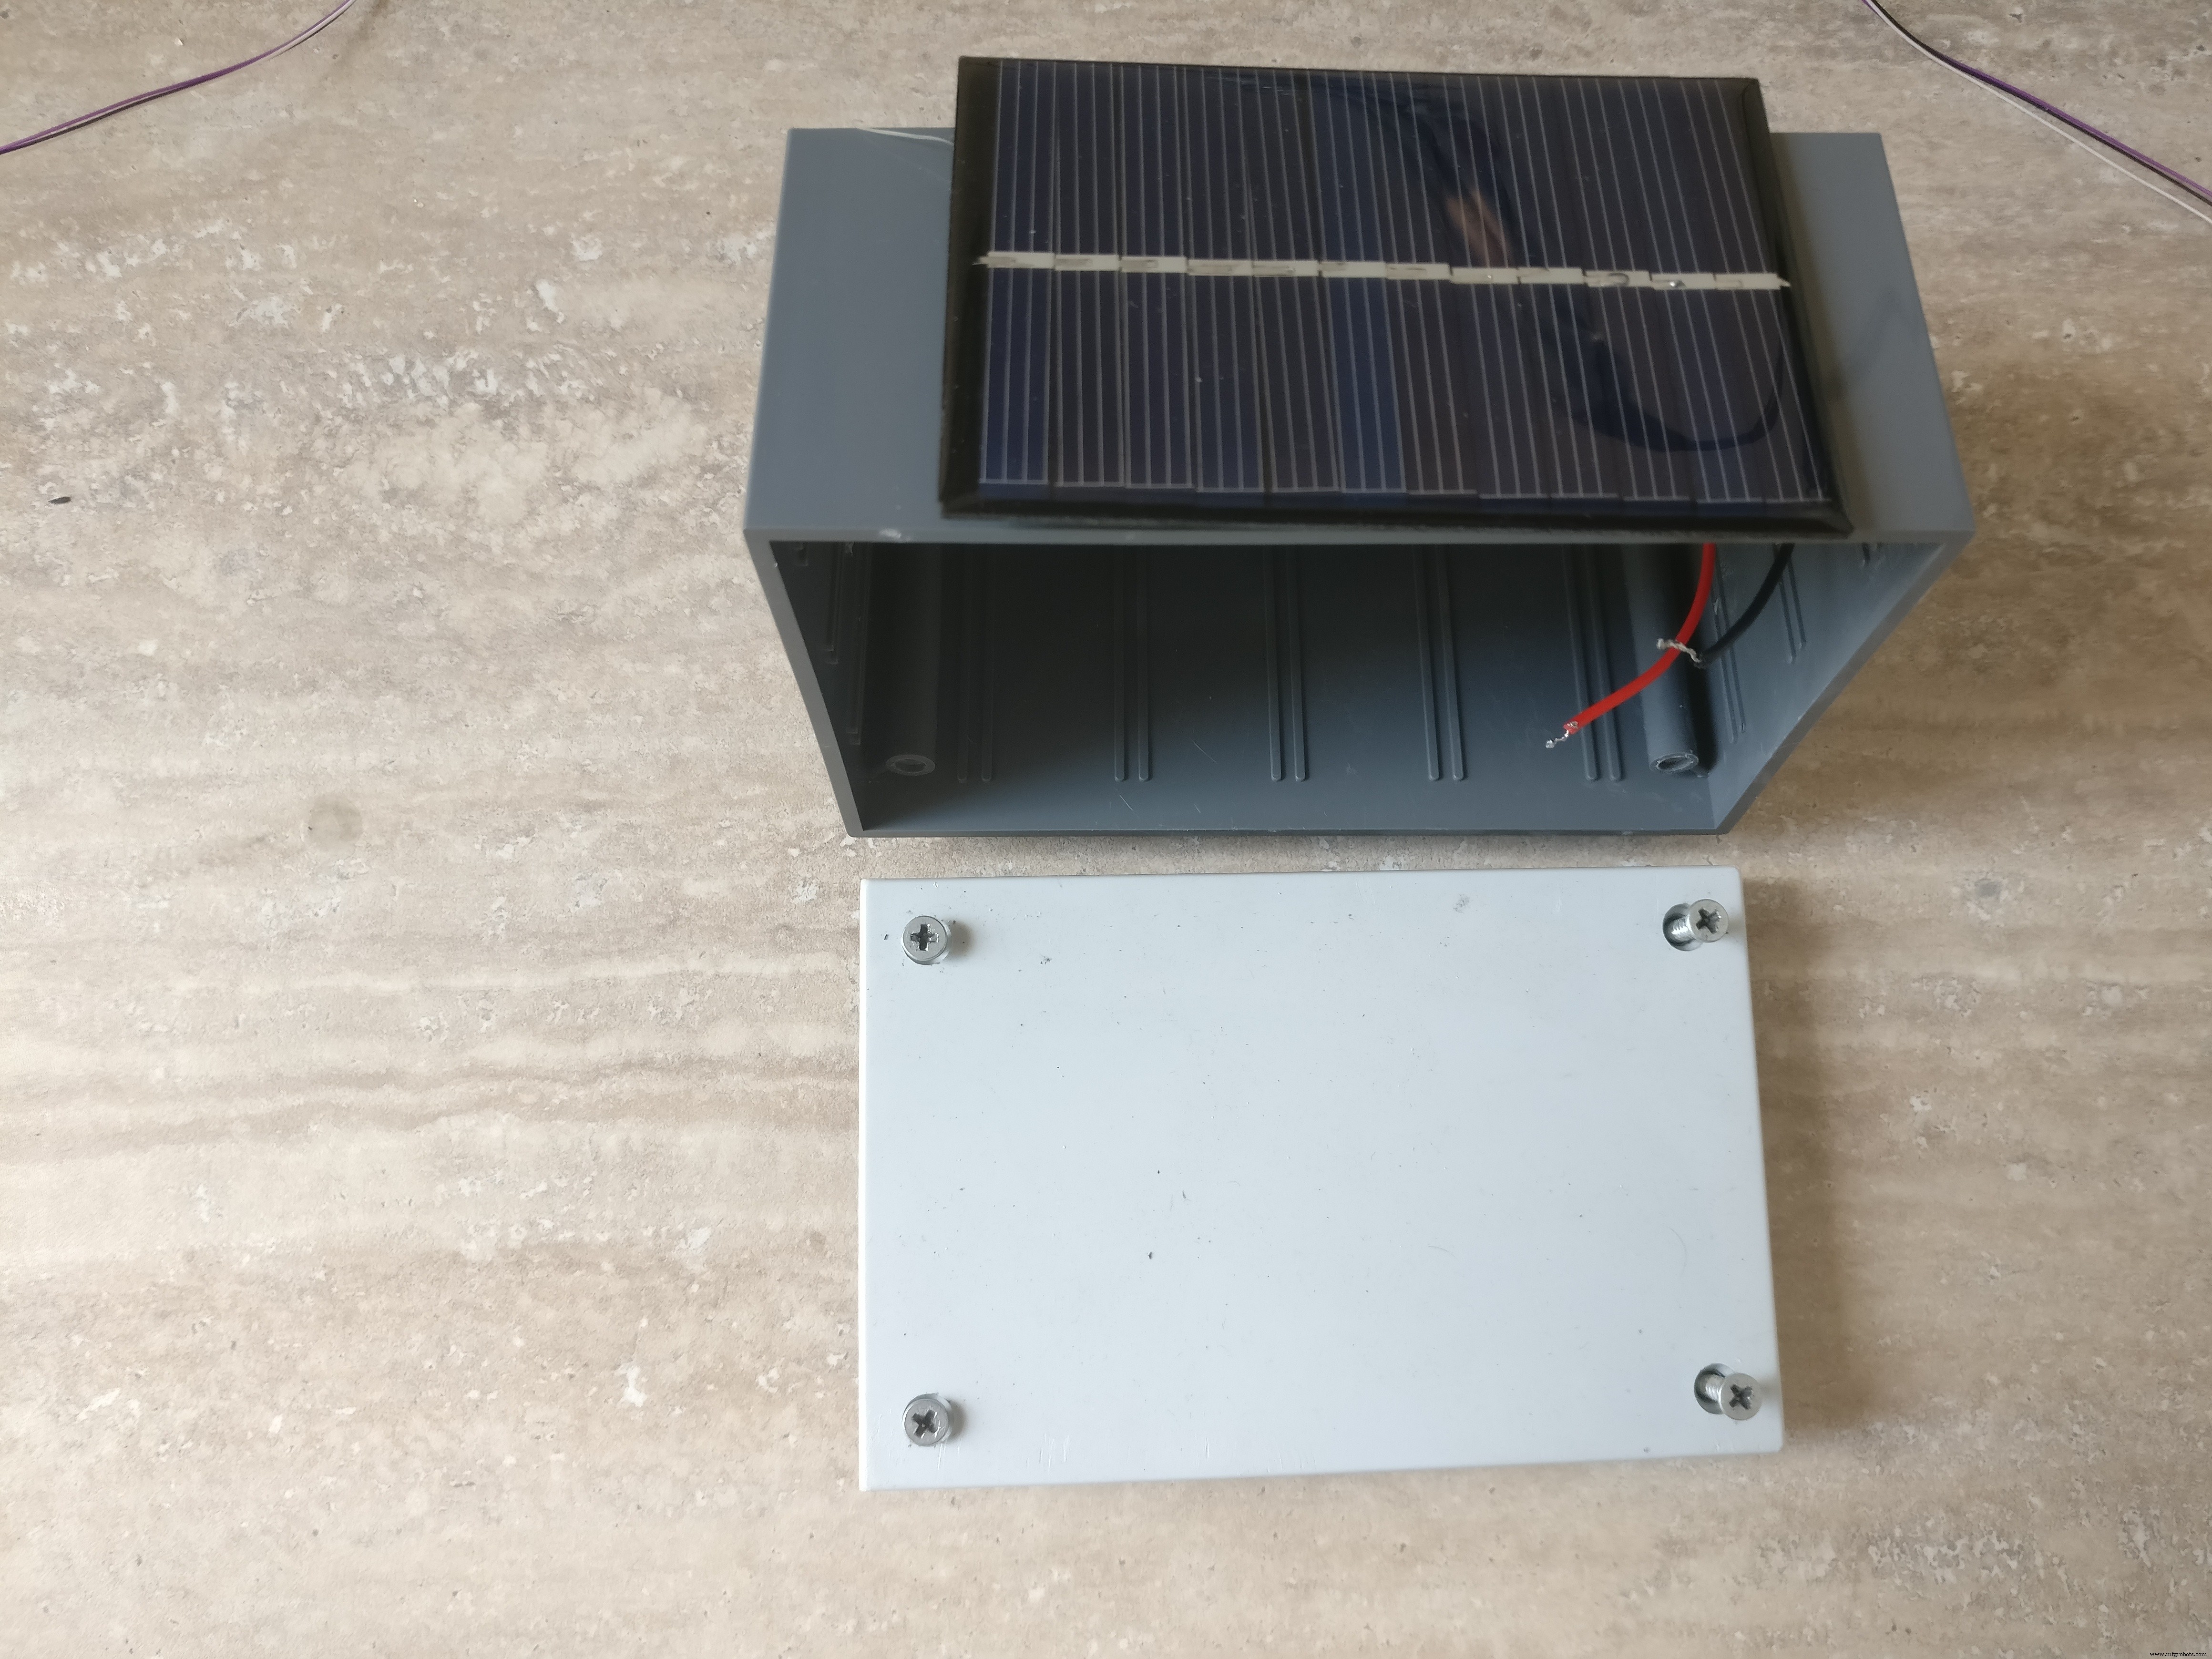
4. 6V 소형 태양광 패널
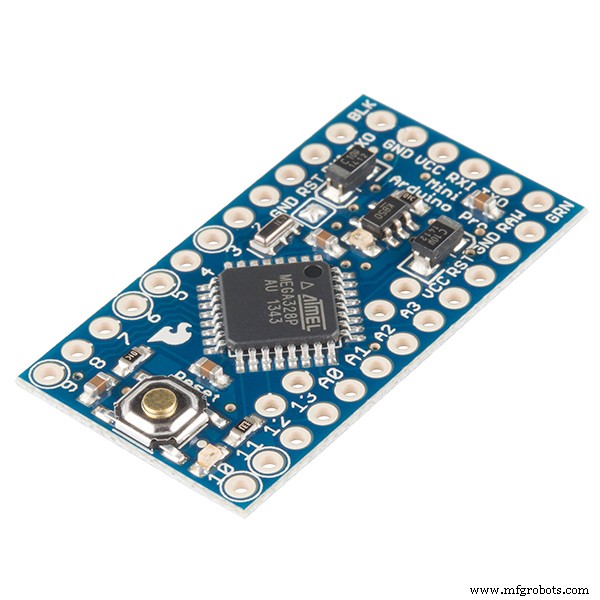
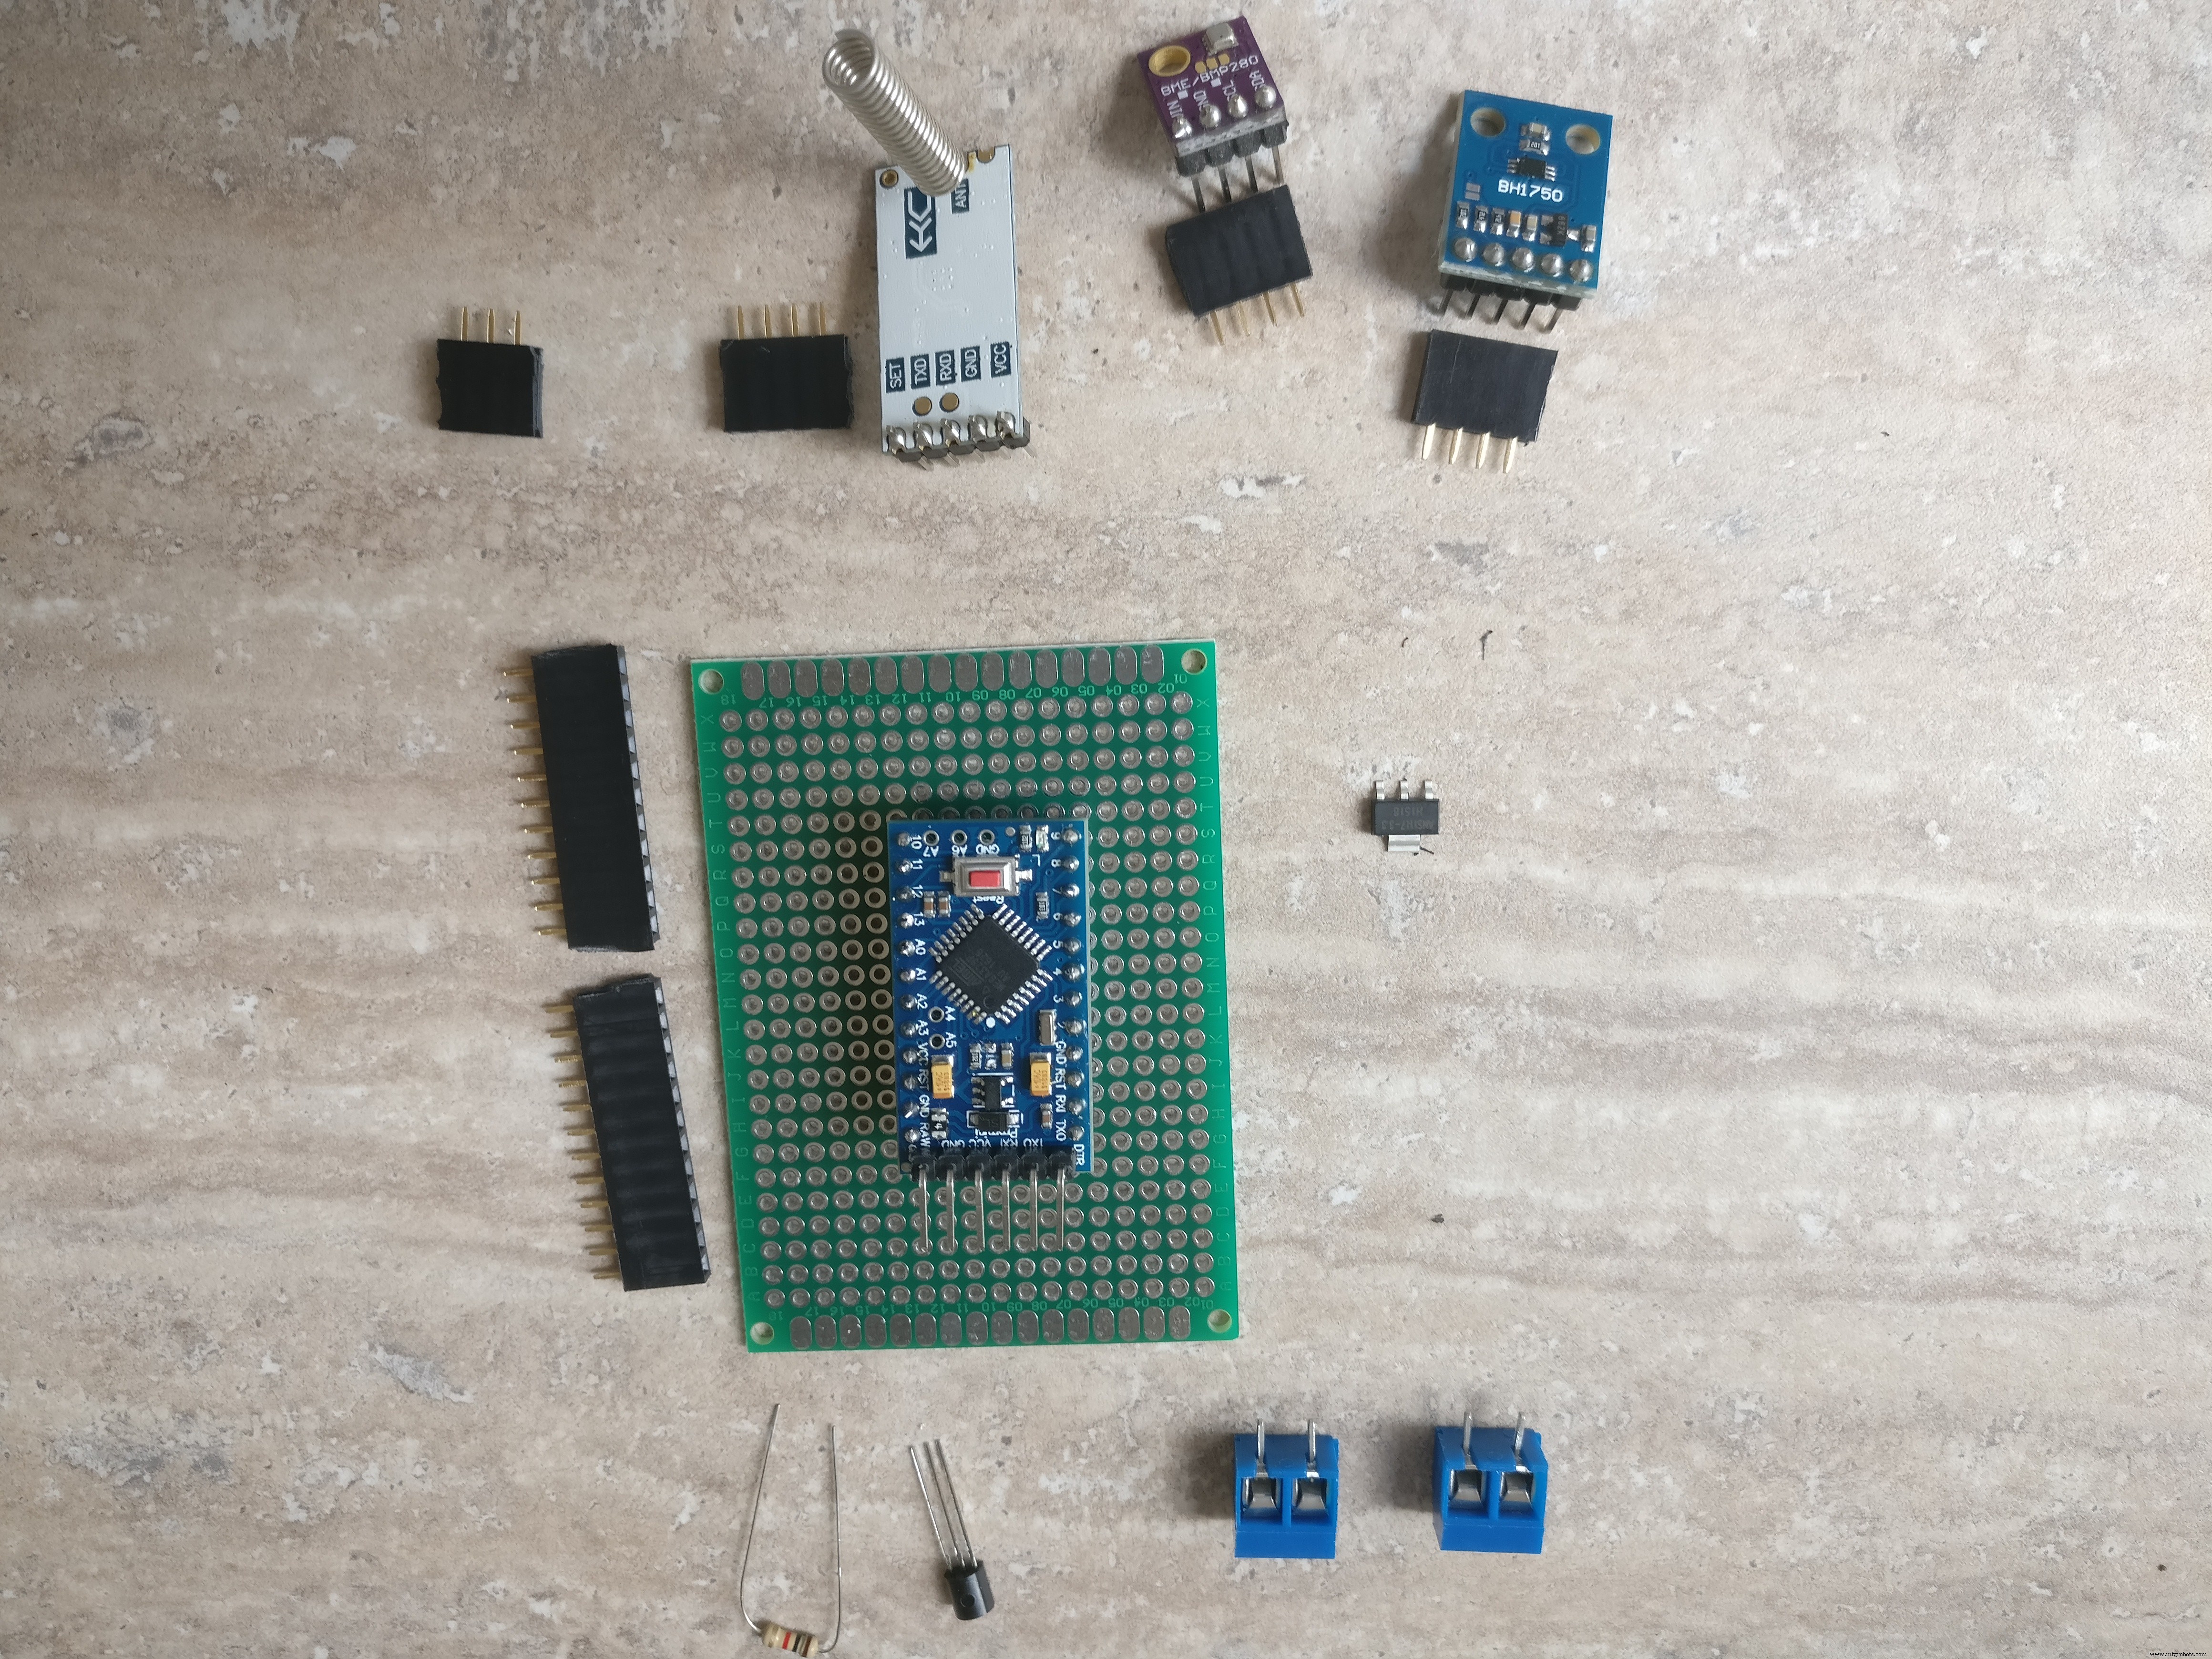
5. 아두이노 프로 미니 328p
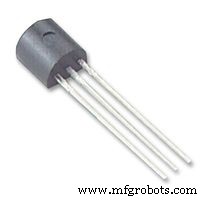
6. 다이오드, 1N4004(배터리에서 패널로 역전류를 방지하기 위해)
7. 소형 NPN 트랜지스터 및 1k 저항(구성 요소에 대한 전원 켜기 및 끄기용)
8. 레인 센서
9. HC-12 직렬 통신 모듈
10. HC-12 USB 직렬 모듈(베이스 스테이션용)
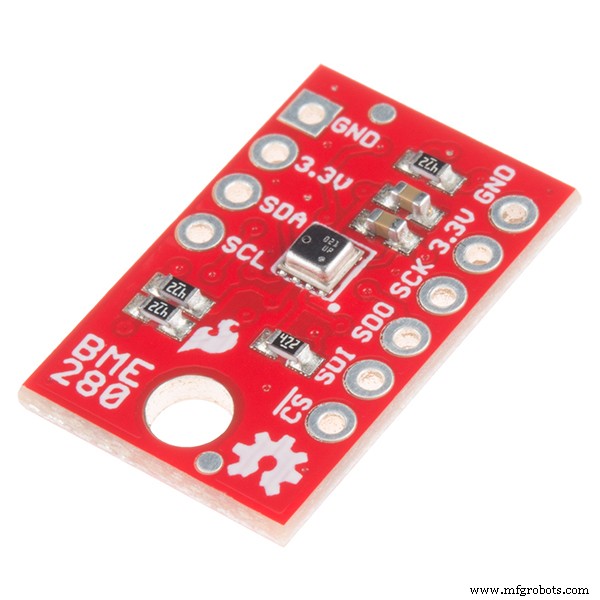
11. BME280 보쉬 센서 모듈(습도, 온도, 압력용)
12. BH1750 광 감지 모듈
13. PCB, 전선, 땜납, 나사 커넥터에 KF301-2P 플러그, 암수 PCB 커넥터, 접착제
14. 3.3V 레귤레이터
15. 기지국:항상 실행되는 PC 또는 개발 보드. 데이터를 수집하고, 강우 예측 모델을 훈련하고, 예측하는 역할입니다.
도구:
1. USB-직렬 FTDI 어댑터 FT232RL을 사용하여 Arduino Pro Mini
2. 아두이노 IDE
3. 드릴
4. 가는 톱날
5. 드라이버
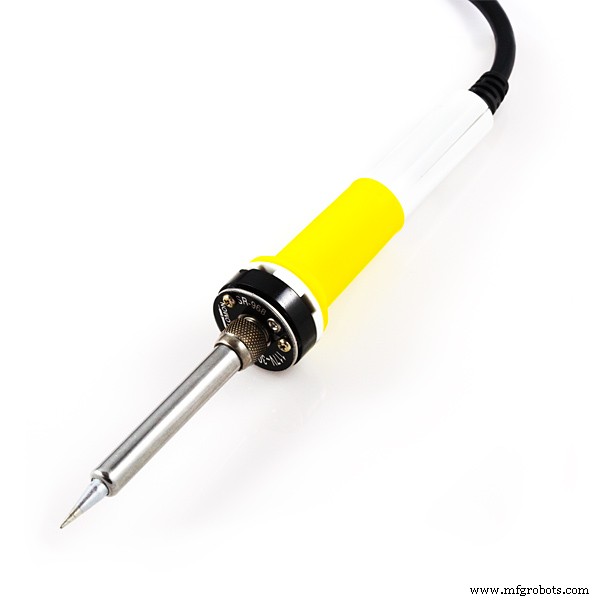
6. 납땜 인두
7. 와이어 커터
기술:
1. 납땜, 이 튜토리얼을 확인하십시오
2. 기본 아두이노 프로그래밍
3. 리눅스 서비스 설정, 패키지 설치
4. 일부 프로그래밍 기술
2단계:기상 관측소 구축
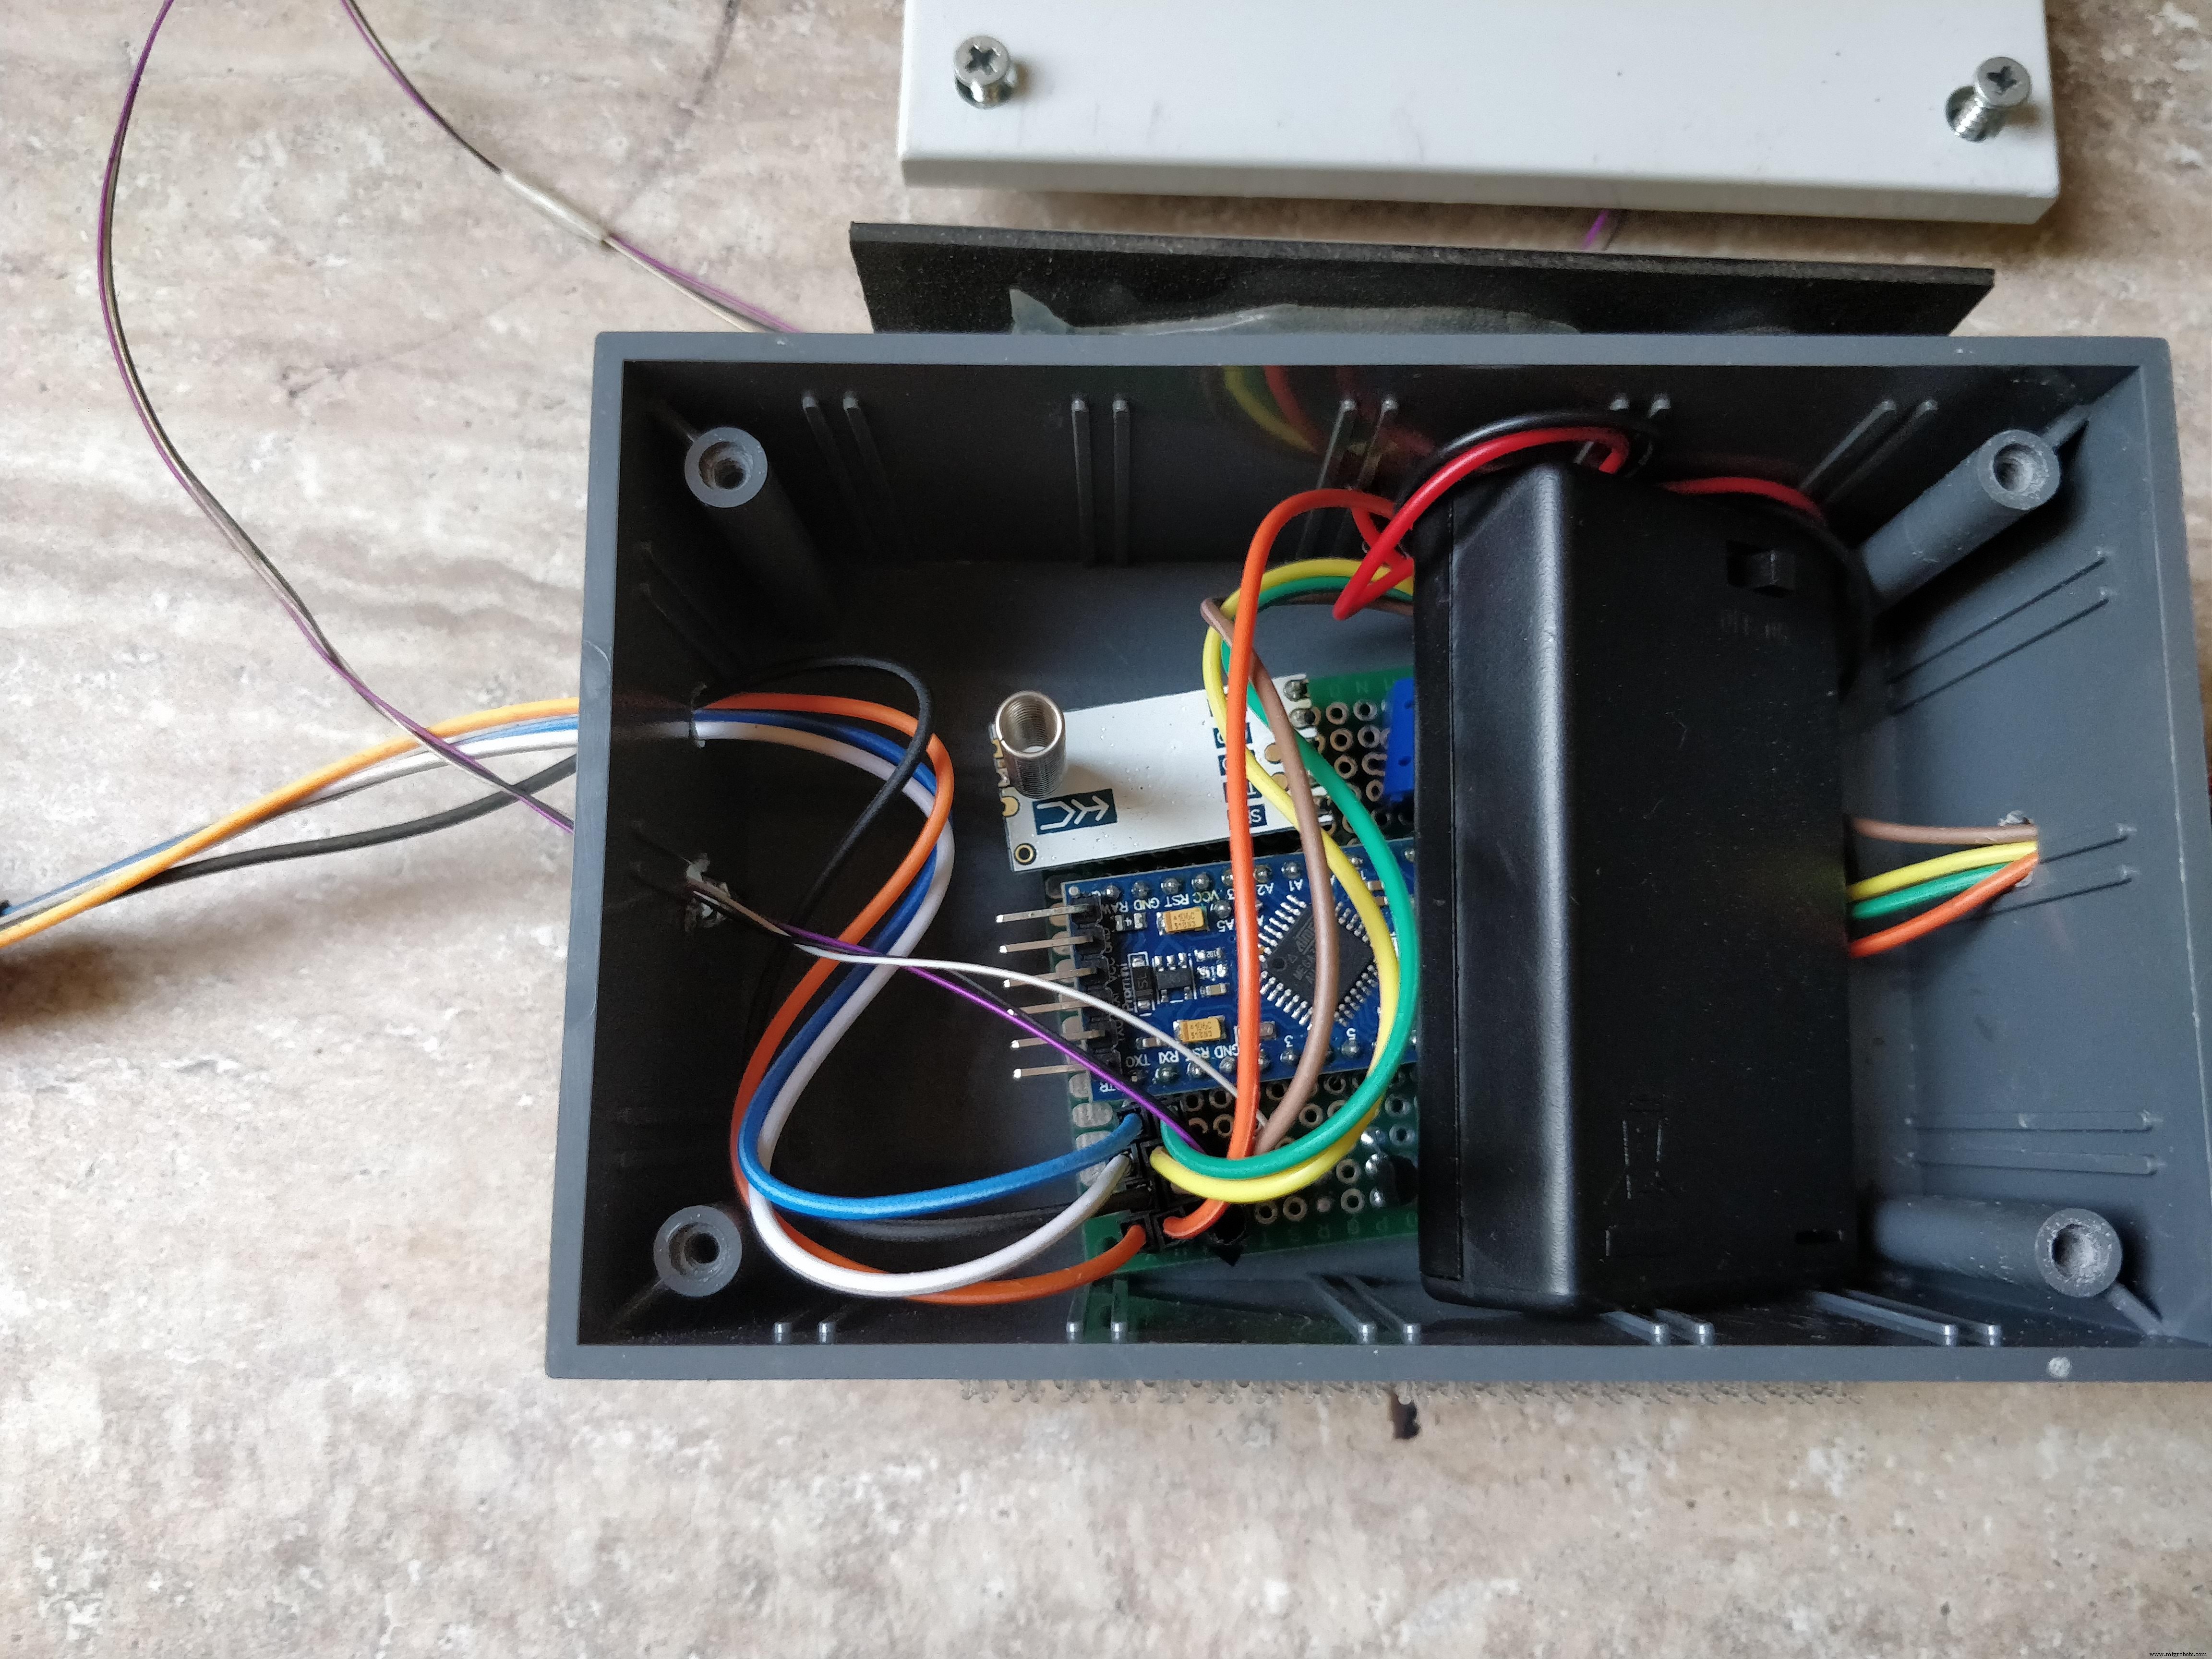
기상 관측소는 다음 구성 요소 집합으로 구성됩니다.
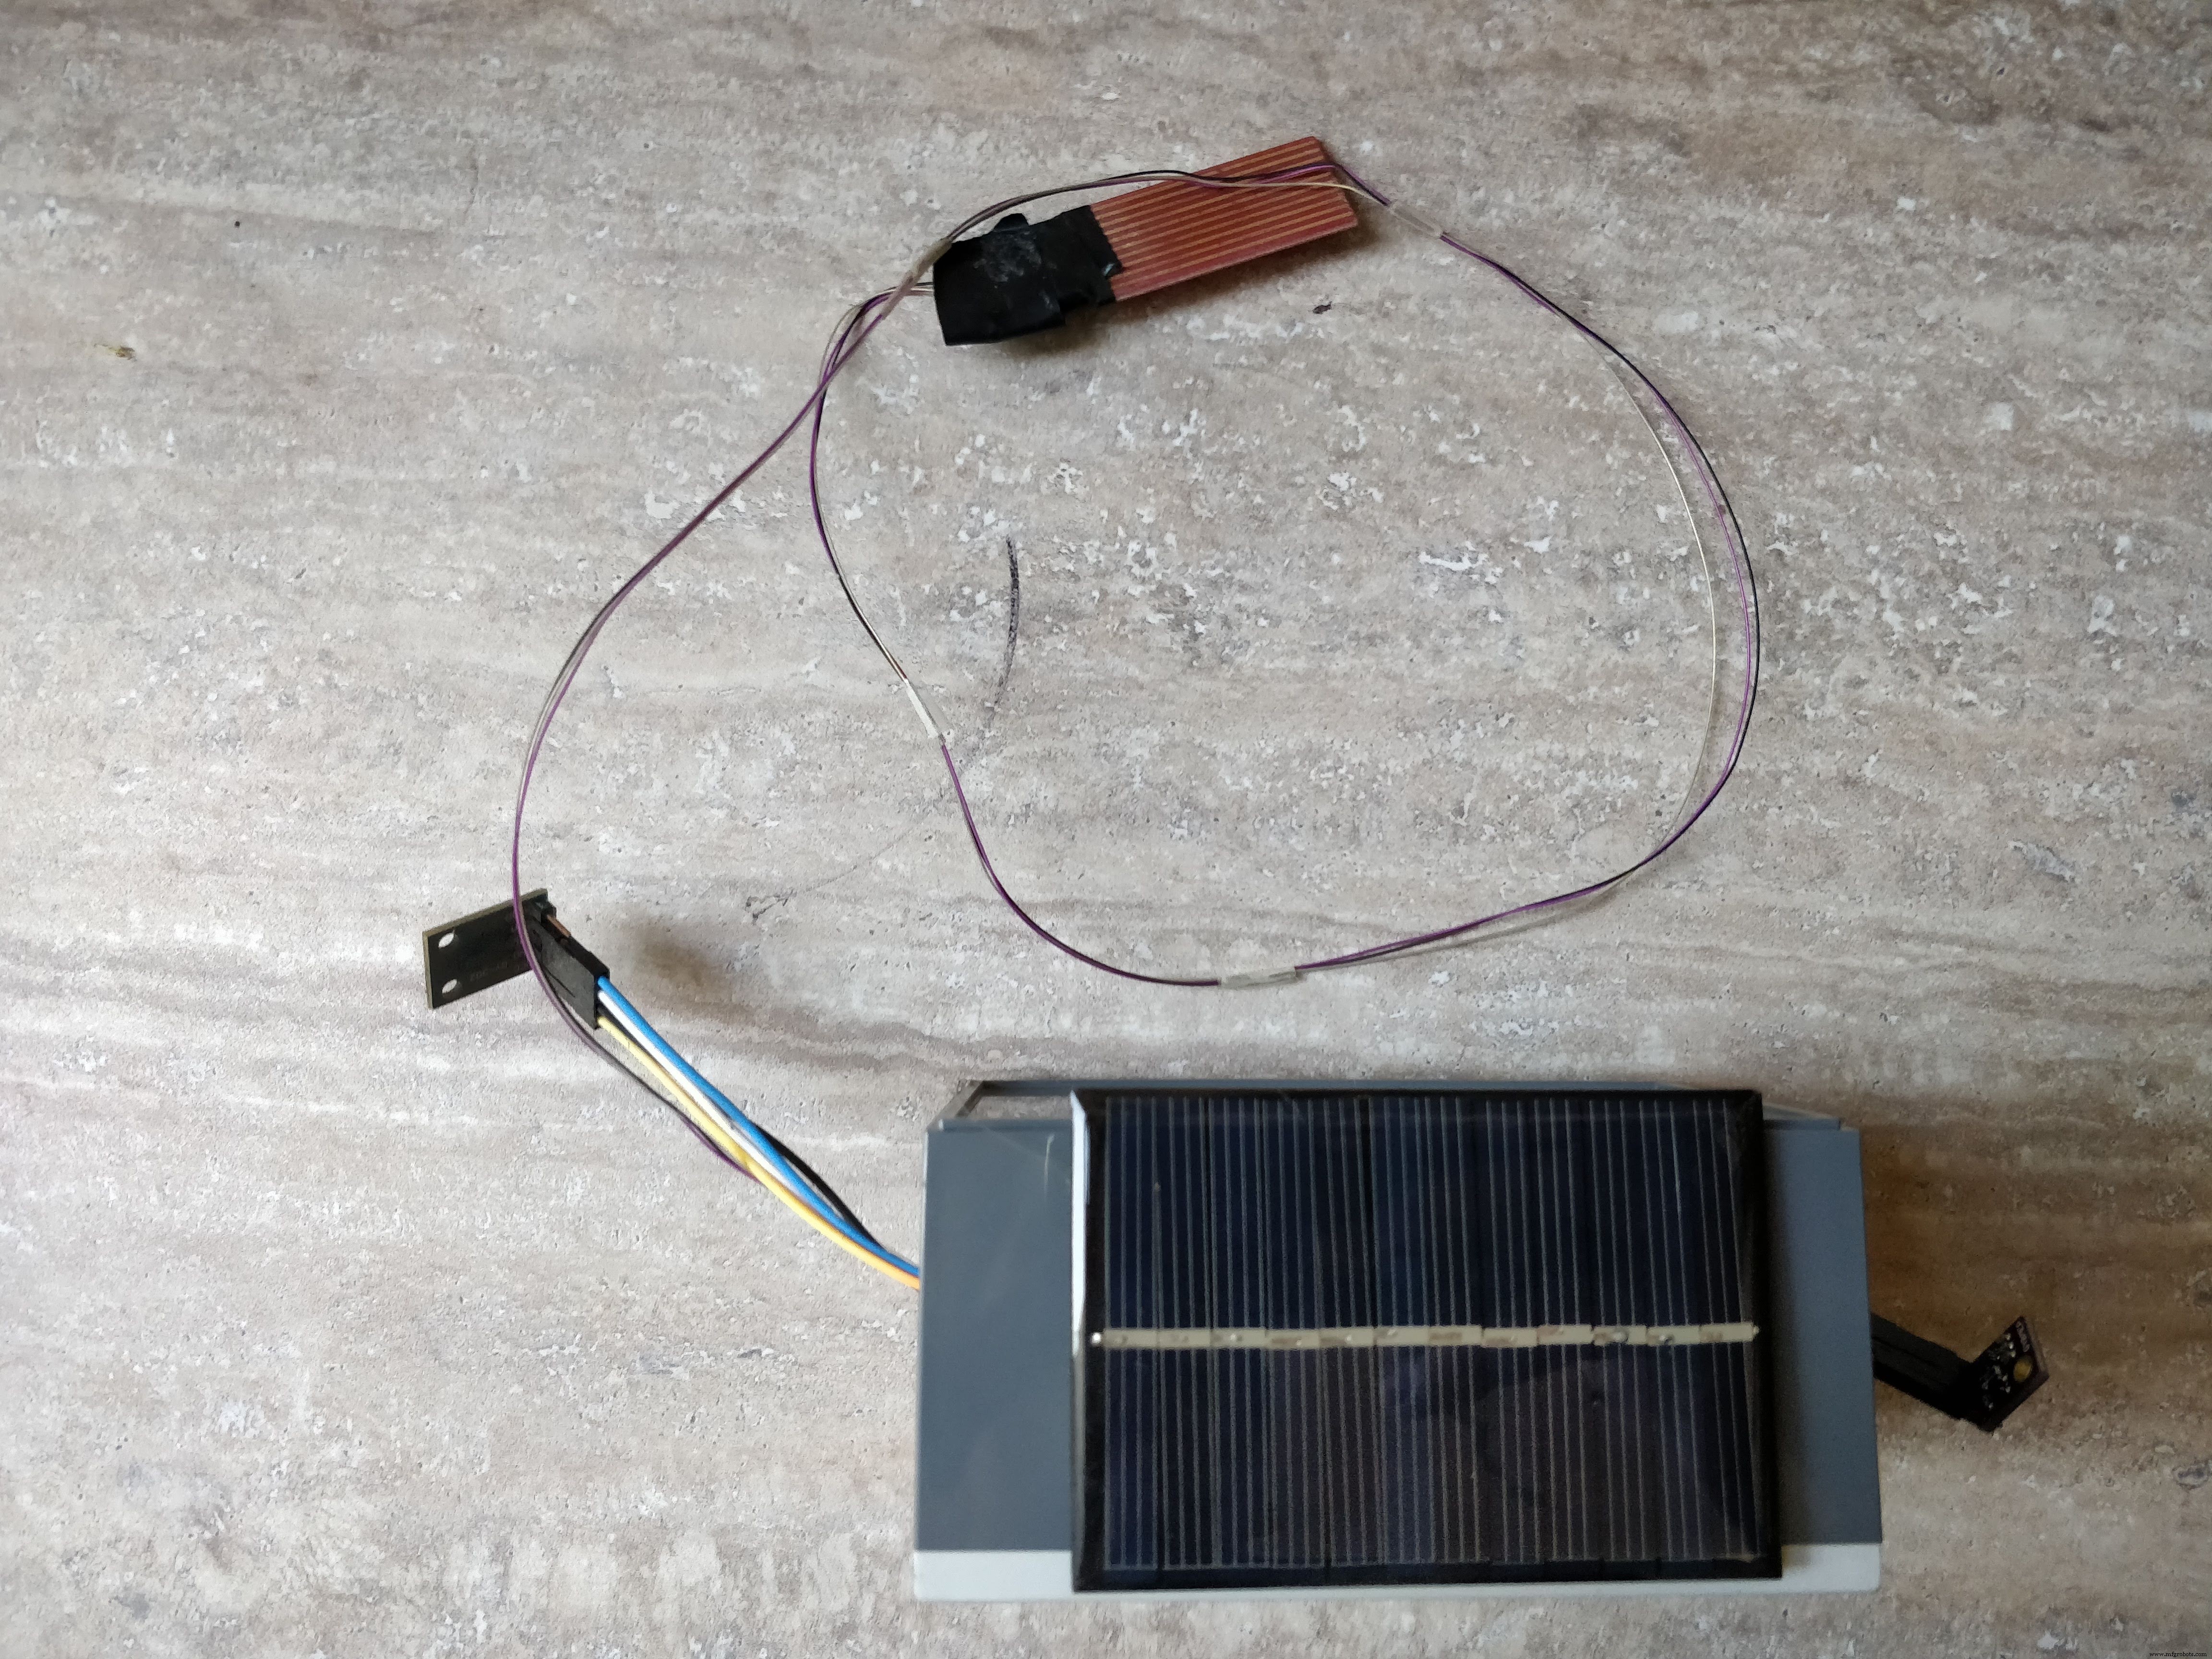
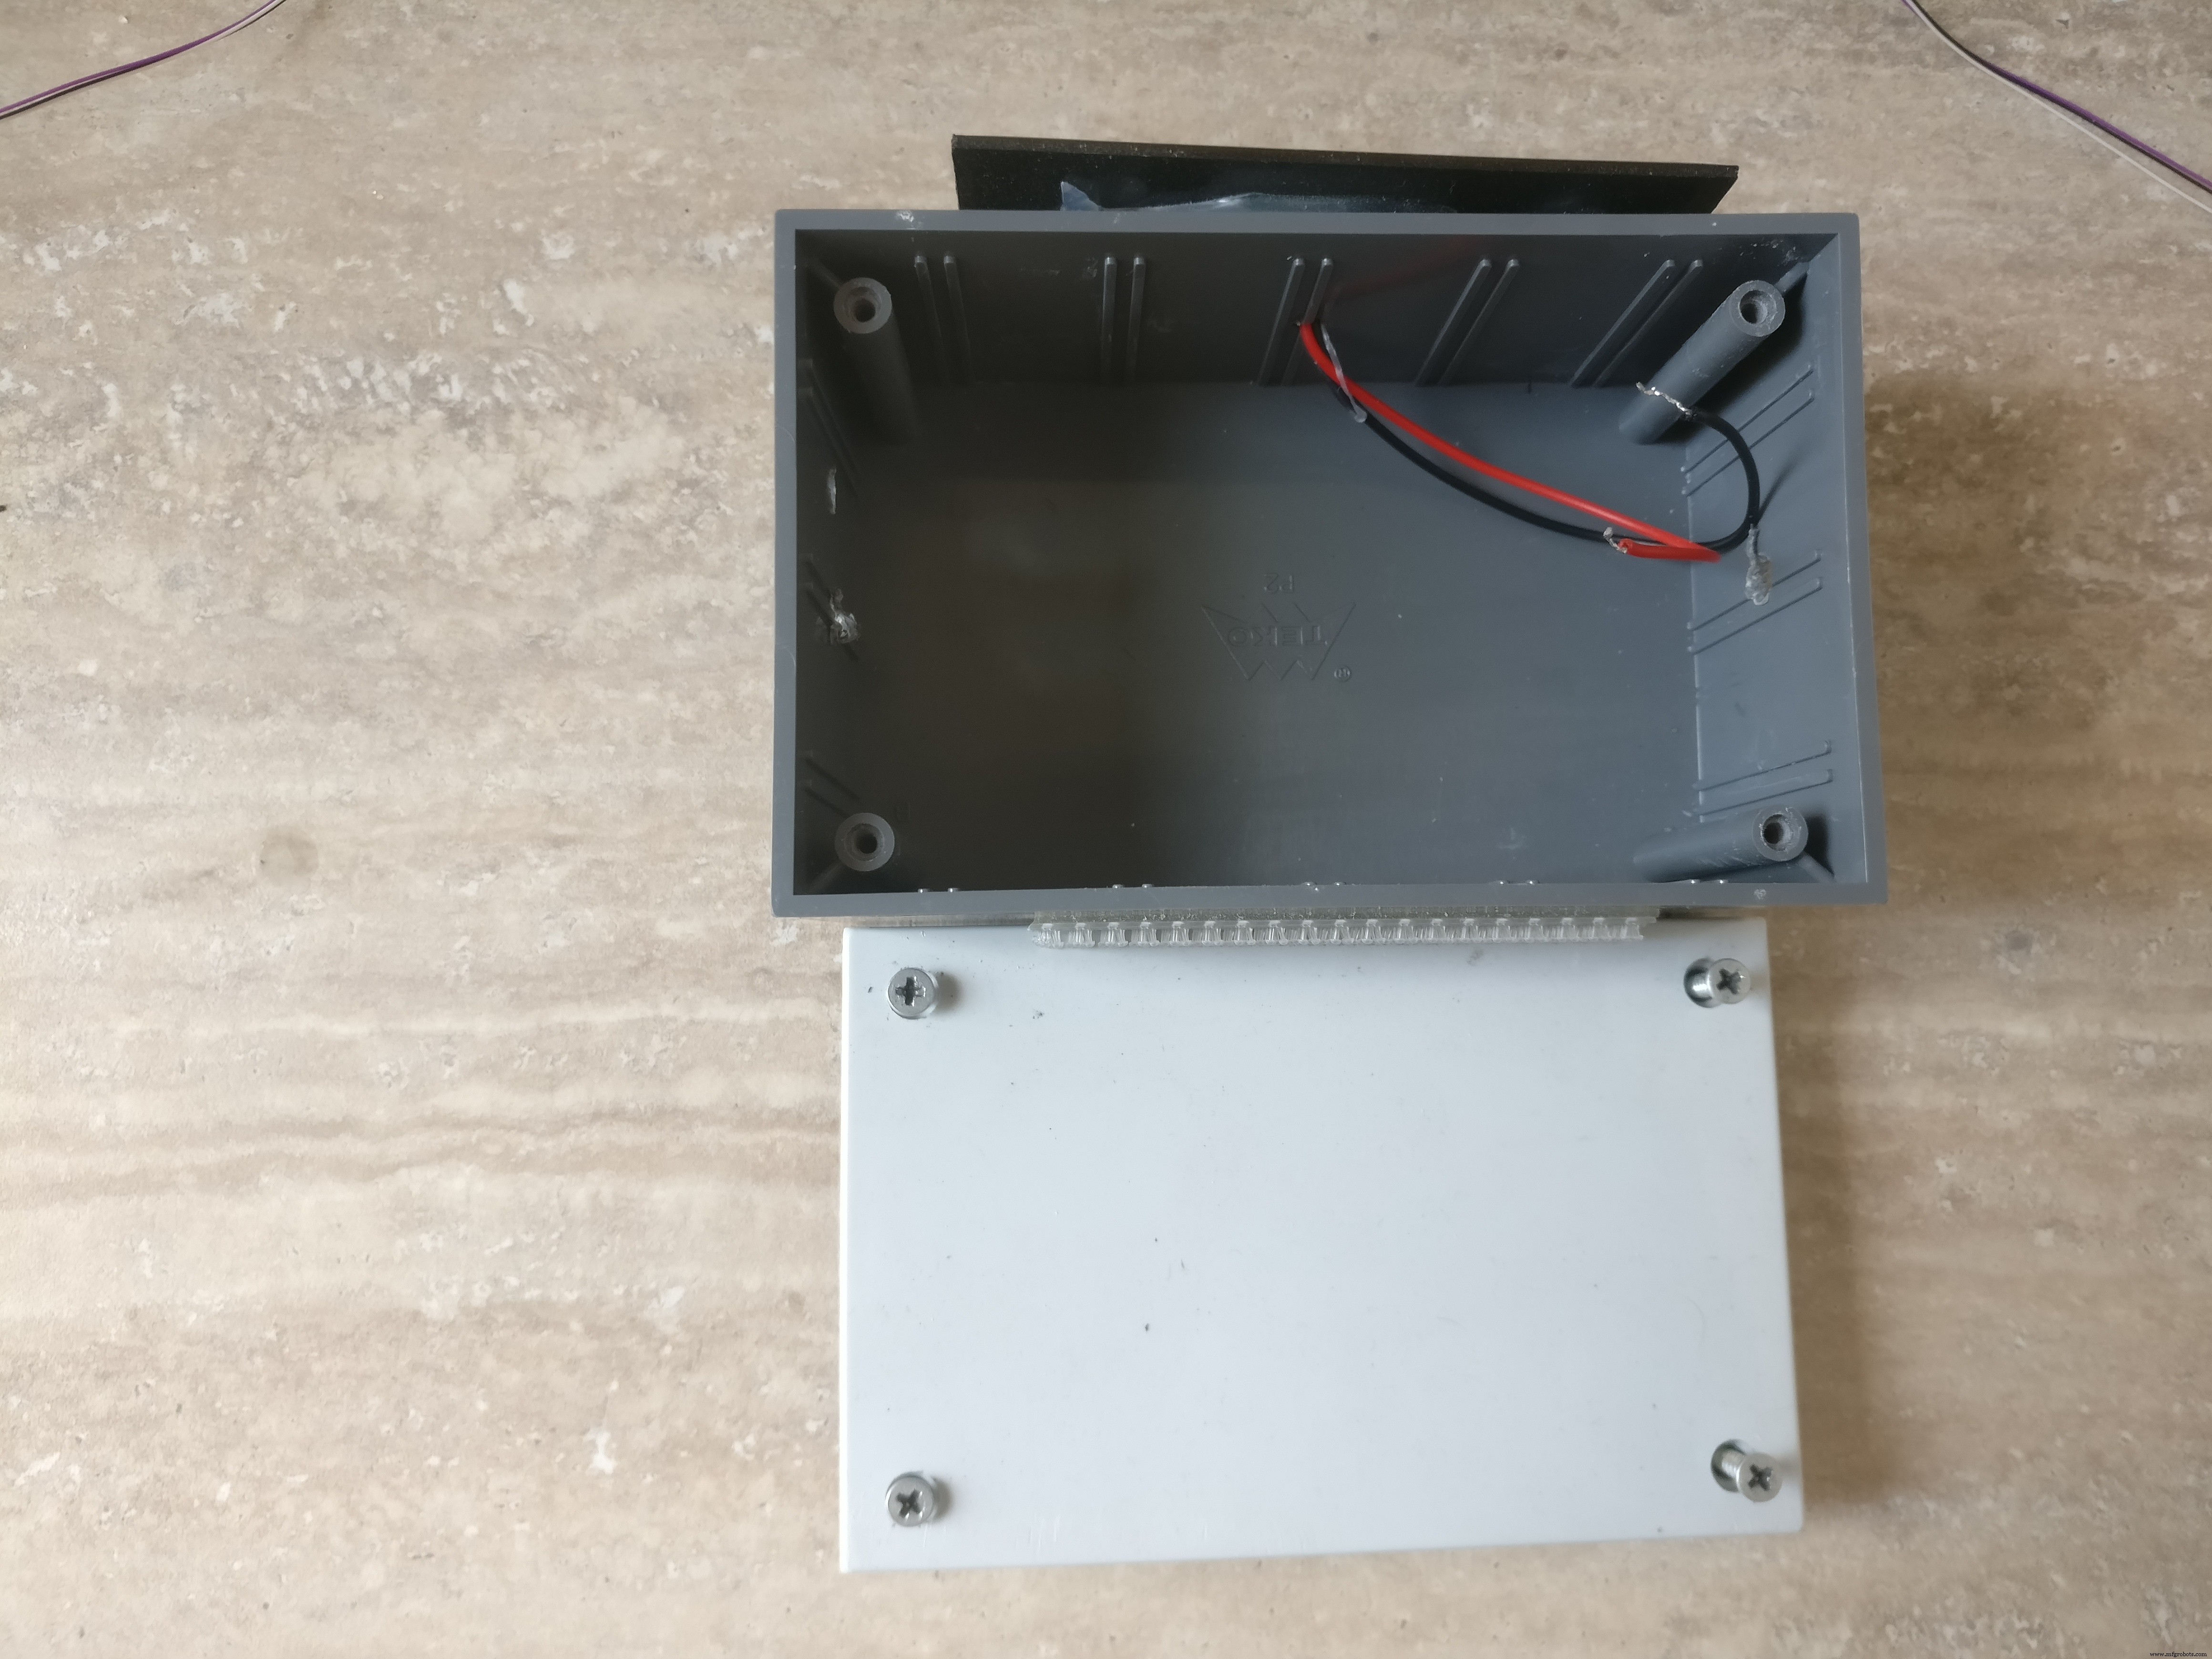
1. 태양 전지판이 붙어 있는 상자
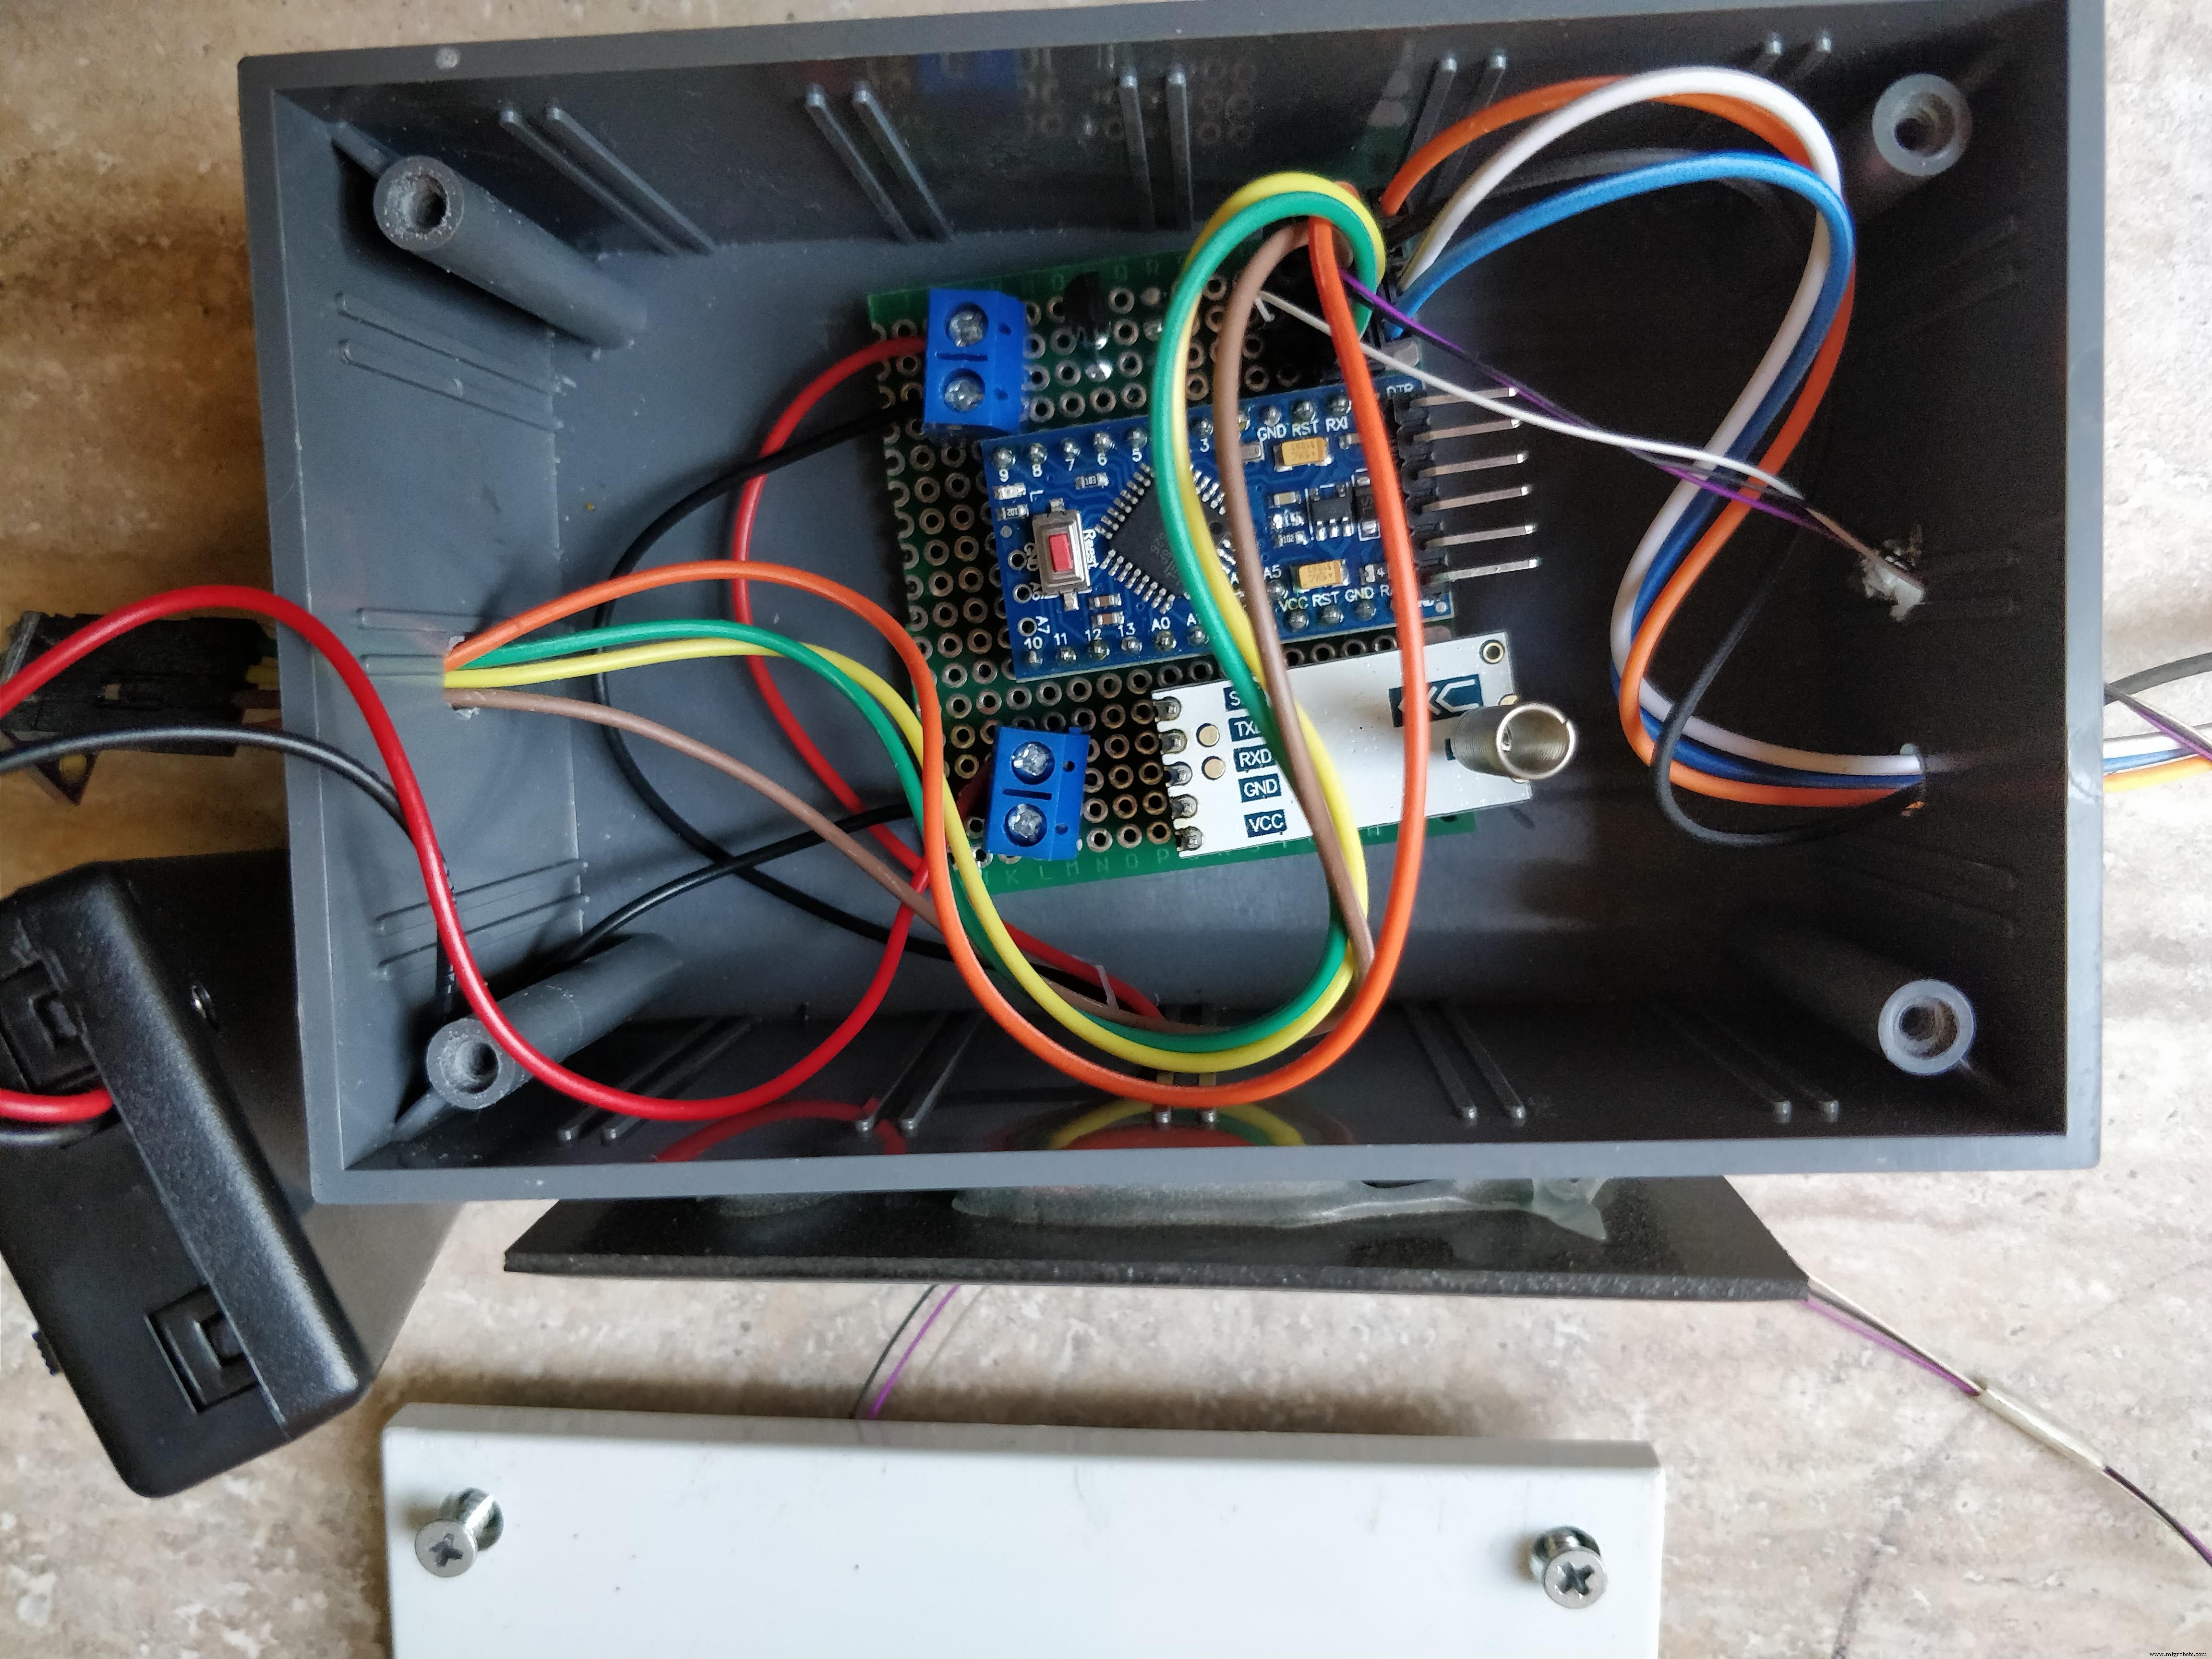
2 . 내부에 전자 장치가 있는 PCB
3. 배터리 홀더도 내부
4. 외부의 BME280 및 빛 및 비 센서
1. 상자에는 4개의 구멍이 필요합니다. 하나는 태양 전지판 와이어용이고 나머지 3개는 외부에 배치될 센서용입니다. 먼저 전체를 드릴로 뚫고 암-수 전선이 튀어나와 센서에 닿을 수 있을 만큼 커야 합니다. 전체를 뚫은 후 패널을 상자의 한쪽에 붙이고 내부 구멍을 통해 와이어를 가져옵니다.
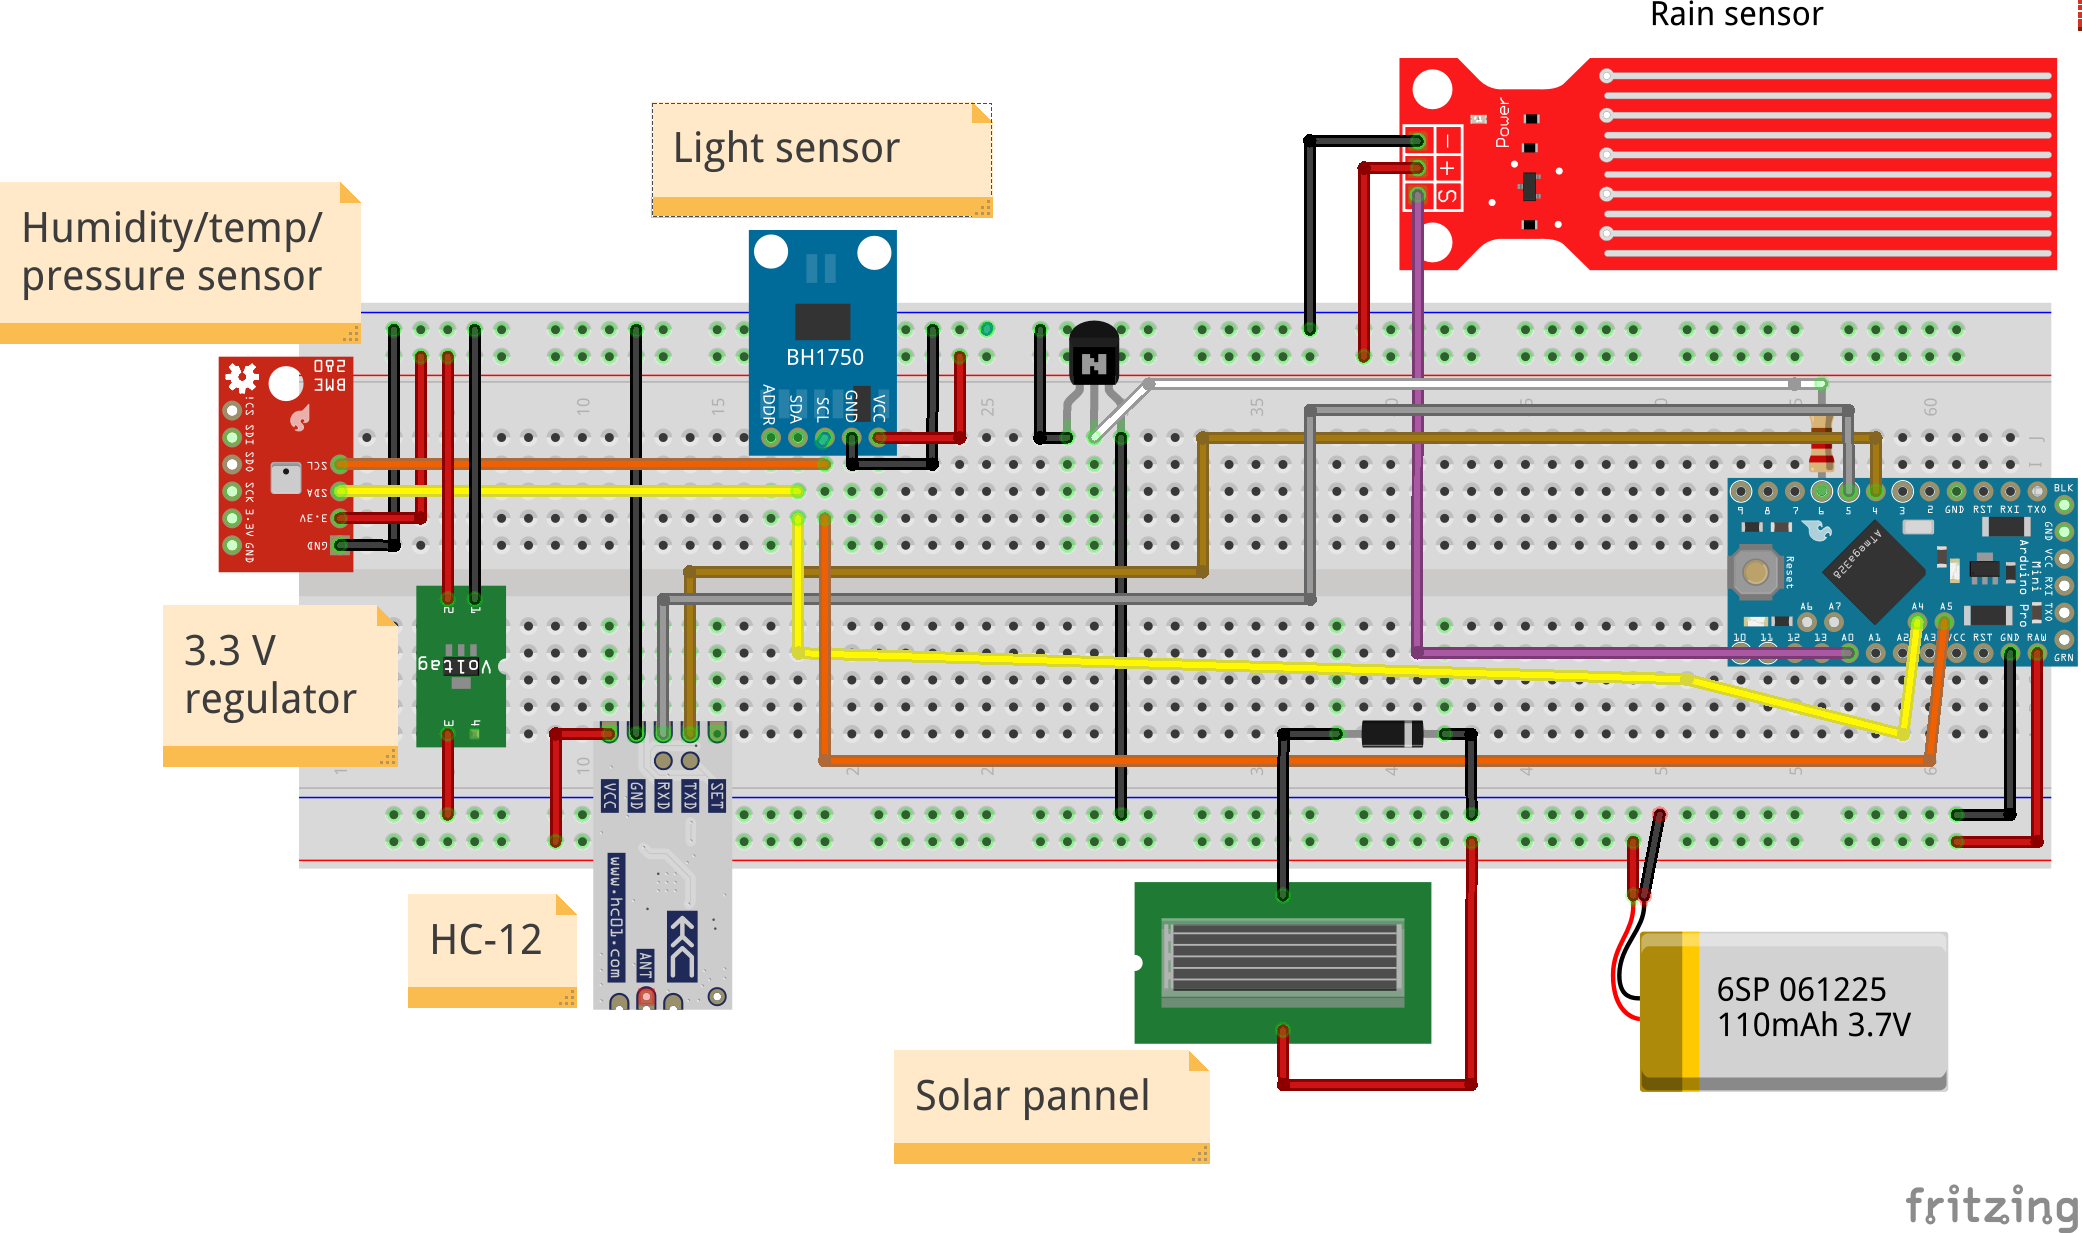
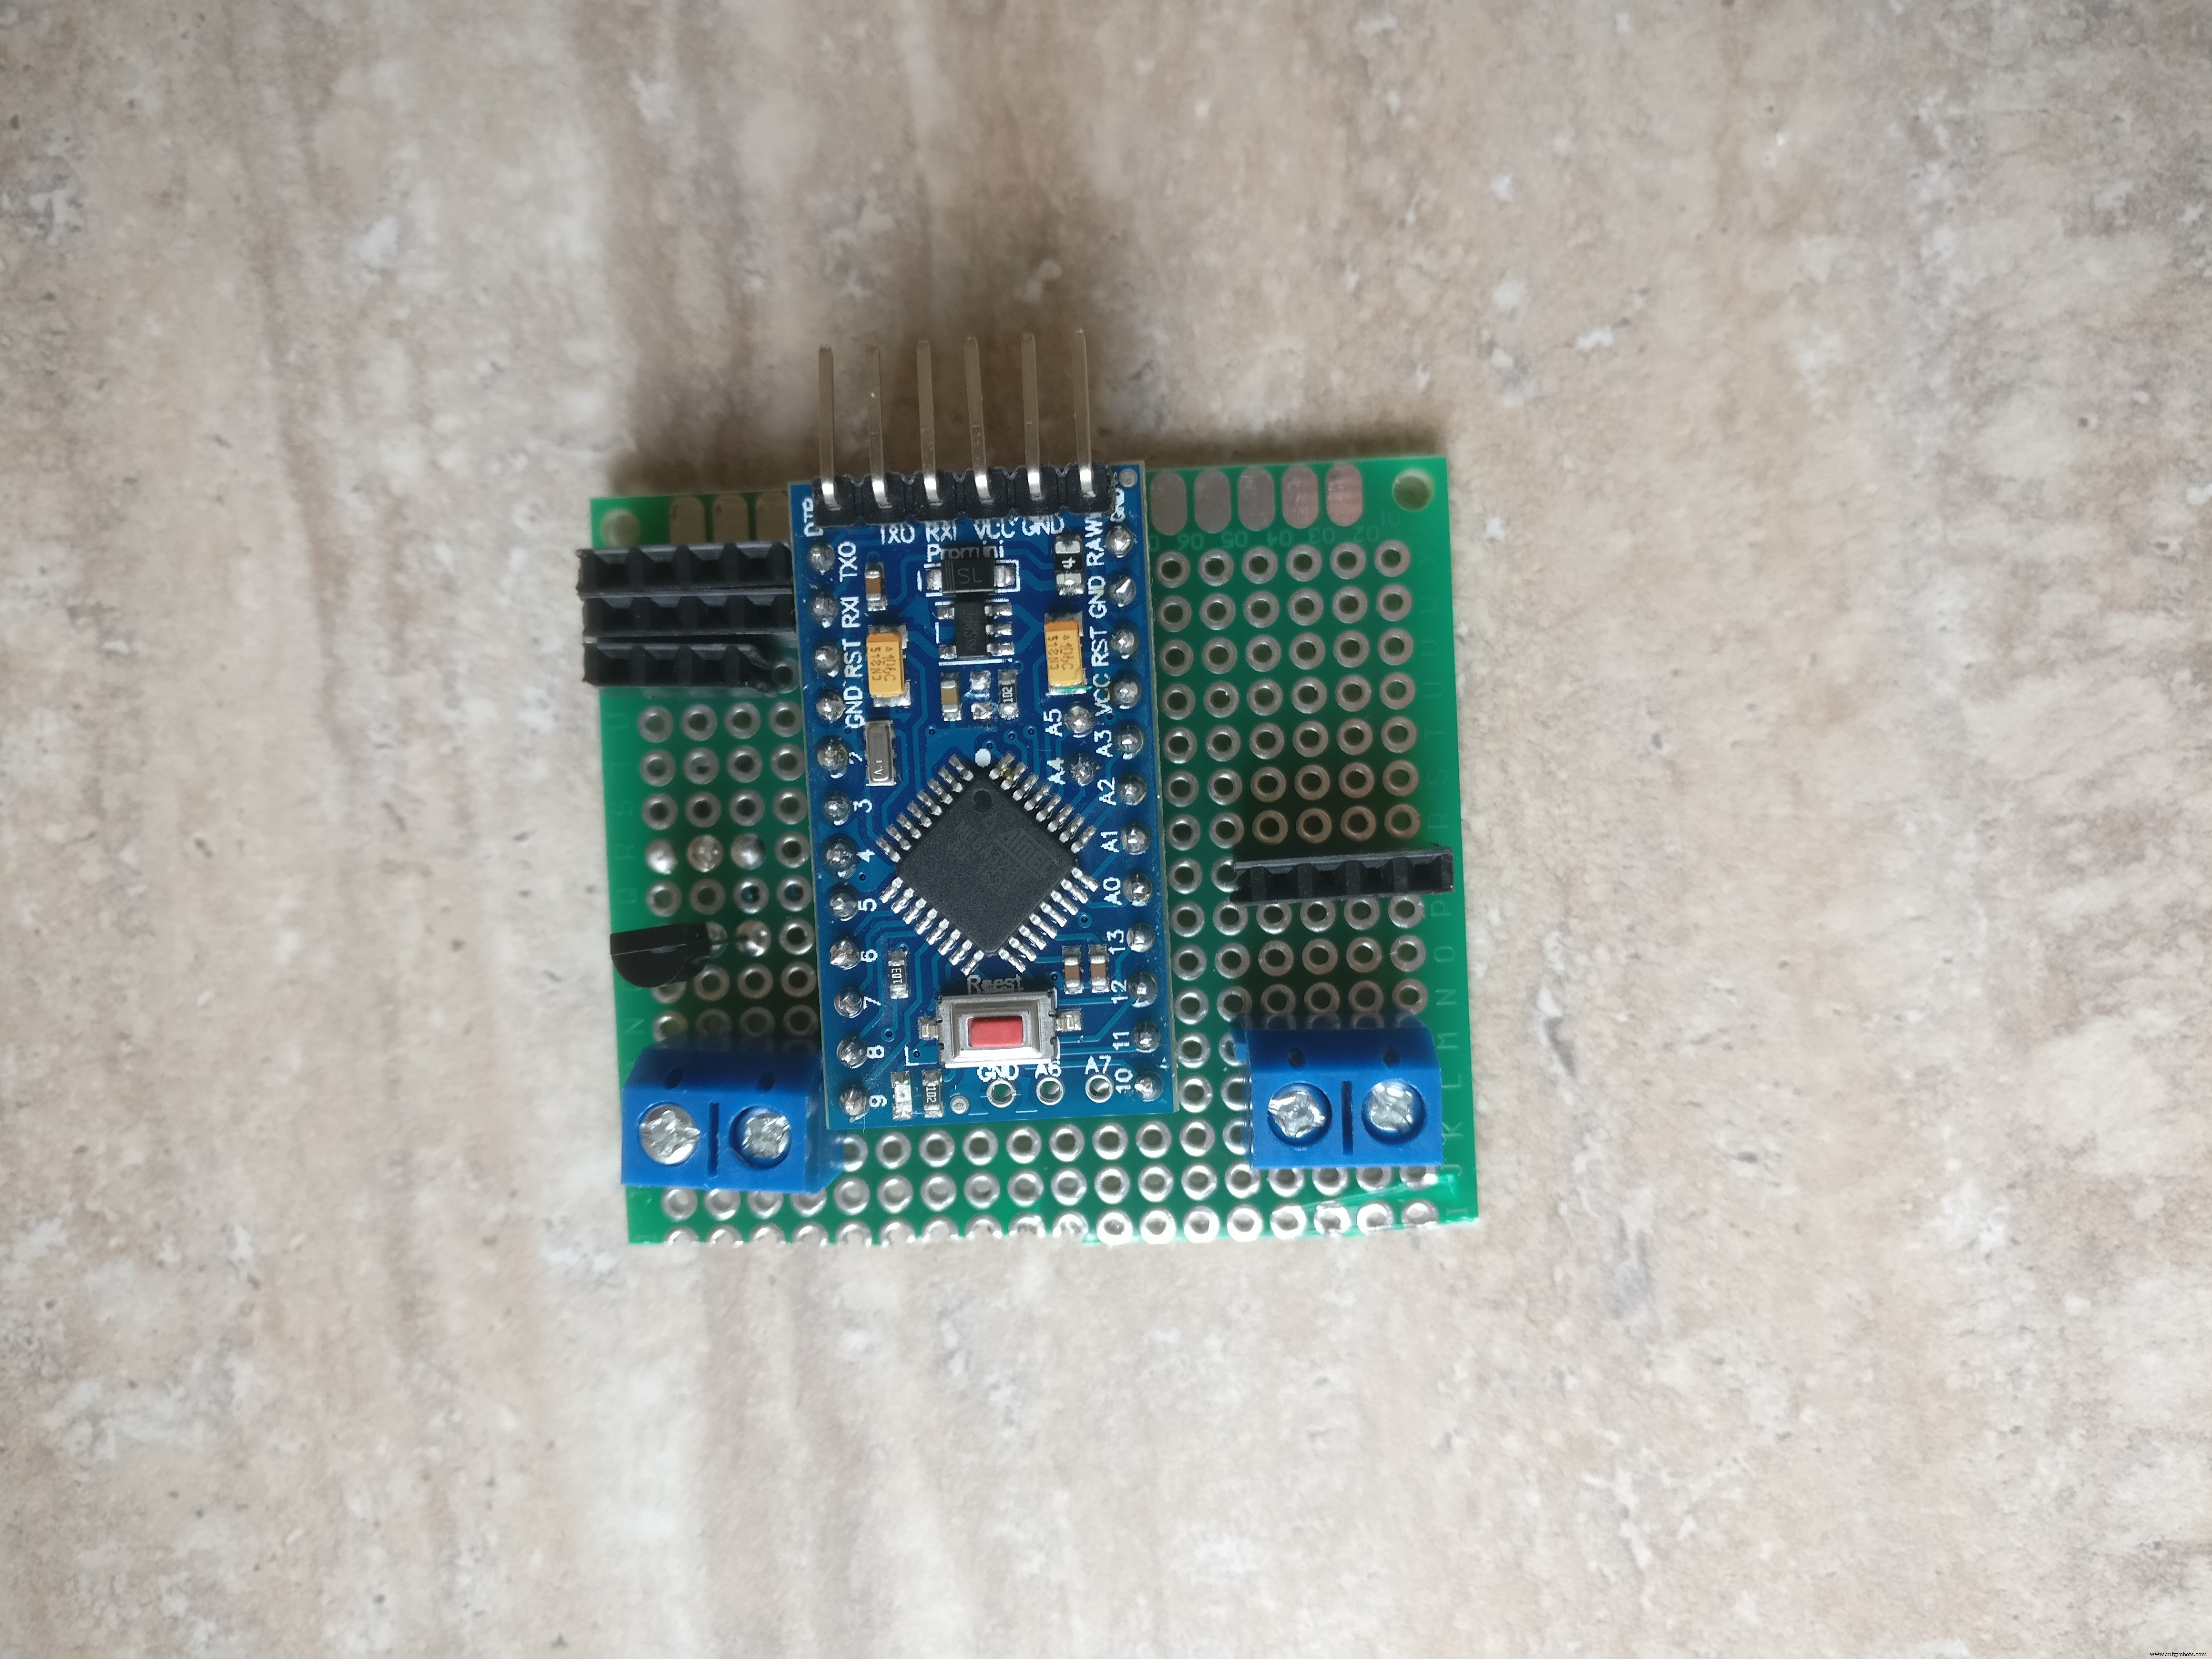
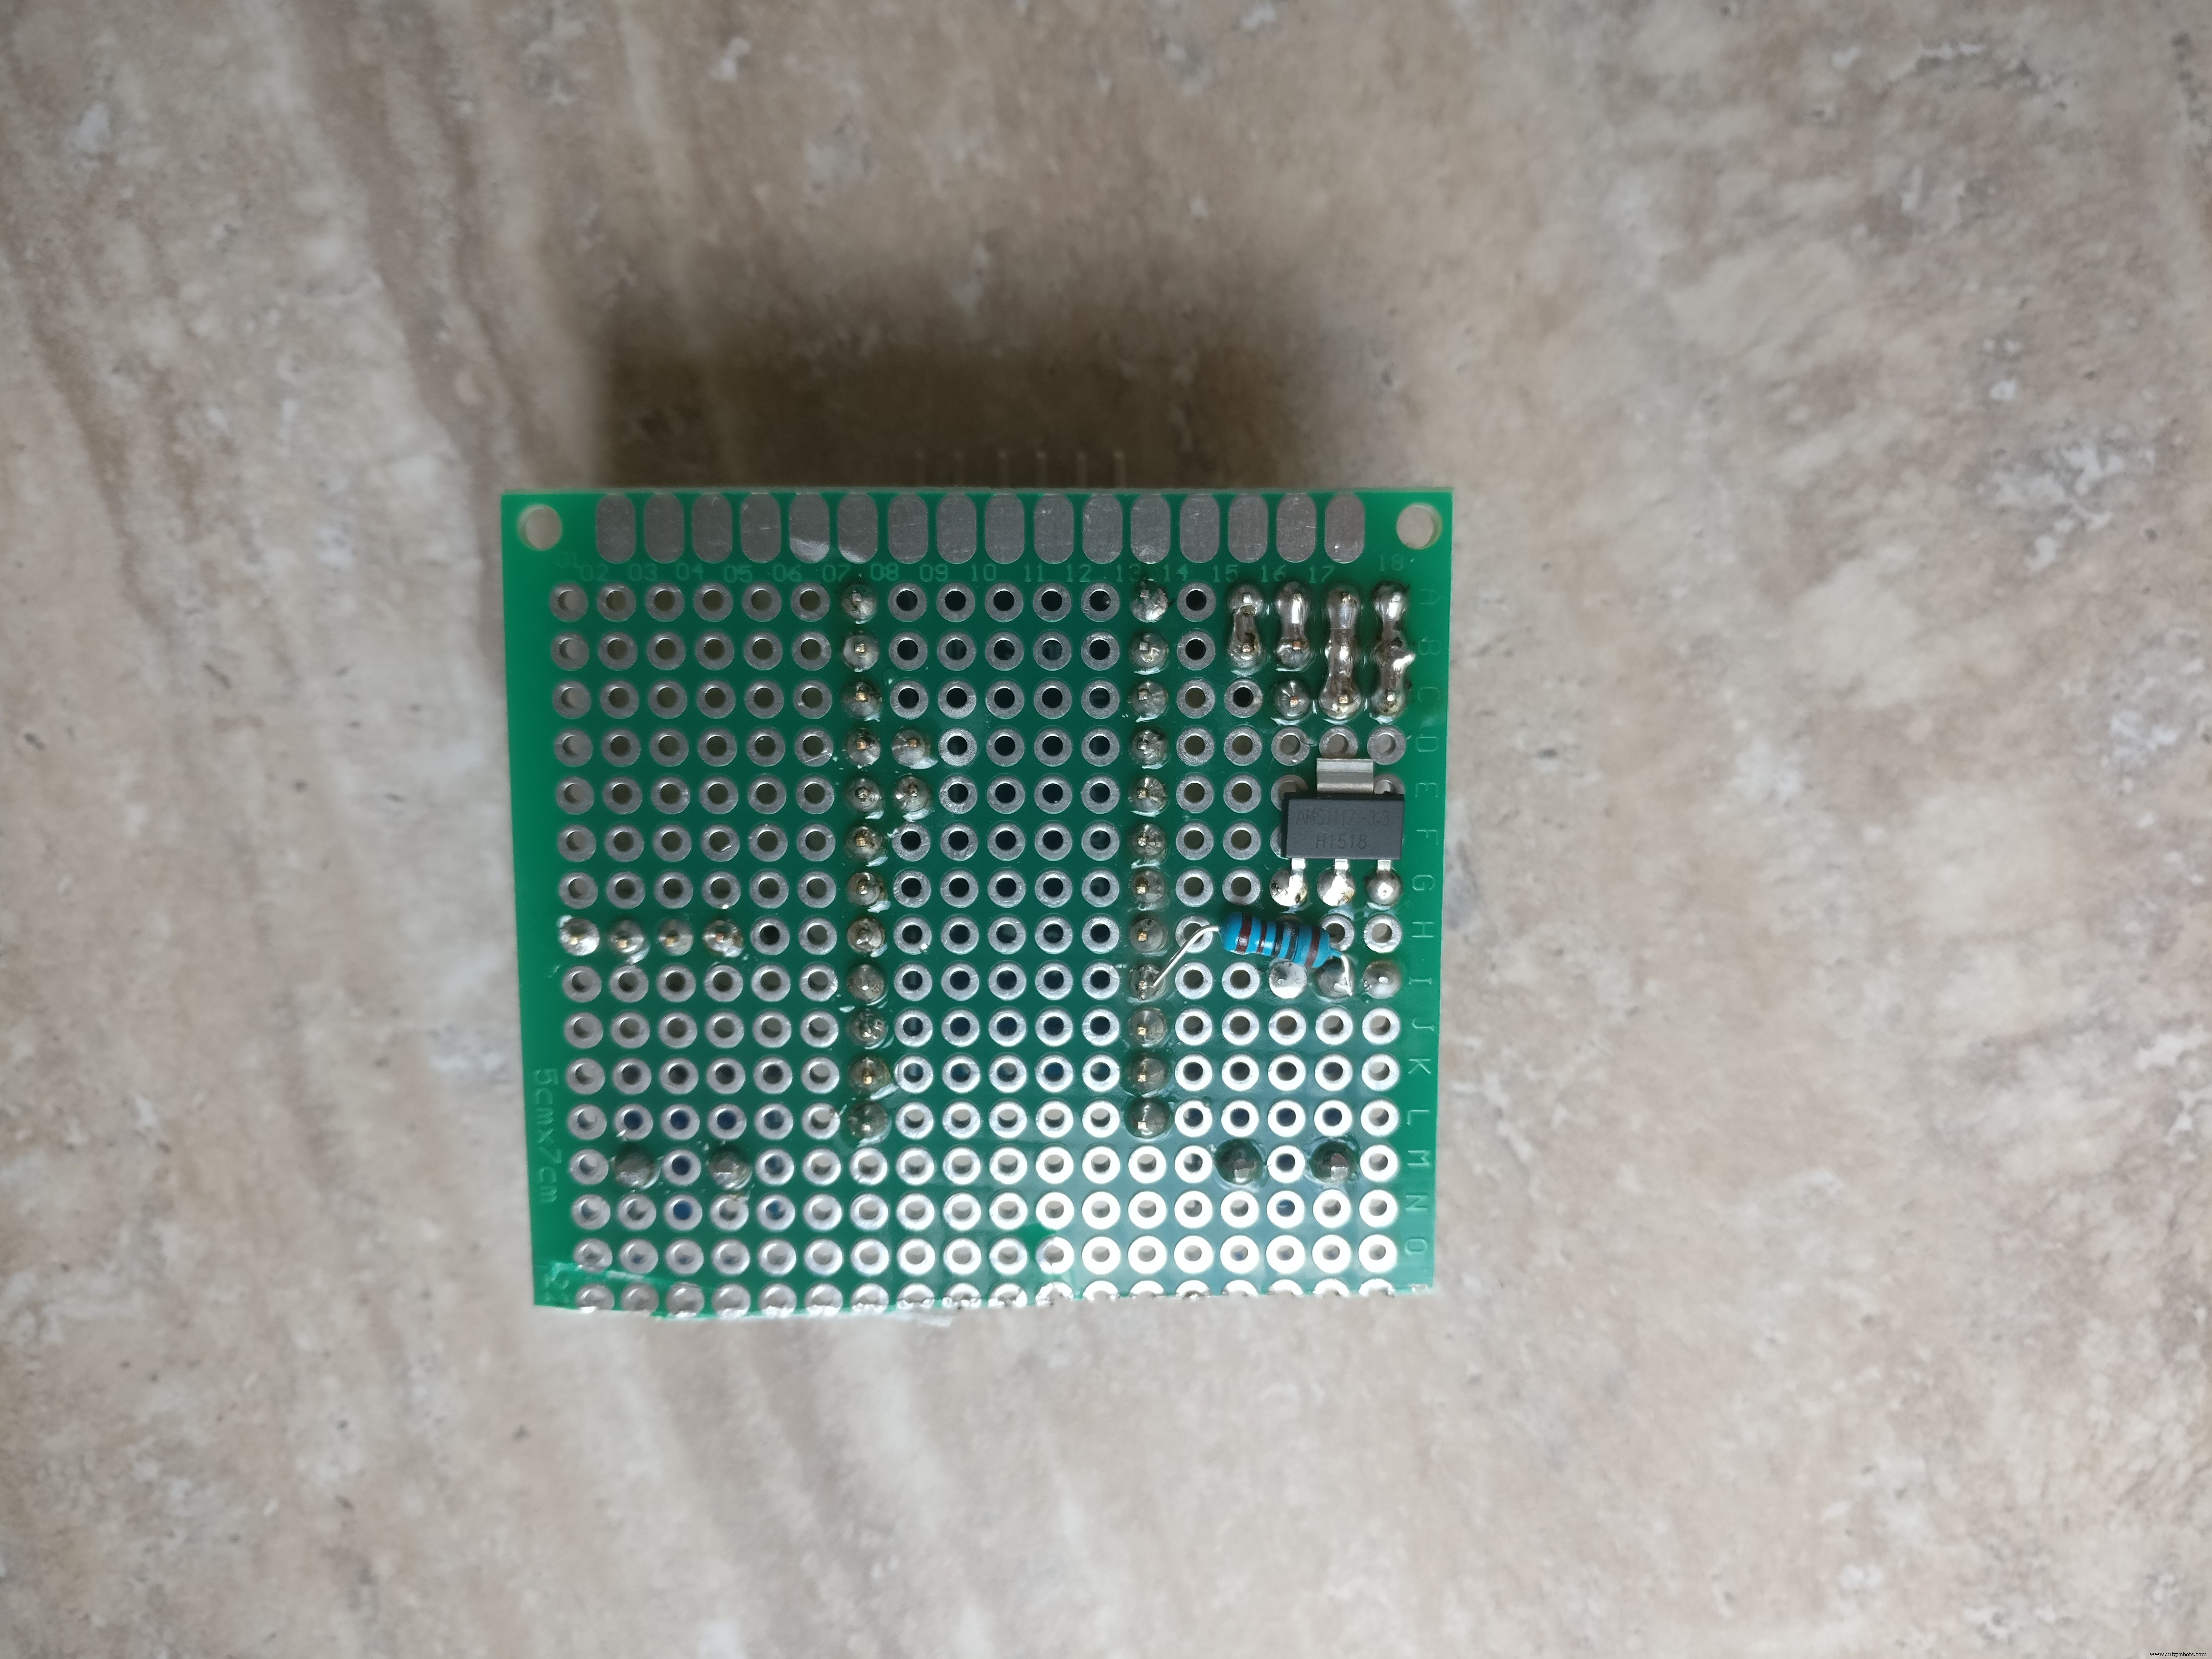
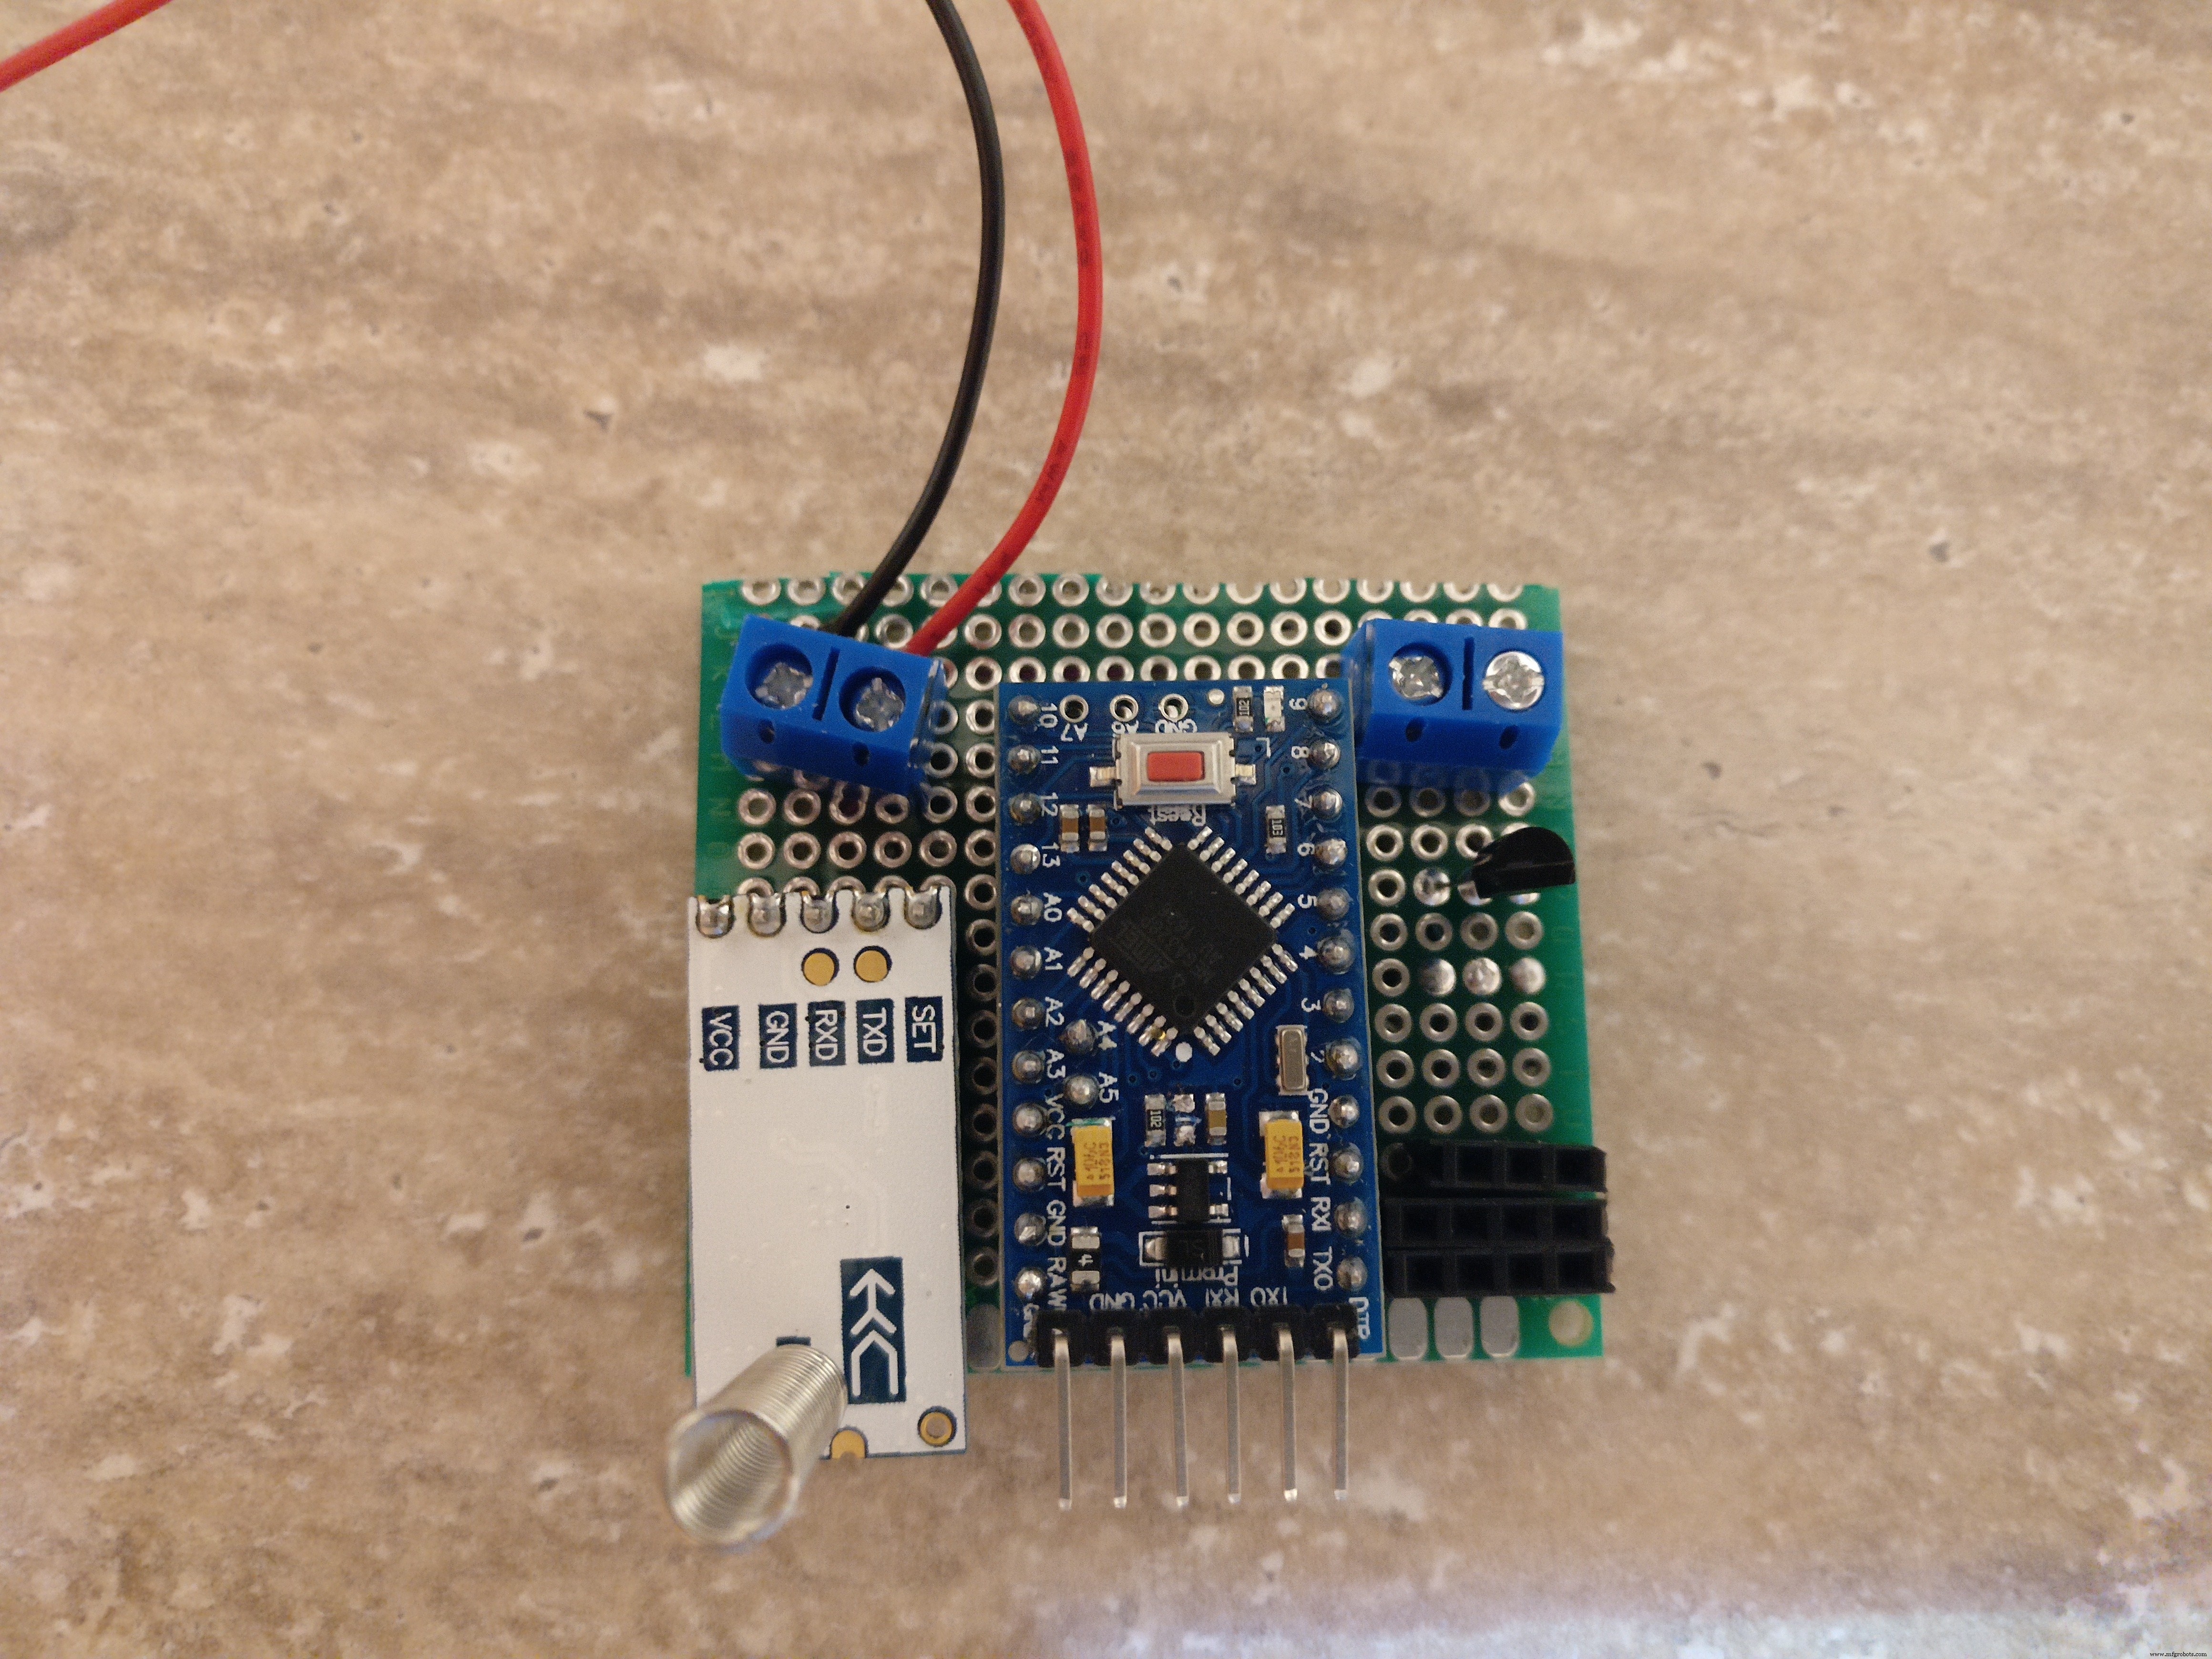
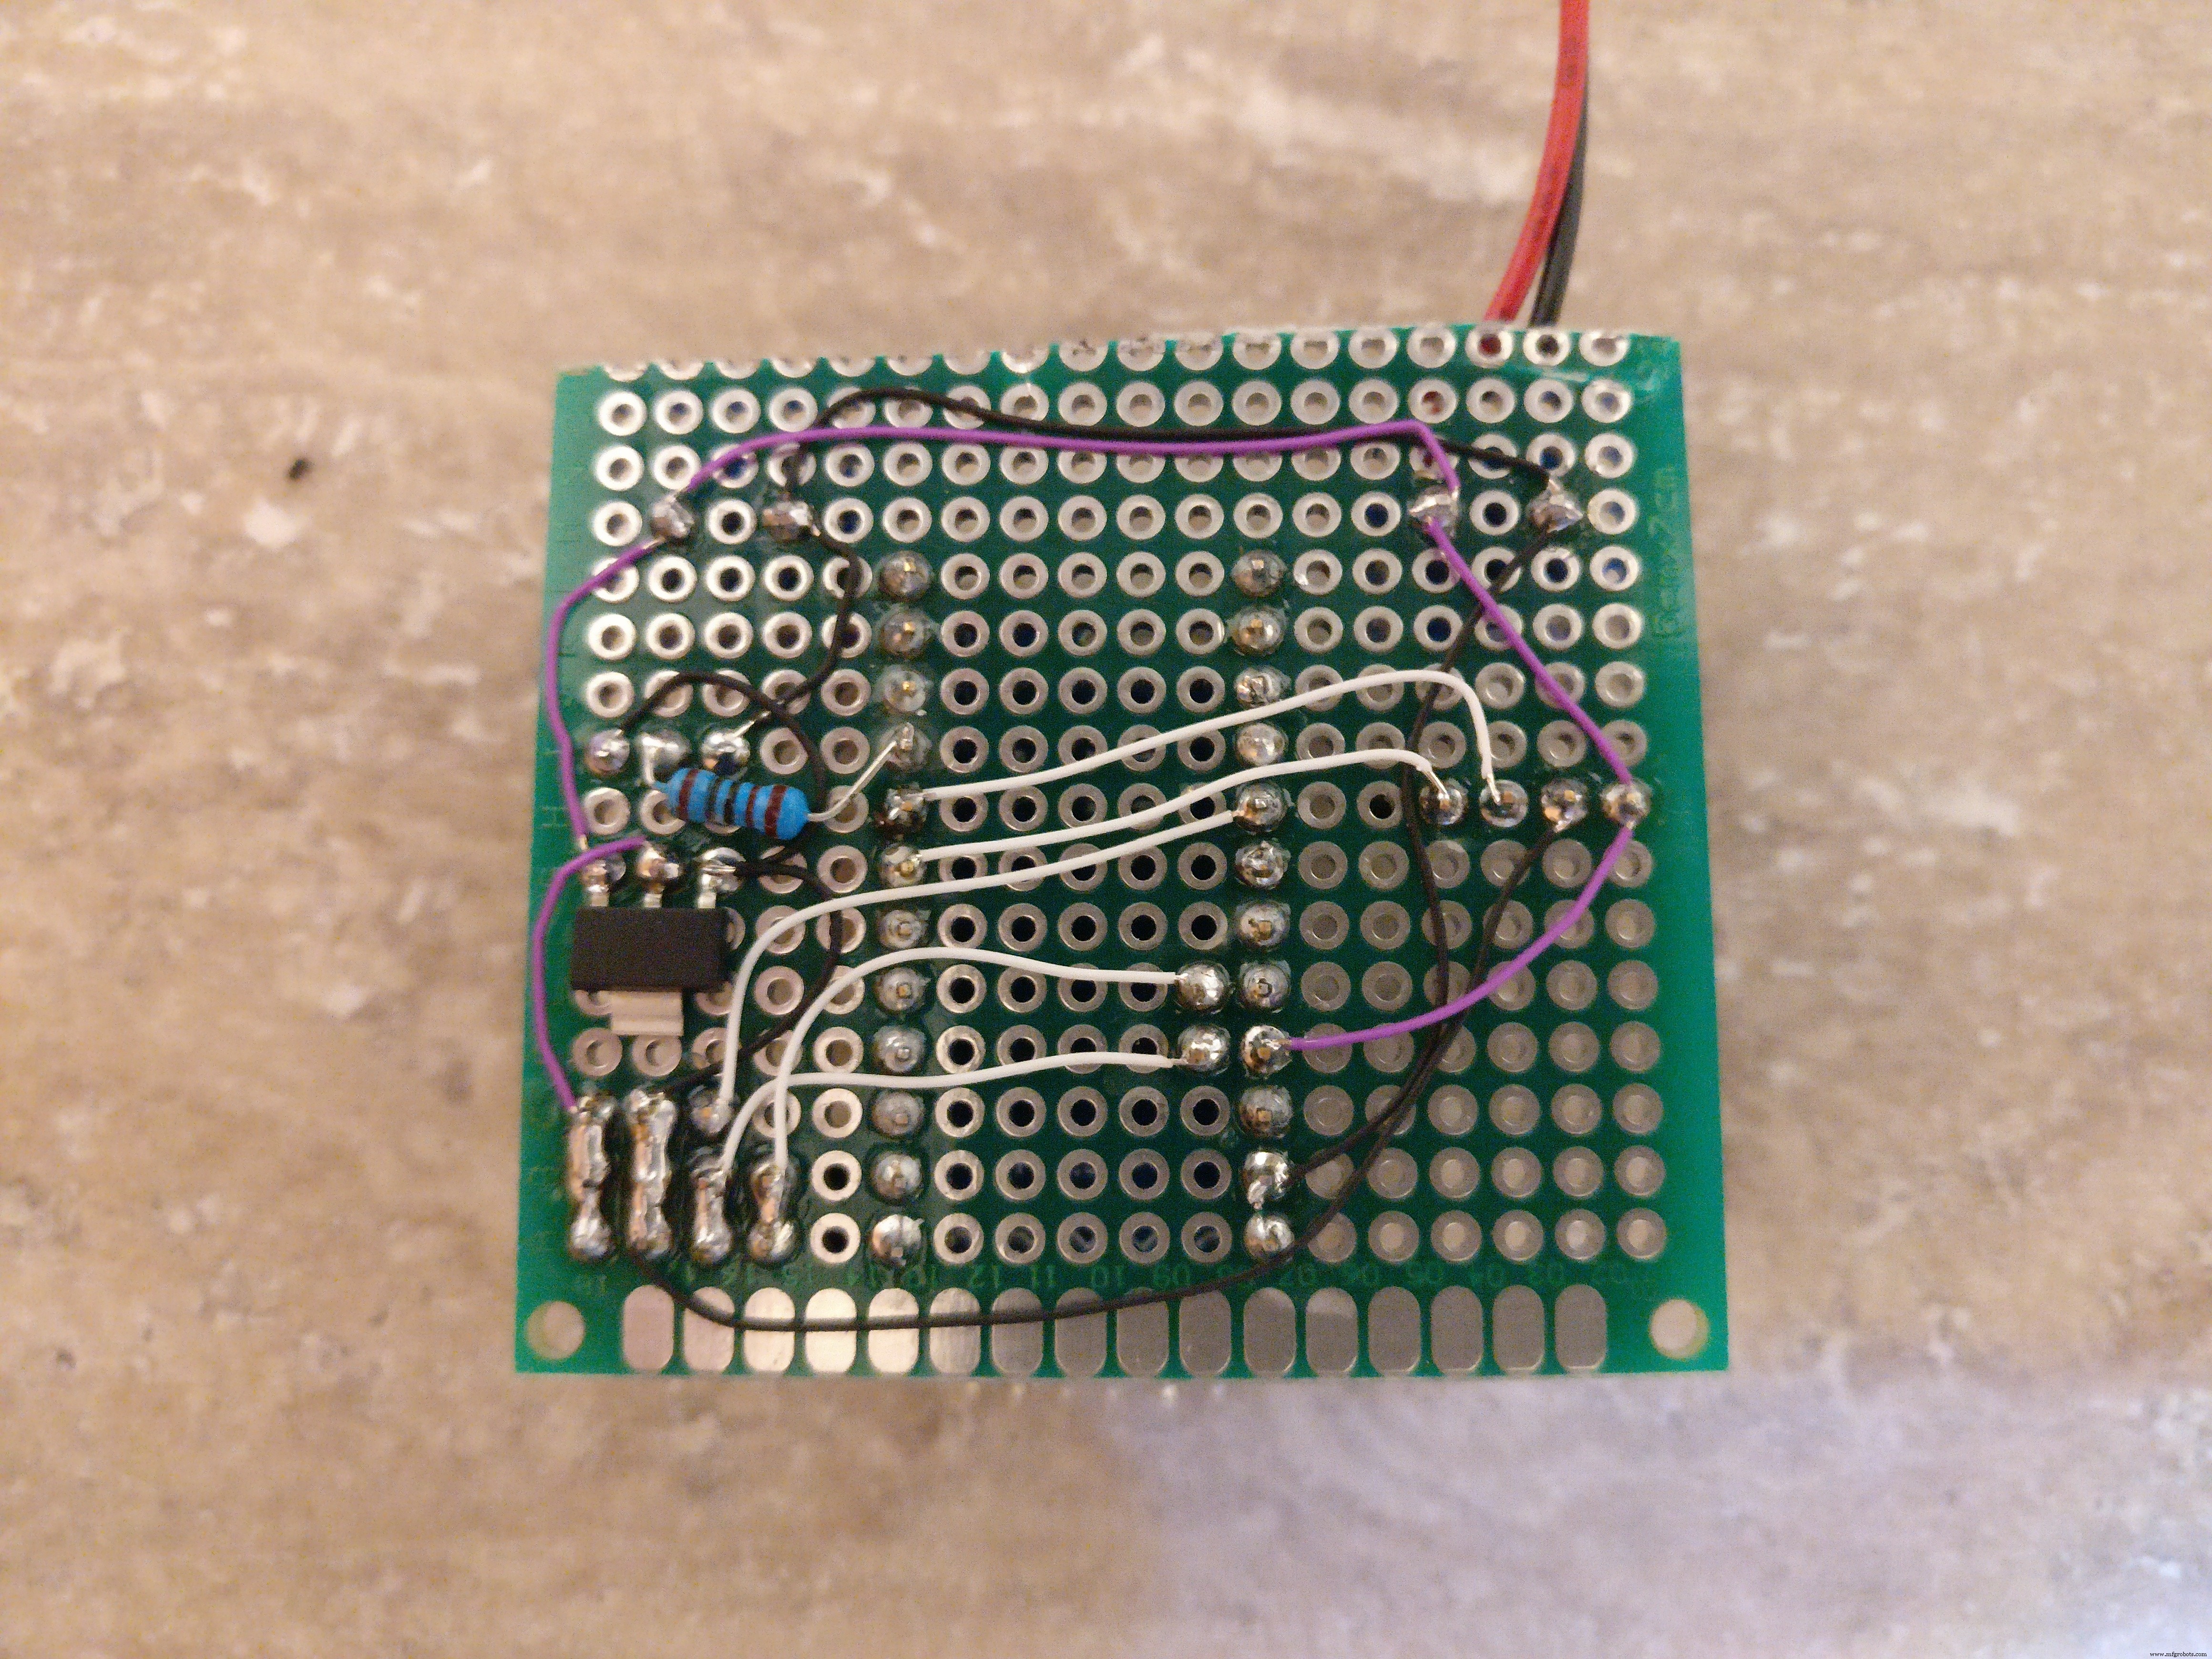
2. PCB는 arduino, HC-12, 3.3V 레귤레이터, 다이오드, 트랜지스터, 저항 및 2개의 KF301-2P
를 보유합니다. <울> 먼저 arduino용 PCB에 두 개의 암 PCB 커넥터를 납땜하고, 수 PCB 커넥터를 arduino에 납땜한 다음 arduino를 PCB에 배치합니다.
<울> arduino led를 제거하거나 핀 중 하나 이상을 제거해야 합니다. 이것은 매우 중요합니다. 왜냐하면 led는 많은 양의 전력을 끌어들일 것이기 때문입니다. 다른 구성 요소가 손상되지 않도록 주의하세요.
<울> 트랜지스터, 저항기, 3.3V 조정기 납땜
<울> KF301-2P 2개를 납땜합니다. 하나는 태양광 패널용이고 다른 하나는 배터리 홀더용입니다.
<울> 3개의 암 PCB 커넥터 납땜:광 센서, BME280 및 레인 센서용
<울> 모든 PCB 구성요소를 연결하기 위한 작은 와이어 납땜(그림과 프리징 샤마틱 확인)
3. 충전된 AAA NiMH 배터리 3개를 홀더 안에 넣고 상자 안에 넣고 전선을 KF301-2P 커넥터에 연결합니다.
4. 상자 외부의 BME280 및 광 센서를 해당 수 커넥터에 연결합니다.
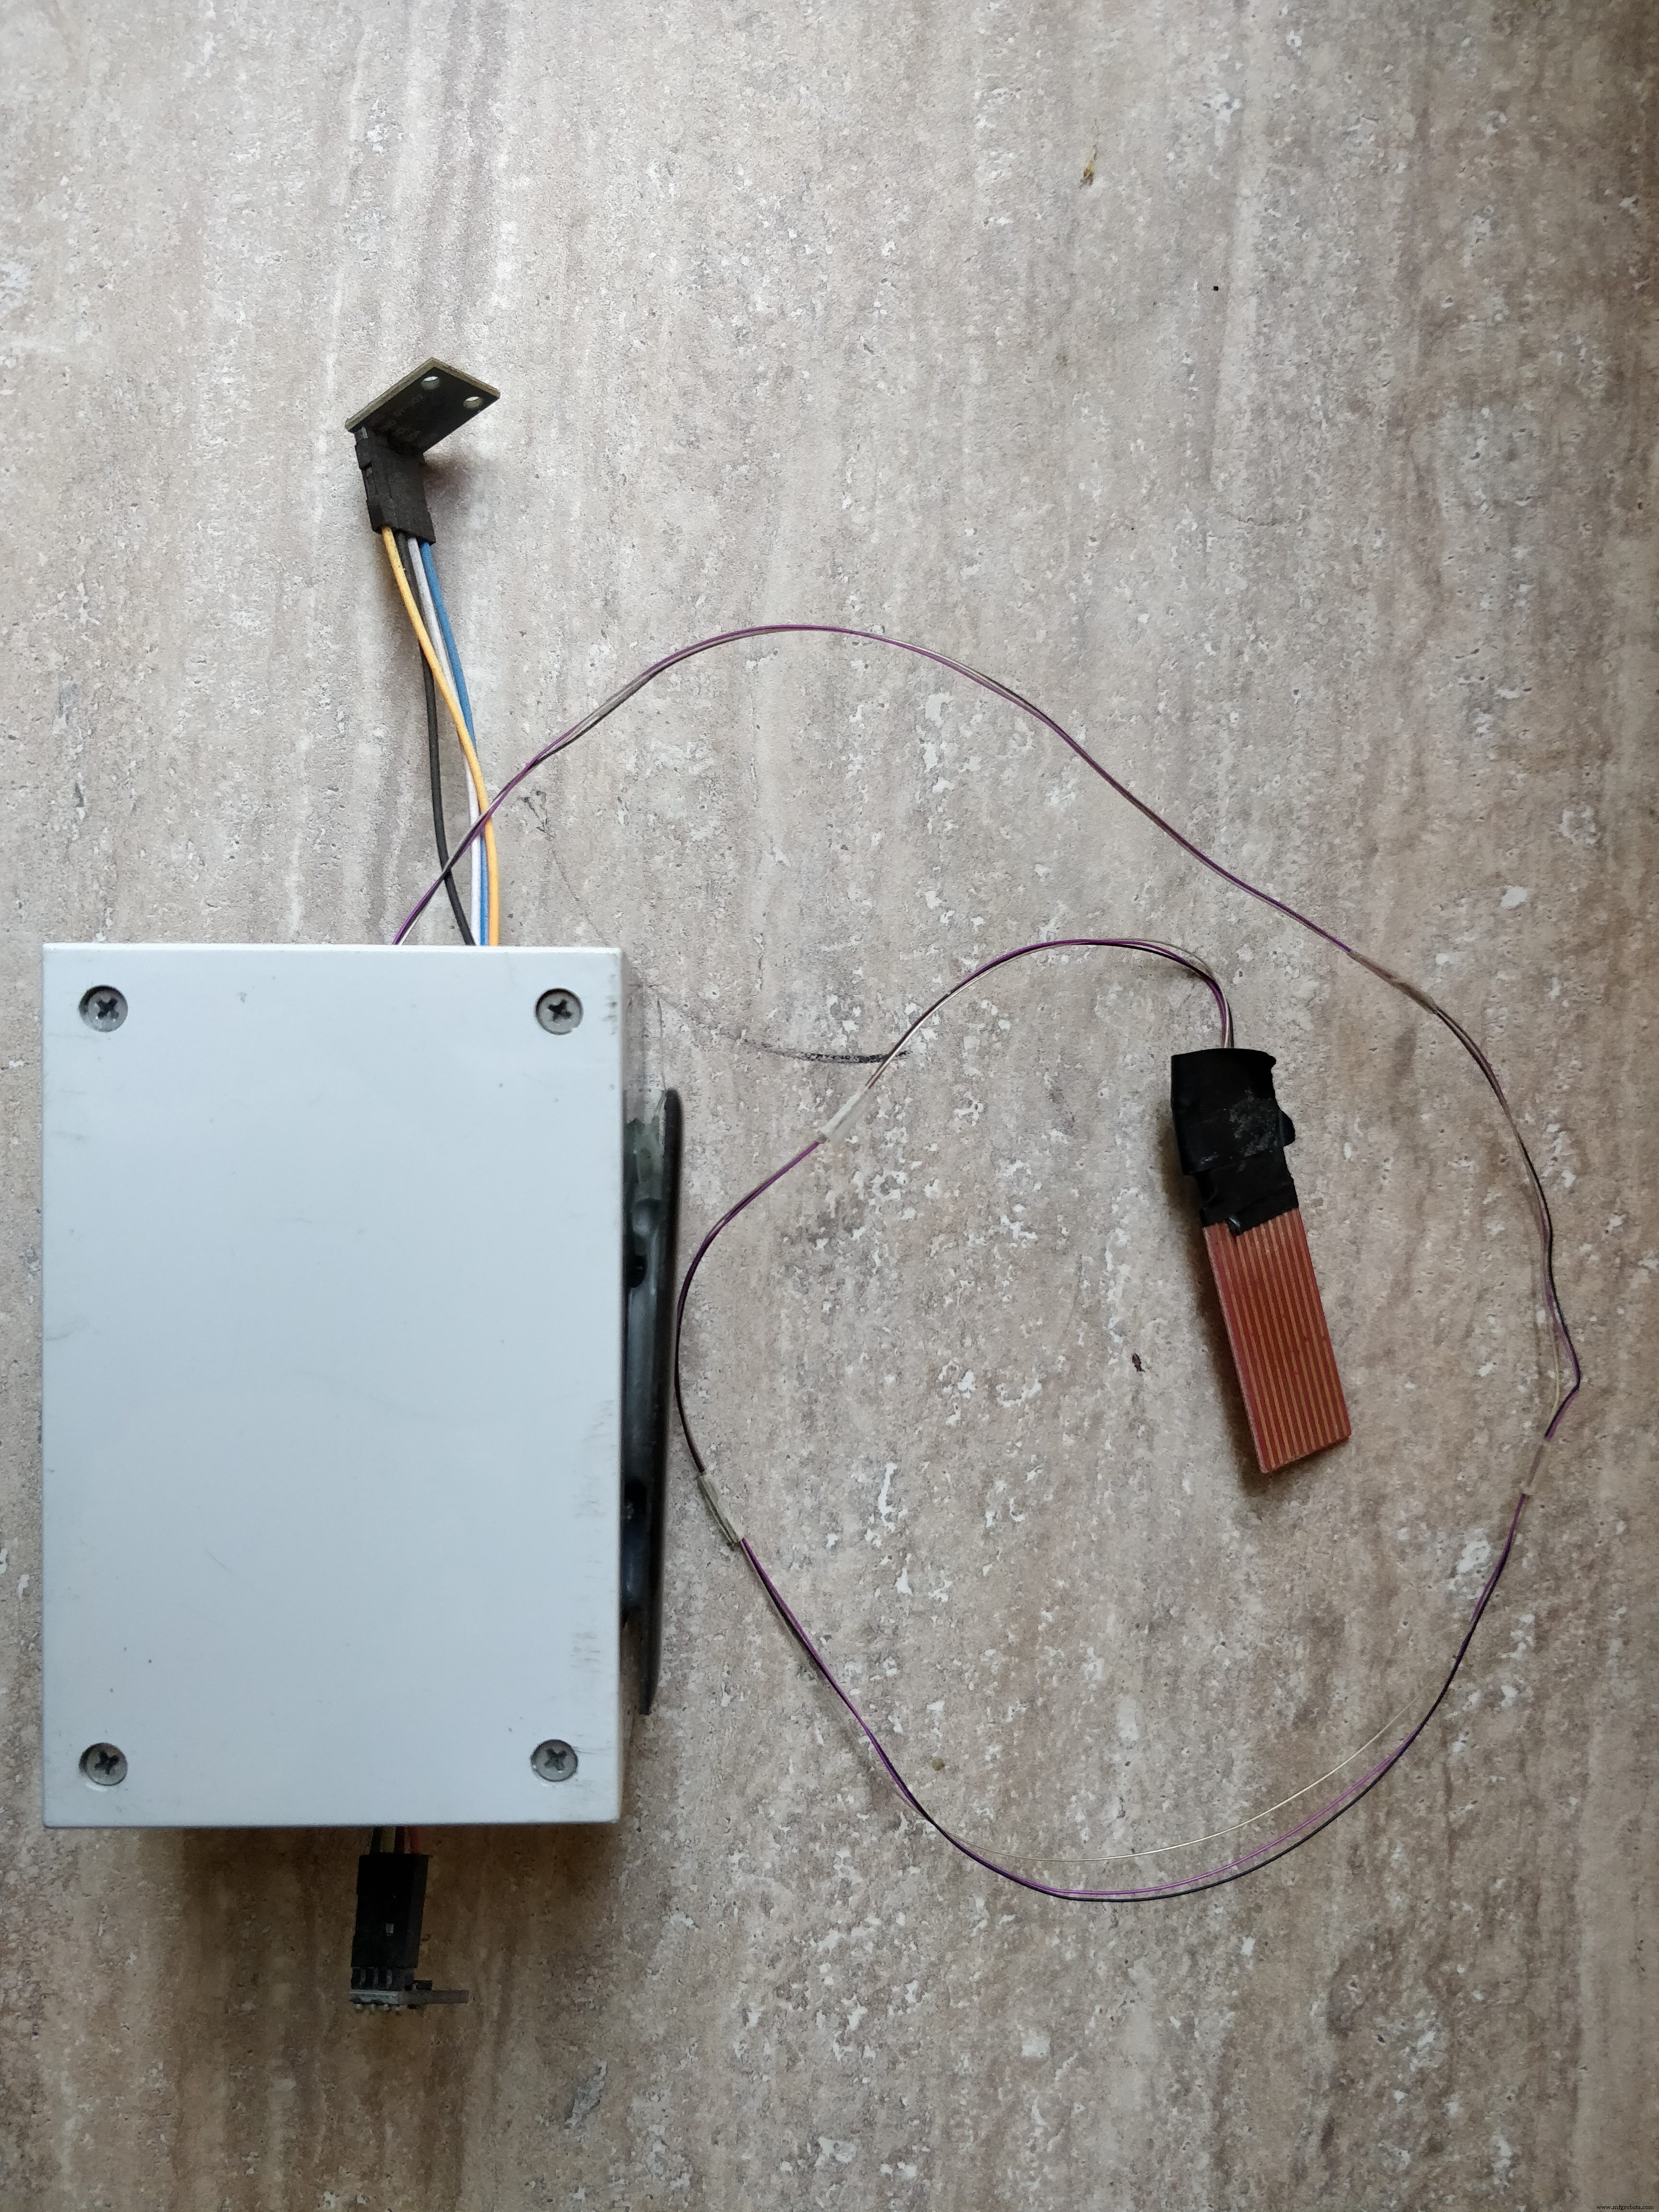
레인 센서의 경우 3개의 와이어(Gnd, Vcc, 신호)를 여기에 납땜하고 다른 쪽에는 상자 내부에 들어갈 수 핀을 해당 수 커넥터에 납땜합니다.
마지막으로 스테이션을 최종 위치에 배치하는 것입니다. 나는 비와 눈으로부터 보호되는 위치를 선택했습니다. 나는 레인 센서를 위해 더 긴 와이어를 선택하고 안정적인 지지대에 빗속에서 별도로 배치했습니다. 메인 박스의 경우 접착력이 있는 특별한 종류의 테이프를 선택했습니다(사진 확인). 하지만 박스를 고정하는 것은 무엇이든 할 수 있습니다.
스케치.fzz
3단계:Arduino 코드
이 단계에서는 어떤 외부 라이브러리가 필요한지 배우고 코드와 작동 방식을 살펴보고 물론 다운로드하거나 Arduino IDE에 복사하여 붙여넣고 기상 관측소에 업로드할 수 있습니다.
기상 관측소의 역할은 10분마다 기지국의 센서에 대한 데이터를 기지국으로 전송하는 것입니다.
먼저 기상 관측소 프로그램이 하는 일을 설명하겠습니다.
1. 센서 데이터 읽기(습도, 온도, 압력, 비, 빛, 전압)
2. 인코딩된 데이터를 두 번째 소프트웨어 직렬 라인을 통해 전송합니다.
인코딩된 데이터는 다음과 같습니다.
<사전><코드>H1:78|T1:12|PS1:1022|L1:500|R1:0|V1:4010|
위의 진술은 다음을 의미합니다:스테이션 "1"의 습도는 78%, 스테이션 1의 온도는 12도, 압력은 1022bar, 조도는 500lux, 비 0, 전압은 4010mV입니다.
3. 보조 구성 요소:센서 및 통신 장치의 전원 끄기
4. arduino를 10분 동안 절전 모드로 전환합니다(이렇게 하면 50마이크로암페어를 덜 소모함)
5. 구성 요소를 켜고 1 - 4단계를 반복합니다.
전압 레벨이 4.2V보다 높으면 arduino가 일반 절전 기능 "지연(밀리초)"을 사용합니다. 이것은 전력 소비를 크게 증가시키고 전압을 급격히 감소시킵니다. 이는 태양 전지판이 배터리를 과충전하는 것을 효과적으로 방지합니다.
여기 내 Github 저장소에서 코드를 얻을 수 있습니다:https://github.com/danionescu0/home-automation/tre...
또는 아래에서 복사하여 붙여넣습니다. 어느 쪽이든 "transmitSenzorData("V",Sensers.voltage);"가 있는 줄을 제거하기만 하면 됩니다.
#include "LowPower.h"
#include "SoftwareSerial.h#include "Wire.h#include "Adafruit_Sensor.h#include "Adafruit_BME280.h#include "BH1750.h "소프트웨어 직렬 직렬 통신(4, 5); // RX, TXAdafruit_BME280 bme; BH1750 lightMeter;const byte rainPin =A0;byte sensorCode =1;/** * 마이크로컨트롤러를 일반 절전 대신 깊은 절전 모드로 전환하는 전압 레벨 */int voltageDeepSleepThreshold =4200; const byte peripherialsPowerPin =6;char buffer[] ={' ',' ',' ',' ',' ',' ',' '};struct sensorData { 바이트 습도; int 온도; 바이트 비; 인트 압력; 긴 전압; 인트 라이트; };sensorData 센서; 무효 설정() { Serial.begin(9600); serialComm.begin(9600); pinMode(주변기기PowerPin, OUTPUT); digitalWrite(주변기기PowerPin, HIGH); 지연(500); if (!bme.begin()) { Serial.println("유효한 BME280 센서를 찾을 수 없습니다. 배선을 확인하십시오!"); 동안 (1) { customSleep(100); } } Serial.println("초기화가 성공적으로 완료되었습니다."); 지연(50); digitalWrite(peripherialsPowerPin, HIGH);} 무효 루프() { updateSensor(); 데이터 전송(); 커스텀슬립(75); } 무효 updateSensor() { bme.begin(); lightMeter.begin(); 지연(300); 센서.온도 =bme.readTemperature(); sensor.pressure =bme.readPressure() / 100.0F; sensor.humidity =bme.readHumidity(); sensor.light =lightMeter.readLightLevel(); 센서.전압 =readVcc(); sensor.rain =readRain();}무효 전송 데이터(){ emptyIncommingSerialBuffer(); Serial.print("온도:");Serial.println(센서.온도); Serial.print("습도:");Serial.println(sensors.humidity); Serial.print("압력:");Serial.println(sensors.pressure); Serial.print("빛:");Serial.println(sensors.light); Serial.print("전압:");Serial.println(sensors.voltage); Serial.print("비:");Serial.println(sensors.rain); transmissionSensorData("T", 센서.온도); transmissionSensorData("H", sensor.humidity); transmissionSensorData("PS", sensor.pressure); transmissionSensorData("L", sensor.light); transmissionSensorData("V", 센서.전압); transmissionSensorData("R", sensor.rain);}void emptyIncommingSerialBuffer(){ while (serialComm.available()> 0) { serialComm.read(); 지연(5); }}무효 transmissionSensorData(문자열 유형, 정수 값){ serialComm.print(유형); serialComm.print(센서 코드); serialComm.print(":"); serialComm.print(값); serialComm.print("|"); delay(50);} 무효 customSleep(long eightSecondCycles){ if (sensors.voltage> voltageDeepSleepThreshold) { delay(eightSecondCycles * 8000); 반품; } digitalWrite(주변기기PowerPin, LOW); for (int i =0; i
코드를 업로드하기 전에 다음 arduino 라이브러리를 다운로드하여 설치하세요.
* BH1750 라이브러리:https://github.com/claws/BH1750 * LowPower 라이브러리:https://github.com/rocketscream/Low-Power
* Adafruit 센서 라이브러리:https://github.com/adafruit/Adafruit_Sensor
* Adafruit BME280 라이브러리:https://github.com/adafruit/Adafruit_Sensor
어떻게 하는지 모르겠다면 이 튜토리얼을 확인하세요.
4단계:베이스 스테이션 준비
베이스 스테이션은 Linux 컴퓨터로 구성됩니다. (데스크톱, 노트북 또는 개발 보드) HC-12 USB 모듈이 부착되었습니다. 스테이션에서 10분마다 데이터를 수집하려면 컴퓨터가 항상 켜져 있어야 합니다.
노트북을 Ubuntu 18과 함께 사용했습니다.
설치 단계:
1. 아나콘다를 설치합니다. Anaconda는 Python 패키지 관리자이며 동일한 종속성으로 작업하기가 쉽습니다. Python 버전과 각 패키지 버전을 제어할 수 있습니다.
설치 방법을 모르는 경우 https://www.digitalocean.com/community/tutorials/h... 자습서를 확인하고 1 - 8단계를 따르세요.
2. mongoDB를 설치합니다. MongoDb는 이 프로젝트의 주요 데이터베이스가 될 것입니다. 모든 센서 시계열에 대한 데이터를 저장합니다. 스키마가 없으며 우리의 목적을 위해 사용하기 쉽습니다.
설치 단계는 해당 페이지를 확인하십시오:https://docs.mongodb.com/v3.4/tutorial/install-mon...
저는 이전 버전의 mongoDb 3.4.6을 사용했습니다. 위의 자습서를 따르면 정확히 알 수 있습니다. 원칙적으로 최신 버전에서 작동해야 합니다.
[선택 사항] 날짜 필드에 색인 추가:
몽구스 날씨 db.weather_station.createIndex({"date" :1})
3. https://github.com/danionescu0/home-automation에서 프로젝트를 다운로드하십시오. 우리는 weather-predict 폴더를 사용할 것입니다
sudo apt-get install gitgit clone https://github.com/danionescu0/home-automation.gi...
4. 아나콘다 환경 생성 및 구성:
cd weather-predict # python 3.6.2conda create --name weather python=3.6.2 # activate environmentconda activate weather# 모든 패키지 설치 pip install -r Requirements.txt
그러면 새 환경이 생성되고 필요한 패키지가 설치됩니다. 일부 패키지는 다음과 같습니다.
Keras(고수준 신경망 계층, 이 라이브러리를 사용하여 모든 신경망 예측을 수행함)
pandas (데이터를 조작하는 유용한 도구, 우리는 그것을 많이 사용할 것입니다)
pymongo(파이썬 mongoDb 드라이버)
sklearn(데이터 마이닝 및 데이터 분석 도구)
프로젝트 구성
구성 파일은 weather-predict 폴더에 있으며 이름은 config.py
입니다.
1. MongoDb를 원격으로 설치하거나 다른 포트에 설치하는 경우
에서 "호스트" 또는 "포트"를 변경합니다. mongodb ={ '호스트':'localhost', '포트':27017}...
2. 이제 HC-12 USB 직렬 어댑터를 연결해야 합니다. 실행 전:
ls -l /dev/tty*
마운트된 장치 목록이 표시됩니다.
이제 HC-12를 USB 포트에 삽입하고 동일한 명령을 다시 실행합니다. 이 목록에 직렬 어댑터가 하나 새로 추가되어야 합니다. 이제 필요한 경우 구성에서 어댑터 포트를 변경하십시오.
직렬 ={ '포트':'/dev/ttyUSB0', '전송 속도':9600}
다른 구성 항목은 일부 파일 기본 경로이므로 변경할 필요가 없습니다.
5단계:실제 기상 관측소 사용 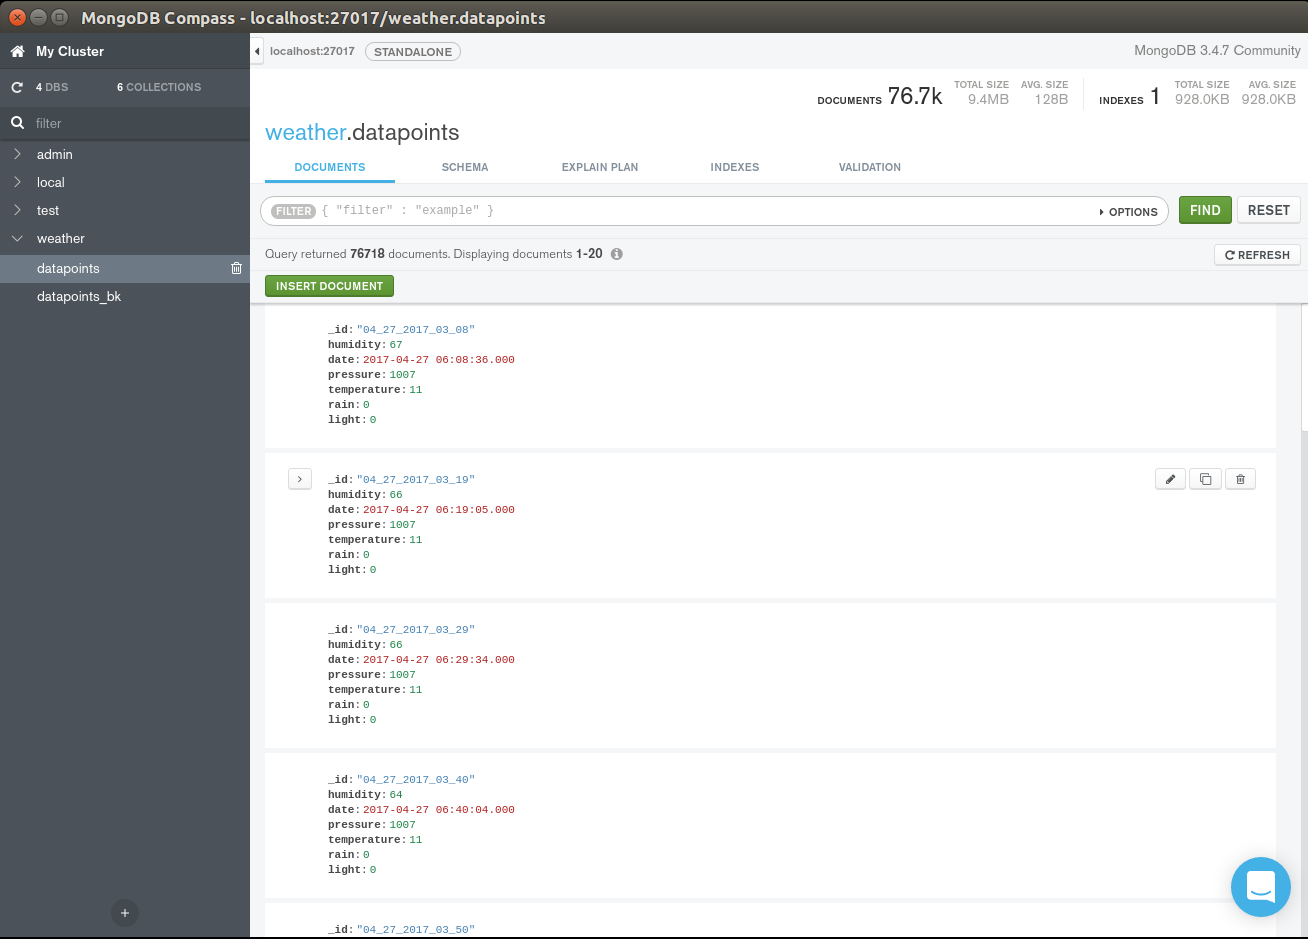
여기에서는 테스트 데이터 가져오기, 테스트 실행, 데이터 설정, 그래프 표시, 앞으로 몇 시간 동안의 예측이 포함된 이메일 설정에 대한 기본 사항에 대해 설명합니다.
작동 방식에 대해 자세히 알고 싶다면 "작동 방식" 다음 단계를 확인하세요.
이미 수집된 데이터 가져오기
MongoDb는 json에서 데이터를 가져오기 위한 cli 명령과 함께 제공됩니다.
mongoimport -d weather -c weather_station --file sample_data/weather_station.json
샘플 데이터에서 "날씨" 데이터베이스 및 "데이터 포인트" 컬렉션으로 파일을 가져옵니다.
경고 여기에서 내가 수집한 데이터를 사용하고 새로운 로컬 데이터와 결합하면 하드웨어(센서)와 로컬 날씨 패턴의 작은 차이로 인해 정확도가 떨어질 수 있습니다.
새 데이터 수집
기지국 역할 중 하나는 기상 관측소에서 들어오는 데이터를 나중에 처리하기 위해 데이터베이스에 저장하는 것입니다. 직렬 포트를 수신하고 데이터베이스에 저장하는 프로세스를 시작하려면 다음을 실행하십시오.
conda activate weatherpython serial_listener.py# 매 10분마다 다음과 같이 기상 관측소의 데이터가 표시되어야 합니다. 1056.0)]...
예측 모델 생성
내 데이터를 가져오거나 "몇 년 동안 스크립트를 실행"하여 개인화된 데이터를 수집했다고 가정하므로 이 단계에서는 데이터를 처리하여 미래의 비를 예측하는 데 사용되는 모델을 생성합니다.
conda는 weatherpython train.py --days_behind 600 --test-file-percent 10 --datapoints-behind 8 --hour-granularity 6을 활성화합니다.
* 첫 번째 매개변수 --days_behind는 스크립트가 처리해야 하는 과거 데이터의 양을 의미합니다. 일 단위로 측정됩니다.
* --test-file-percent는 테스트 목적으로 고려해야 하는 데이터의 양을 의미하며, 이는 머신 러닝 알고리즘의 일반적인 단계입니다.
* --hour-granularity는 기본적으로 앞으로 몇 시간 동안 예측할 것인지를 의미합니다.
* --datapoints-behind 이 매개변수는 다음 섹션에서 자세히 설명합니다.
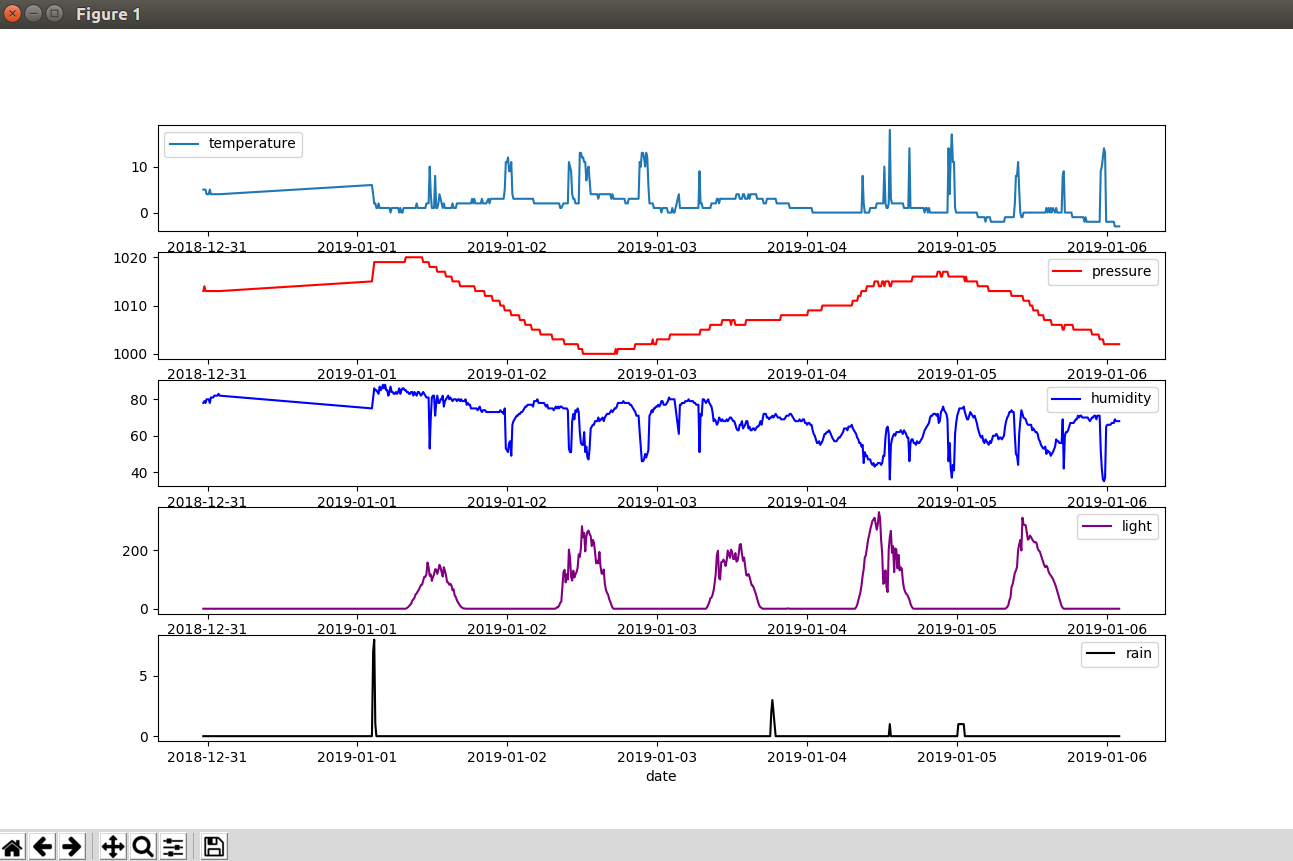
모든 기상 관측소 센서가 포함된 일부 데이터 차트 보기
지난 10일 동안:
conda는 날씨 파이썬 그래프를 활성화합니다 --days-behind 10
다음 기간에 비가 올지 예측
비가 올 것인지 예측하고 알림 이메일을 보내드립니다.
conda는 날씨 파이썬 predict.py --datapoints-behind 8 --hour-granularity 6 --from-addr a_gmail_address --from-password gmail_password --to-addr a_email_destination를 활성화합니다.
테스트 데이터에 대한 일괄 예측 실행:
python predict_batch.py -f sample_data/test_data.csv
위의 기차 스크립트에서와 동일한 매개변수를 사용하는 것이 중요합니다.
이메일 알림이 작동하려면 Gmail 계정에 로그인하고 덜 안전한 앱 허용을 켜십시오. 이렇게 하면 다른 사람이 귀하의 계정에 더 쉽게 액세스할 수 있습니다.
두 개의 이메일 주소, 즉 위 옵션이 활성화된 Gmail 주소와 알림을 받을 다른 주소가 필요합니다.
매시간 알림을 받고 싶다면 crontab에 스크립트를 넣으세요.
이 모든 것이 어떻게 가능한지 보려면 다음 단계를 확인하십시오.
6단계:작동 원리
이 마지막 단계에서는 이 프로젝트 아키텍처의 여러 측면에 대해 논의합니다.
1. 프로젝트 개요, 관련된 일반적인 아키텍처 및 기술에 대해 논의합니다.
2. 기계 학습의 기본 개념
3. 데이터 준비 방법(가장 중요한 단계)
4. 실제 신경망 래퍼 API 작동 방식(Keras)
5. 향후 개선 사항
여기에 몇 가지 코드 예제를 제공하려고 하지만 프로젝트의 100% 코드가 아님을 명심하십시오. 프로젝트에서는 자체 코드이며 클래스와 구조로 인해 조금 더 복잡합니다.
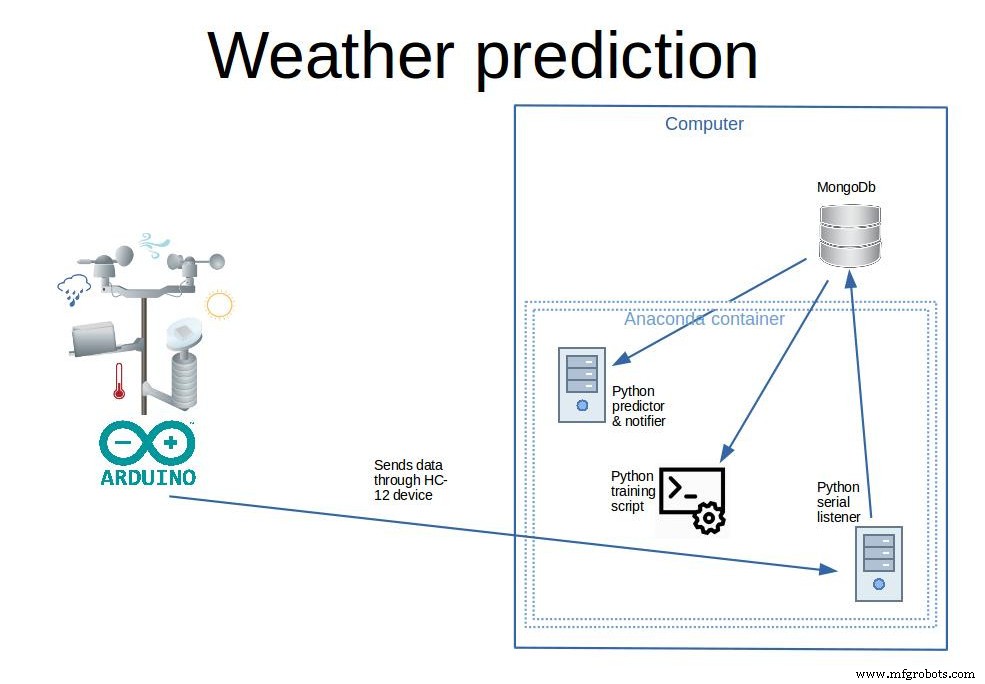
1. 프로젝트 개요, 관련된 일반적인 아키텍처 및 기술에 대해 논의합니다.
앞서 말했듯이 프로젝트에는 두 개의 개별 부분이 있습니다. 기상 관측소는 데이터를 수집하고 전송하는 유일한 기능을 자체적으로 수행합니다. 그리고 모든 수집 훈련과 예측이 일어날 기지국입니다.
분리의 장점 기상 관측소 및 기지국:
<울> 전력 요구 사항, 기상 관측소가 데이터도 처리할 수 있다면 상당한 전력(대형 태양 전지판 또는 영구 전원)이 필요할 것입니다.
<울> 휴대성, 크기가 작기 때문에 기상 관측소는 수백 미터 떨어진 곳에서 데이터를 수집할 수 있으며 필요한 경우 쉽게 위치를 변경할 수 있습니다.
<울> 확장성, 하나 이상의 기상 관측소를 구축하고 이를 수백 미터에 분산시켜 예측 정확도를 높일 수 있습니다.
<울> 저렴한 기기이기 때문에 분실하거나 도난당한 경우에 대비하여 쉽게 다른 기기를 만들 수 있습니다.
데이터베이스 선택 . mongoDb는 스키마가 없고 무료이며 사용하기 쉬운 API라는 좋은 기능 때문에 선택했습니다.
센서 데이터가 수신될 때마다 데이터는 데이터베이스에 저장되며 데이터 항목은 다음과 같습니다.
<코드>{ "_id" :"04_27_2017_06_17", "습도" :65, "날짜" :ISODate("2017-04-27T06:17:18Z"), "압력" :1007, "온도" :9, "비":0, "빛":15}
데이터베이스는 데이터를 BSON 형식(JSON과 유사)으로 저장하므로 읽기 쉽고 작업하기 쉽습니다. 문자열로 형식이 지정된 날짜가 포함된 식별자 아래에 있는 데이터를 분 단위로 집계했으므로 여기에서 가장 작은 그룹은 1분입니다.
기상 관측소(올바른 작동 시)는 10분마다 데이터 포인트를 전송합니다. 데이터 포인트는 "날짜", "습도", "기압", "온도", "비" 및 "빛" 값의 모음입니다.
데이터 처리 및 신경망 기술 선택
신경망의 많은 주요 혁신이 Python에서 발견되기 때문에 백엔드로 Python을 선택했습니다. 많은 Github 리포지토리, 자습서 블로그 및 책이 있는 성장하는 커뮤니티가 여기 있습니다.
* 데이터 처리 부분의 경우 Pandas를 사용했습니다. (https://pandas.pydata.org/ ) . 팬더를 사용하면 데이터 작업을 쉽게 할 수 있습니다. CSV, Excel, Python 데이터 구조에서 테이블을 로드하고 재정렬하고, 열을 삭제하고, 열을 추가하고, 열을 기준으로 인덱싱하고 기타 여러 변환을 수행할 수 있습니다.
* 신경망 작업을 위해 저는 Keras를 선택했습니다. (https://keras.io/). Keras는 Tensorflow와 같은 보다 낮은 수준의 API에 대한 높은 수준의 신경망 래퍼이며 수십 줄 정도의 코드로 다층 신경망을 구축할 수 있습니다. 이것은 우리가 다른 사람들의 위대한 작업에서 유용한 것을 구축할 수 있기 때문에 큰 이점입니다. 이것은 프로그래밍의 기본 사항이며 다른 작은 구성 요소를 기반으로 합니다.
2. 머신 러닝의 기본 개념
이 자습서의 범위는 기계 학습을 가르치는 것이 아니라 가능한 사용 사례 중 하나와 이 사용 사례에 실제로 적용할 수 있는 방법을 간략히 설명하는 것입니다.
신경망은 뉴런이라고 하는 뇌 세포와 유사한 데이터 구조입니다. 과학은 뇌가 축삭이라고 불리는 "선"을 통해 전기 충격에 의해 다른 뉴런과 통신하는 뉴런이라는 특별한 세포를 가지고 있다는 것을 발견했습니다. (다른 많은 뉴런에서) 충분히 자극되면 뉴런은 다른 뉴런을 자극하는 이 "네트워크"에서 더 멀리 떨어진 전기 충격을 촉발할 것입니다. 물론 이것은 과정을 지나치게 단순화한 것이지만 기본적으로 컴퓨터 알고리즘은 이 생물학적 과정을 복제하려고 합니다.
컴퓨터 신경망에서 각 뉴런은 "트리거 포인트"를 가지고 있으며, 이 지점에서 자극을 받으면 자극을 앞으로 전파하고 그렇지 않은 경우에는 전파하지 않습니다. 이를 위해 시뮬레이션된 각 뉴런에는 편향이 있고 각 축삭에는 가중치가 있습니다. 이러한 값을 무작위로 초기화한 후 "학습"이라는 프로세스가 시작된다는 것은 루프에서 알고리즘이 다음 단계를 수행한다는 의미입니다.
<울> 입력 뉴런 자극
<울> 출력 뉴런이 나올 때까지 네트워크 레이어를 통해 신호를 전파합니다.
<울> 출력 뉴런을 읽고 결과를 원하는 결과와 비교
<울> 다음 번에 더 나은 결과를 위해 축색 돌기 가중치 조정
<울> 반복 횟수에 도달할 때까지 다시 시작
이 프로세스에 대한 자세한 내용을 알고 싶다면 https://mattmazur.com/2015/03/17/a-step-by-step-ba....를 참조하십시오. 또한 수많은 책과 튜토리얼이 있습니다.
한 가지 더, 여기서는 지도 학습 방법을 사용할 것입니다. 즉, 새로운 입력 세트가 주어지면 출력을 예측할 수 있도록 알고리즘에 입력과 출력도 가르칠 것입니다.
3. 데이터 준비 방법(가장 중요한 단계)
많은 기계 학습 및 신경망 문제에서 데이터 준비는 매우 중요한 부분이며 다음을 다룹니다.
<울> 원시 데이터 가져오기
<울> 데이터 정리:고아 값, 이상 또는 기타 이상을 제거하는 것을 의미합니다.
<울> 데이터 그룹화:많은 데이터 포인트를 가져와 집계된 데이터 포인트로 변환
<울> 데이터 향상:자체 데이터 또는 외부 소스에서 파생된 데이터의 다른 측면 추가
<울> 기차 및 테스트 데이터의 데이터 분할
<울> split each of the train and test data into inputs and outputs. Typically a problem will have many inputs and a few outputs
<울> rescale the data so it's between 0 and 1 (this will help the network removing high/low value biases)
Getting the raw data
In our case getting data for MongoDb in python is really easy. Given our datapoints collection just this lines of code will do
client =MongoClient(host, port).weather.datapoints cursor =client.find( {'$and' :[ {'date' :{'$gte' :start_date}}, {'date' :{'$lte' :end_date}} ]} )data =list(cursor)..
Data cleanup
The empty values in the dataframe are dropped
dataframe =dataframe.dropna()
Data grouping &data enhancing
This is a very important step, the many small datapoins will be grouped into intervals of 6 hours. For each group several metrics will be calculated on each of the sensors (humidity, rain, temperature, light, pressure)
<울> min value
<울> max value
<울> mean
<울> 70, 90, 30, 10 percentiles
<울> nr of times there has been a rise in a sensor
<울> nr of times there has been a fall in a sensor
<울> nr of times there has been steady values in a sensor
All of these things will give the network information for a datapoint, so for each of the 6 hours intervals these things will be known.
From a dataframe that looks like this:
_id date humidity light pressure rain temperature 04_27_2017_03_08 2017-04-27 03:08:36 67.0 0.0 1007.0 0.0 11.004_27_2017_03_19 2017-04-27 03:19:05 66.0 0.0 1007.0 0.0 11.004_27_2017_03_29 2017-04-27 03:29:34 66.0 0.0 1007.0 0.0 11.0
And the transformation will be:"
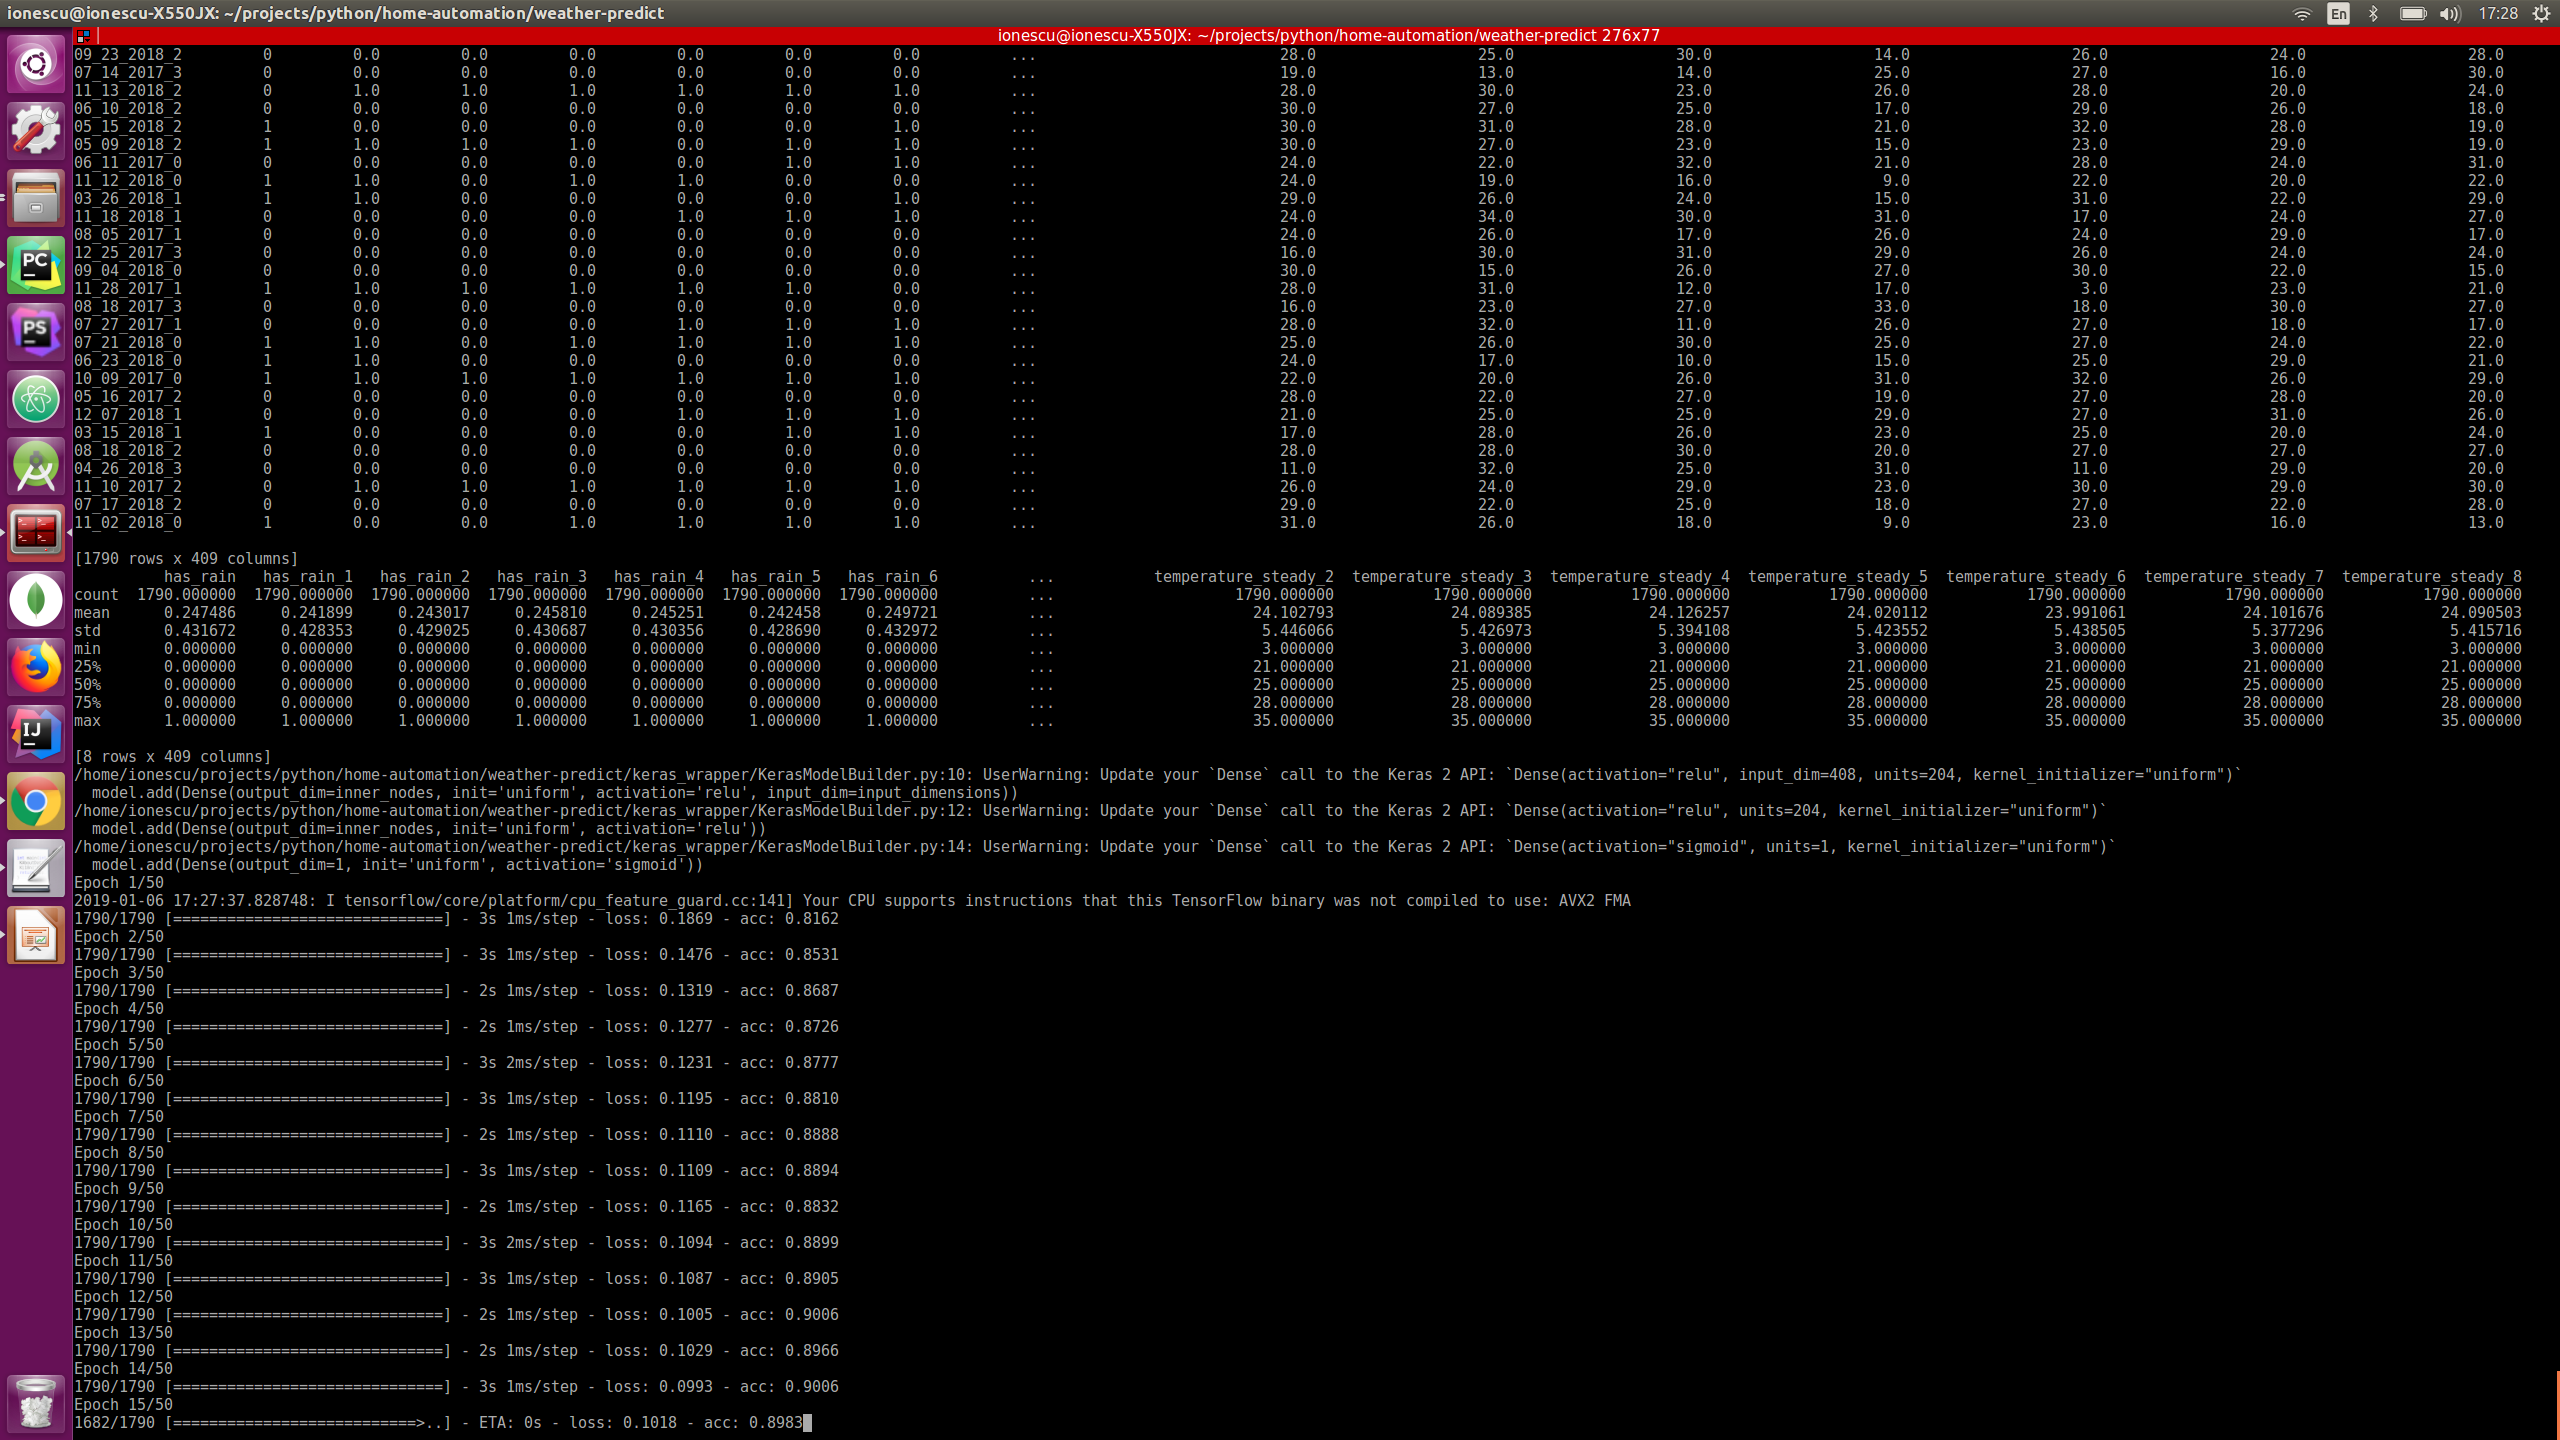
_id date humidity_10percentile humidity_30percentile humidity_70percentile humidity_90percentile humidity_avg ... temperature_avg temperature_fall temperature_max temperature_min temperature_rise temperature_steady ... 04_27_2017_0 2017-04-27 03:08:36 59.6 60.8 63.2 66.0 62.294118 ... 10.058824 2 11.0 9.0 1 1404_27_2017_1 2017-04-27 06:06:50 40.3 42.0 60.0 62.0 50.735294 ... 14.647059 3 26.0 9.0 11 2004_27_2017_2 2017-04-27 12:00:59 36.0 37.0 39.8 42.0 38.314286 ... 22.114286 1 24.0 20.0 5 29
After this a new column named "has_rain" will be added. This will be the output (our predicted variable). Has rain will be 0 or 1 depending if the rain average is above a threshold (0.1). With pandas it's as simple as:
dataframe.insert(loc=1, column='has_rain', value=numpy.where(dataframe['rain_avg']> 0.1, 1, 0))
Data cleanup (again)
- we'll drop the date column because it's no use to us, and also remove datapoints where the minimum temperature is below 0 because our weather station it doesn't have a snow sensor, so we won't be able to measure if it snowed
dataframe =dataframe.drop(['date'], axis=1)dataframe =dataframe[dataframe['temperature_min']>=0]
Data enhancing
Because data in the past might influence our prediction of the rain, we need for each of the dataframe rows to add columns reference to the past rows. This is because each of the row will serve as a training point, and if we want the prediction of the rain to take into account previous datapoints that's exactly what we should do:add more columns for datapoints in the past ex:
_id has_rain humidity_10percentile humidity_30percentile humidity_70percentile humidity_90percentile ... temperature_steady_4 temperature_steady_5 temperature_steady_6 temperature_steady_7 temperature_steady_8 ... 04_27_2017_3 0 36.0 44.8 61.0 63.0 ... NaN NaN NaN NaN NaN04_28_2017_0 0 68.0 70.0 74.0 75.0 ... 14.0 NaN NaN NaN NaN04_28_2017_1 0 40.0 45.0 63.2 69.0 ... 20.0 14.0 NaN NaN NaN04_28_2017_2 0 34.0 35.9 40.0 41.0 ... 29.0 20.0 14.0 NaN NaN04_28_2017_3 0 36.1 40.6 52.0 54.0 ... 19.0 29.0 20.0 14.0 NaN04_29_2017_0 0 52.0 54.0 56.0 58.0 ... 26.0 19.0 29.0 20.0 14.004_29_2017_1 0 39.4 43.2 54.6 57.0 ... 18.0 26.0 19.0 29.0 20.004_29_2017_2 1 41.0 42.0 44.2 47.0 ... 28.0 18.0 26.0 19.0 29.0
So you see that for every sensor let's say temperature the following rows will be added:"temperature_1", "temperature_2".. meaning temperature on the previous datapoint, temperature on the previous two datapoints etc. I've experimented with this and I found that a optimum number for our 6 hour groupings in 8. That means 8 datapoints in the past (48 hours). So our network learned the best from datapoins spanning 48 hours in the past.
Data cleanup (again)
As you see, the first few columns has "NaN" values because there is nothing in front of them so they should be removed because they are incomplete.
Also data about current datapoint should be dropped, the only exception is "has_rain". the idea is that the system should be able to predict "has_rain" without knowing anything but previous data.
Splitting the data in train and test data
This is very easy due to Sklearn package:
from sklearn.model_selection import train_test_split ...main_data, test_data =train_test_split(dataframe, test_size=percent_test_data) ...
This will split the data randomly into two different sets
Split each of the train and test data into inputs and outputs
Presuming that our "has_rain" interest column is located first
X =main_data.iloc[:, 1:].valuesy =main_data.iloc[:, 0].values
Rescale the data so it's between 0 and 1
Again fairly easy because of sklearn
from sklearn.preprocessing import StandardScalerfrom sklearn.externals import joblib..scaler =StandardScaler()X =scaler.fit_transform(X) ...# of course we should be careful to save the scaled model for later reusejoblib.dump(scaler, 'model_file_name.save')
4. How the actual neural network wrapper API works (Keras)
Building a multi layer neural network with Keras is very easy:
from keras.models import Sequentialfrom keras.layers import Densefrom keras.layers import Dropout ...input_dimensions =X.shape[1] optimizer ='rmsprop'dropout =0.05model =Sequential()inner_nodes =int(input_dimensions / 2)model.add(Dense(inner_nodes, kernel_initializer='uniform', activation='relu', input_dim=input_dimensions))model.add(Dropout(rate=dropout))model.add(Dense(inner_nodes, kernel_initializer='uniform', activation='relu'))model.add(Dropout(rate=dropout))model.add(Dense(1, kernel_initializer='uniform', activation='sigmoid'))model.compile(optimizer=optimizer, loss='mean_absolute_error', metrics=['accuracy']) model.fit(X, y, batch_size=1, epochs=50)...# save the model for later useclassifier.save('file_model_name')
So what does this code mean? Here we're building a sequential model, that means sequentially all the layers will be evaluated.
a) we declare the input layer (Dense), here all the inputs from our dataset will be initializedm so the "input_dim" parameter must be equal to the row length
b) a Dropout layer is added. To understand the Dropout first we must understand what "overfitting" means:it's a state in which the network has learned too much particularities for a specific dataset and will perform badly when confronted to a new dataset. The dropout layer will disconnect randomly neurons at each iteration so the network won't overfit.
c) another layer of Dense is added
d) another Dropout
e) the last layer is added with one output dimension (it will predict only yes/no)
f) the model is "fitted" that means the learning process will begin, and the model will learn
Other parameters here:
<울> activation functions (sigmoid, relu). This are functions that dictate when the neuron will transmit it's impulse further in the network. There are many, but sigmoid and relu are the most common. Check out this link for more details:https://towardsdatascience.com/activation-function...
<울> kernel_initializer function (uniform). This means that all the weights are initialized with random uniform values
<울> loss function (mean_absolute_error). This function measures the error comparing the network predicted result versus the ground truth. There are many alternatives:https://keras.io/losses/
<울> metrics function (accuracy). It measures the performance of the model
<울> optimiser functions (rmsprop). It optimizes how the model learn through backpropagation.
<울> batch_size. Number of datapoints to take once by Keras before applying optimizer function
<울> epochs:how many times the process it's started from 0 (to learn better)
There is no best configuration for any network or dataset, all these parameters can an should be tuned for optimal performance and will make a big difference in prediction success.
5. Future improvements
Let's start from the weather station , I can see a lot of improving work to be done here:
<울> add a wind speed / direction sensor. This could be a very important sensor that i'm missing in my model
<울> experiment with UV rays, gas and particle sensors
<울> add at least two stations in the zone for better data (make some better averages)
<울> collect a few more years of data, i've experimented with just a year and a half
Some processing improvements:
<울> try to incorporate data from other sources into the model. You can start to import wind speed data and combine with the local station data for a better model. This website offers historical data:https://www.wunderground.com/history/
<울> optimize the Keras model better by adjusting:layers, nr of neurons in layers, dropout percents, metrics functions, optimiser functions, loss functions, batch size, learning epochs
<울> try other model architectures, for example i've experimented with LSTM (long short term memory) but it gived slightly poorer results)
To try different parameters on the learning model you can use
python train.py --days_behind 600 --test-file-percent 10 --datapoints-behind 6 --hour-granularity 6 --grid-search
This will search through different "batch_size", "epoch", "optimizer" and "dropout" values, evaluate all and print out the best combination for your data.
If you have some feedback on my work please share it, thanks for staying till the end of the tutorial!
Step 7:Bonus:Using an Official Weather Dataset
I was wondering if I can get better results with a more reliable weather station, so i've searched a bit, and i've came across "Darksky AP I" (https://darksky.net/dev), this is a great tool that provides current and historical weather data with many more sensor data:
<울> temperature
<울> humidity
<울> pressure
<울> wind speed
<울> wind gust
<울> ub index
<울> visibilitySo this beeing data from an official weather station, and having more parameters I thought it should perform better so i've gave it a try. To replicate my findings:
1.Download the data from darsky or import my MongoDb collection:
a) Download
<울> to download your self, first create an account in darsky and get the API key
<울> replace the API key in download_import/config.py
<울> also in the config replace the geographic coordonates for the location you want to predict the rain
<울> in a console activate "weather" anaconda environment and run:
python download_import/darksky.py -d 1000
- the free version of the API is limited to 1000 requests per day so if you want more data you need to wait for a longer time
b) Import my downloaded data for Bucharest city
- in a console run
mongoimport -d weather -c darksky --file sample_data/darksky.json
2. When you train the model specify that it should run on "darksy" dataset
python train.py -d 2000 -p 20 -dp 4 -hg 6 --data-source darksky
3. To see the results run predict batch script as before
python predict_batch.py -f sample_data/test_data.csv
You'll see that the overall prediction percent has gone from about 80% to 90%. Also the prediction accuracy when accounting only rainy days has gone up.
So yes, the dataset really matters.
<섹션 클래스="섹션 컨테이너 섹션 축소 가능" id="코드"> 코드
<울> 코드 스니펫 #2
코드 스니펫 #5
Code snippet #6
Code snippet #10
Code snippet #15
Code snippet #16
Code snippet #18
Code snippet #22
Code snippet #23
Code snippet #25
Code snippet #26
코드 스니펫 #2일반 텍스트
#include "LowPower.h"
#include "SoftwareSerial.h"#include "Wire.h"#include "Adafruit_Sensor.h"#include "Adafruit_BME280.h"#include "BH1750.h"SoftwareSerial serialComm(4, 5); // RX, TXAdafruit_BME280 bme; BH1750 lightMeter;const byte rainPin =A0;byte sensorsCode =1;/** * voltage level that will pun the microcontroller in deep sleep instead of regular sleep */int voltageDeepSleepThreshold =4200; const byte peripherialsPowerPin =6;char buffer[] ={' ',' ',' ',' ',' ',' ',' '};struct sensorData { byte humidity; int temperature; byte rain; int pressure; long voltage; int light; };sensorData sensors;void setup() { Serial.begin(9600); serialComm.begin(9600); pinMode(peripherialsPowerPin, OUTPUT); digitalWrite(peripherialsPowerPin, HIGH); 지연(500); if (!bme.begin()) { Serial.println("Could not find a valid BME280 sensor, check wiring!"); while (1) { customSleep(100); } } Serial.println("Initialization finished succesfully"); delay(50); digitalWrite(peripherialsPowerPin, HIGH);}void loop() { updateSenzors(); transmitData(); customSleep(75); }void updateSenzors() { bme.begin(); lightMeter.begin(); delay(300); sensors.temperature =bme.readTemperature(); sensors.pressure =bme.readPressure() / 100.0F; sensors.humidity =bme.readHumidity(); sensors.light =lightMeter.readLightLevel(); sensors.voltage =readVcc(); sensors.rain =readRain();}void transmitData(){ emptyIncommingSerialBuffer(); Serial.print("Temp:");Serial.println(sensors.temperature); Serial.print("Humid:");Serial.println(sensors.humidity); Serial.print("Pressure:");Serial.println(sensors.pressure); Serial.print("Light:");Serial.println(sensors.light); Serial.print("Voltage:");Serial.println(sensors.voltage); Serial.print("Rain:");Serial.println(sensors.rain); transmitSenzorData("T", sensors.temperature); transmitSenzorData("H", sensors.humidity); transmitSenzorData("PS", sensors.pressure); transmitSenzorData("L", sensors.light); transmitSenzorData("V", sensors.voltage); transmitSenzorData("R", sensors.rain);}void emptyIncommingSerialBuffer(){ while (serialComm.available()> 0) { serialComm.read(); 지연(5); }}void transmitSenzorData(String type, int value){ serialComm.print(type); serialComm.print(sensorsCode); serialComm.print(":"); serialComm.print(value); serialComm.print("|"); delay(50);}void customSleep(long eightSecondCycles){ if (sensors.voltage> voltageDeepSleepThreshold) { delay(eightSecondCycles * 8000); 반품; } digitalWrite(peripherialsPowerPin, LOW); for (int i =0; i  코드 스니펫 #5일반 텍스트  cd weather-predict # create anaconda environment named "weather" with python 3.6.2conda create --name weather python=3.6.2 # activate environmentconda activate weather# install all packages pip install -r requirements.txt  Code snippet #6Plain text  mongodb ={ 'host':'localhost', 'port':27017}... Code snippet #10Plain text  conda activate weatherpython serial_listener.py# every 10 minutes you should see data from the weather station coming in :[Sensor:type(temperature), value(14.3)][Sensor:type(pressure), value(1056.0)]... Code snippet #15Plain text  { "_id" :"04_27_2017_06_17", "humidity" :65, "date" :ISODate("2017-04-27T06:17:18Z"), "pressure" :1007, "temperature" :9, "rain" :0, "light" :15} Code snippet #16Plain text  client =MongoClient(host, port).weather.datapoints cursor =client.find( {'$and' :[ {'date' :{'$gte' :start_date}}, {'date' :{'$lte' :end_date}} ]} )data =list(cursor).. Code snippet #18Plain text  _id date humidity light pressure rain temperature 04_27_2017_03_08 2017-04-27 03:08:36 67.0 0.0 1007.0 0.0 11.004_27_2017_03_19 2017-04-27 03:19:05 66.0 0.0 1007.0 0.0 11.004_27_2017_03_29 2017-04-27 03:29:34 66.0 0.0 1007.0 0.0 11.0  Code snippet #22Plain text  _id has_rain humidity_10percentile humidity_30percentile humidity_70percentile humidity_90percentile ... temperature_steady_4 temperature_steady_5 temperature_steady_6 temperature_steady_7 temperature_steady_8 ... 04_27_2017_3 0 36.0 44.8 61.0 63.0 ... NaN NaN NaN NaN NaN04_28_2017_0 0 68.0 70.0 74.0 75.0 ... 14.0 NaN NaN NaN NaN04_28_2017_1 0 40.0 45.0 63.2 69.0 ... 20.0 14.0 NaN NaN NaN04_28_2017_2 0 34.0 35.9 40.0 41.0 ... 29.0 20.0 14.0 NaN NaN04_28_2017_3 0 36.1 40.6 52.0 54.0 ... 19.0 29.0 20.0 14.0 NaN04_29_2017_0 0 52.0 54.0 56.0 58.0 ... 26.0 19.0 29.0 20.0 14.004_29_2017_1 0 39.4 43.2 54.6 57.0 ... 18.0 26.0 19.0 29.0 20.004_29_2017_2 1 41.0 42.0 44.2 47.0 ... 28.0 18.0 26.0 19.0 29.0  Code snippet #23Plain text  from sklearn.model_selection import train_test_split ...main_data, test_data =train_test_split(dataframe, test_size=percent_test_data) ... Code snippet #25Plain text  from sklearn.preprocessing import StandardScalerfrom sklearn.externals import joblib..scaler =StandardScaler()X =scaler.fit_transform(X) ...# of course we should be careful to save the scaled model for later reusejoblib.dump(scaler, 'model_file_name.save')  Code snippet #26Plain text  from keras.models import Sequentialfrom keras.layers import Densefrom keras.layers import Dropout ...input_dimensions =X.shape[1] optimizer ='rmsprop'dropout =0.05model =Sequential()inner_nodes =int(input_dimensions / 2)model.add(Dense(inner_nodes, kernel_initializer='uniform', activation='relu', input_dim=input_dimensions))model.add(Dropout(rate=dropout))model.add(Dense(inner_nodes, kernel_initializer='uniform', activation='relu'))model.add(Dropout(rate=dropout))model.add(Dense(1, kernel_initializer='uniform', activation='sigmoid'))model.compile(optimizer=optimizer, loss='mean_absolute_error', metrics=['accuracy']) model.fit(X, y, batch_size=1, epochs=50)...# save the model for later useclassifier.save('file_model_name') 깃허브 https://github.com/claws/BH1750https://github.com/claws/BH1750 깃허브 https://github.com/rocketscream/Low-Powerhttps://github.com/rocketscream/Low-Power 깃허브 https://github.com/adafruit/Adafruit_Sensorhttps://github.com/adafruit/Adafruit_Sensor 깃허브 https://github.com/adafruit/Adafruit_BME280_Libraryhttps://github.com/adafruit/Adafruit_BME280_Library 깃허브 https://github.com/danionescu0/home-automationhttps://github.com/danionescu0/home-automation