

제조공정

산업 제조
 |
| × | 1 | |||
| × | 1 | ||||
| × | 1 | ||||
| × | 1 | ||||
 |
| × | 1 | |||
 |
| × | 2 | |||
| × | 1 | ||||
| × | 1 | ||||
 |
| × | 1 | |||
 |
| × | 1 | |||
 |
| × | 1 | |||
 |
| × | 1 | |||
 |
| × | 1 | |||
| × | 1 |
 |
| |||
 |
| |||
| ||||
 |
| |||
| ||||
|
새로운 프로젝트를 시작할 때마다 내 열정과 관련된 최신 기술을 활용하여 무언가를 만들려고 노력합니다. 이 프로젝트를 위해 오토바이에 대한 열정과 내가 가장 좋아하는 취미(Arduino 사용)를 결합하기로 결정했습니다.
아이디어
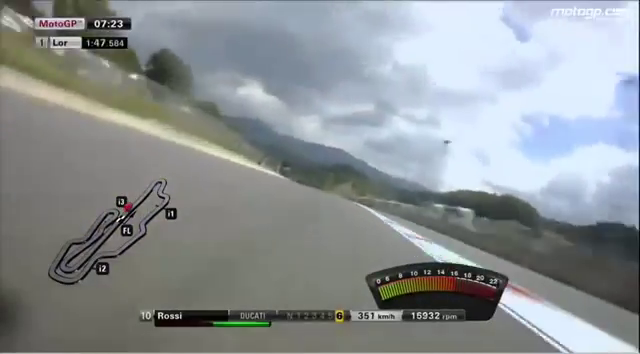
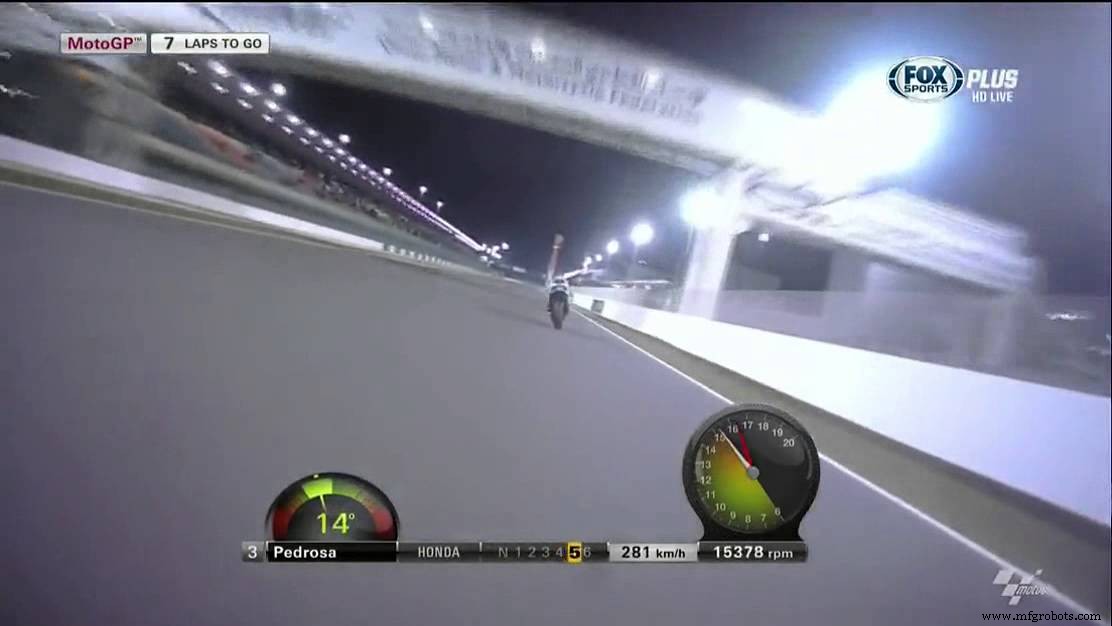
저는 TV에서 motogp 경주에 대해 보는 원격 측정 이미지에 항상 매료되었습니다. 아래와 같은 이미지를 보고 내가 가장 좋아하는 가제트(Arduino)와 프로그래밍 지식을 사용하여 어떻게 구축할 수 있는지 상상했습니다.
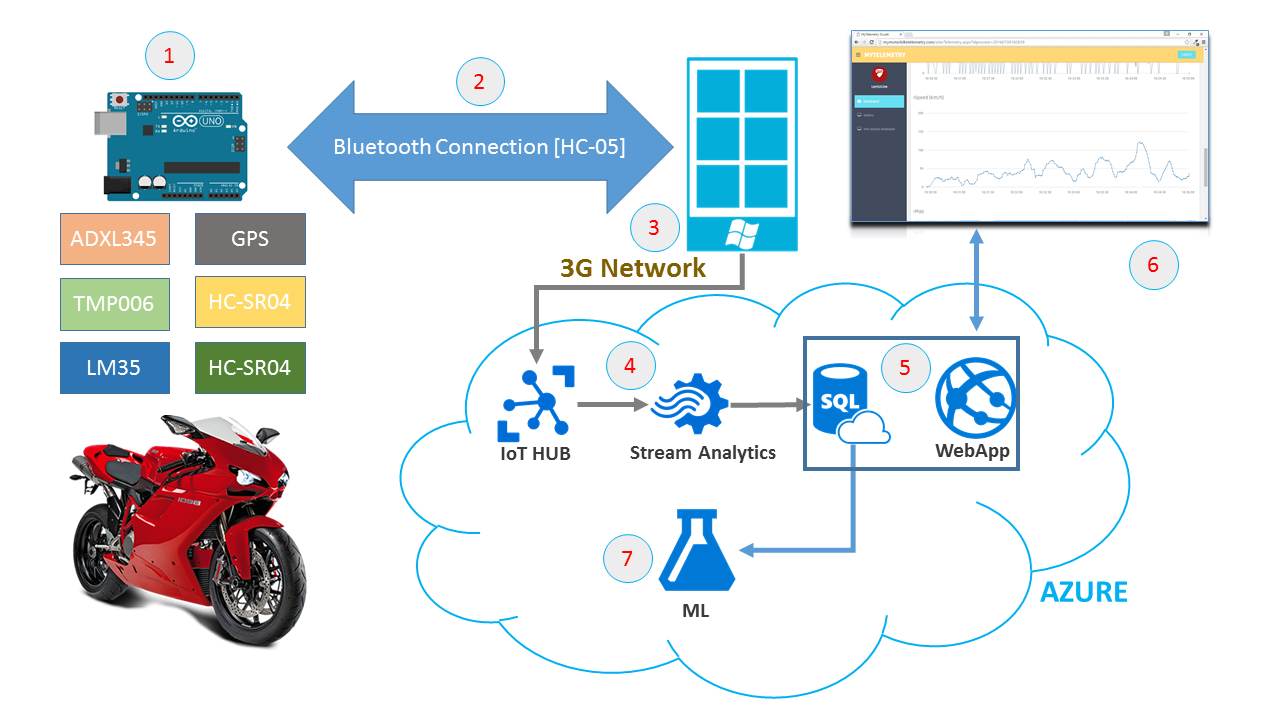
그래서 모든 오토바이 매니아가 오토바이에 하나쯤 가지고 있을 수 있도록 복제하기 쉬운 Arduino와 Azure를 기반으로 하는 원격 측정 시스템을 개발하기로 결정했습니다.
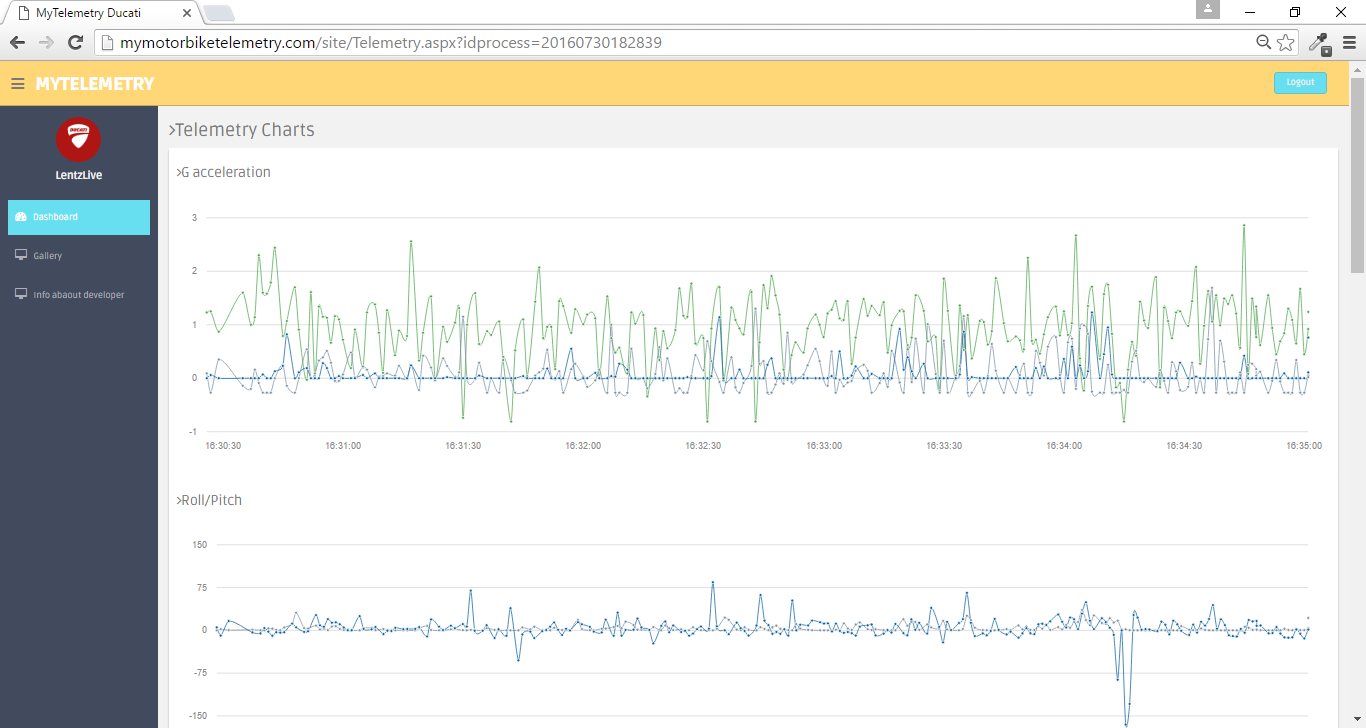
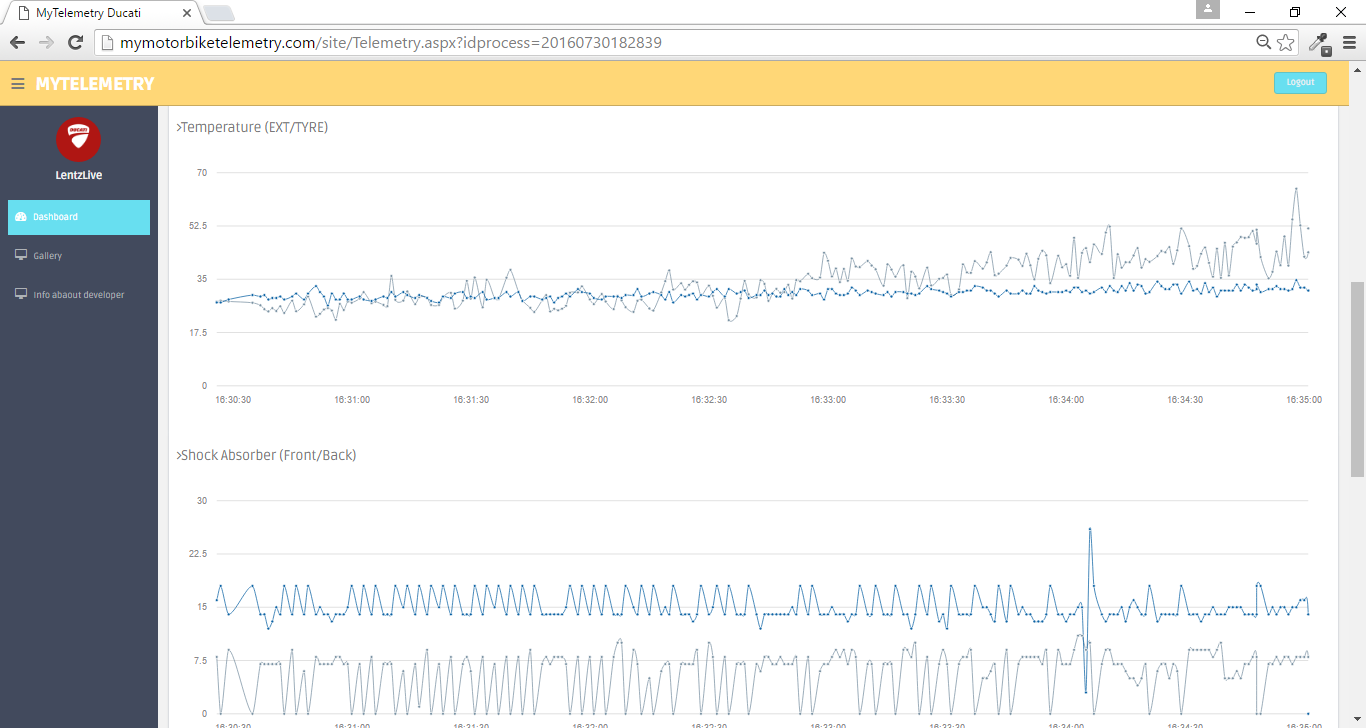
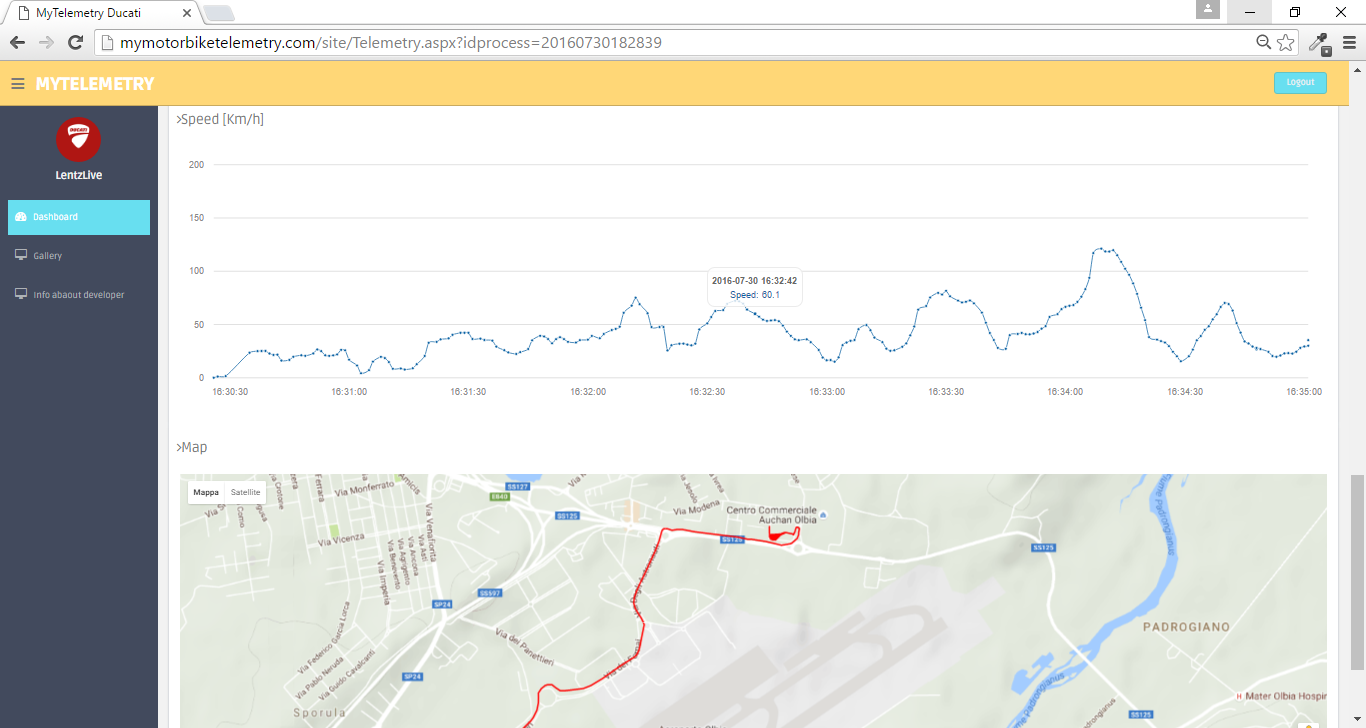
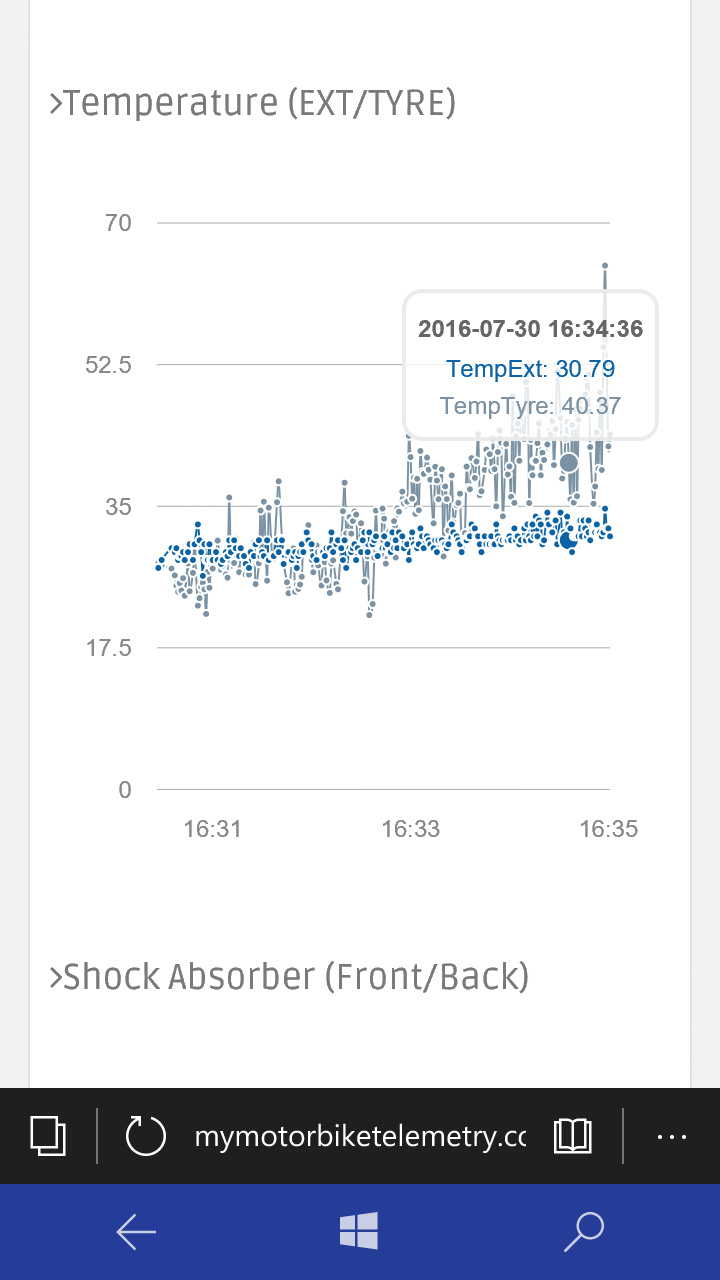
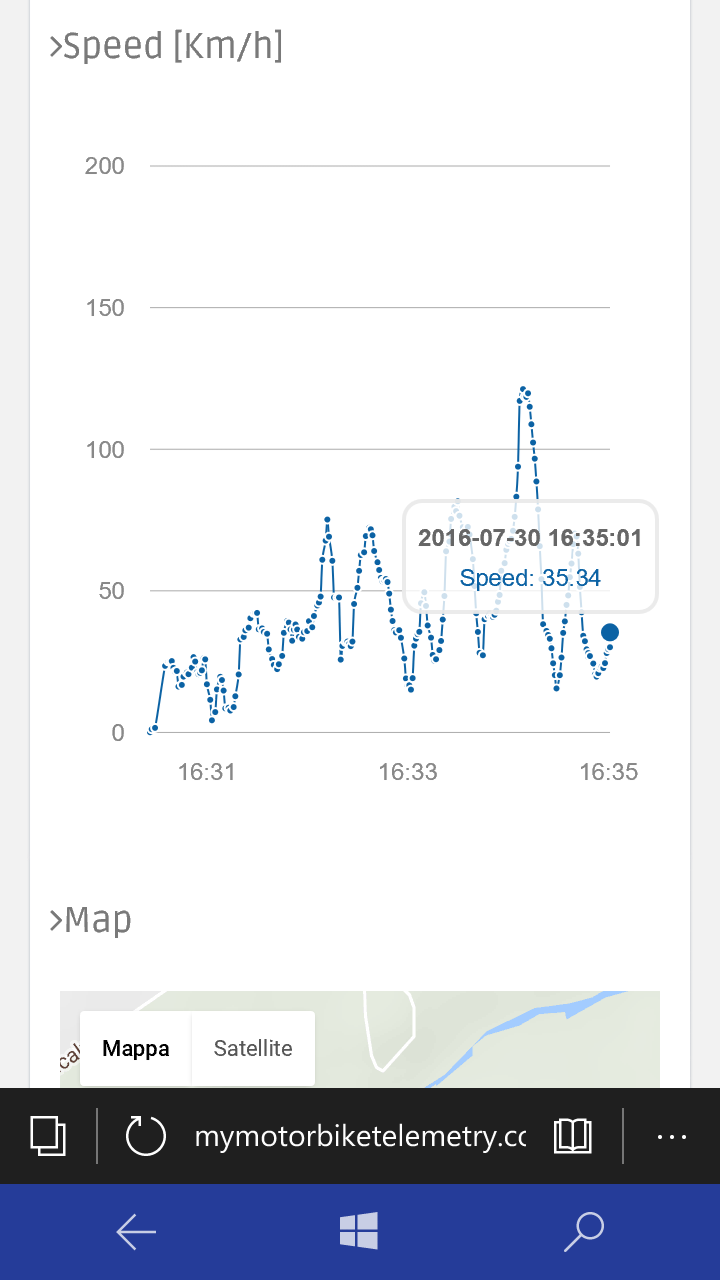
아래에서 볼 수 있듯이 이 원격 측정 시스템은 운전 스타일에 대한 다음 정보를 얻을 수 있습니다.
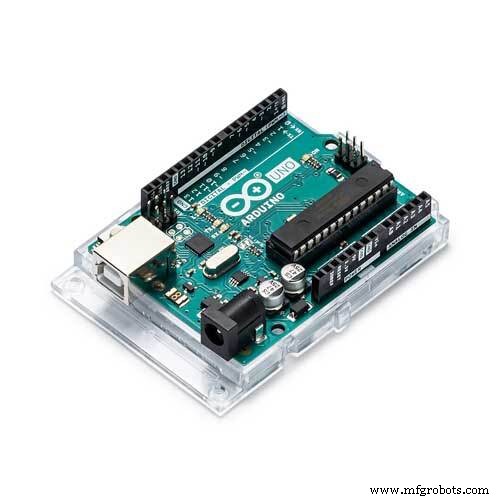
<울>이를 위해 Arduino Uno R3, 일부 센서, Windows Phone에 배포된 UWP 및 일부 Azure 서비스를 사용했습니다.
워크플로는 다음 그림에 설명되어 있습니다.
 <울>
<울>
정말 멋진 것 같아요!!! 프로젝트 설명 시작
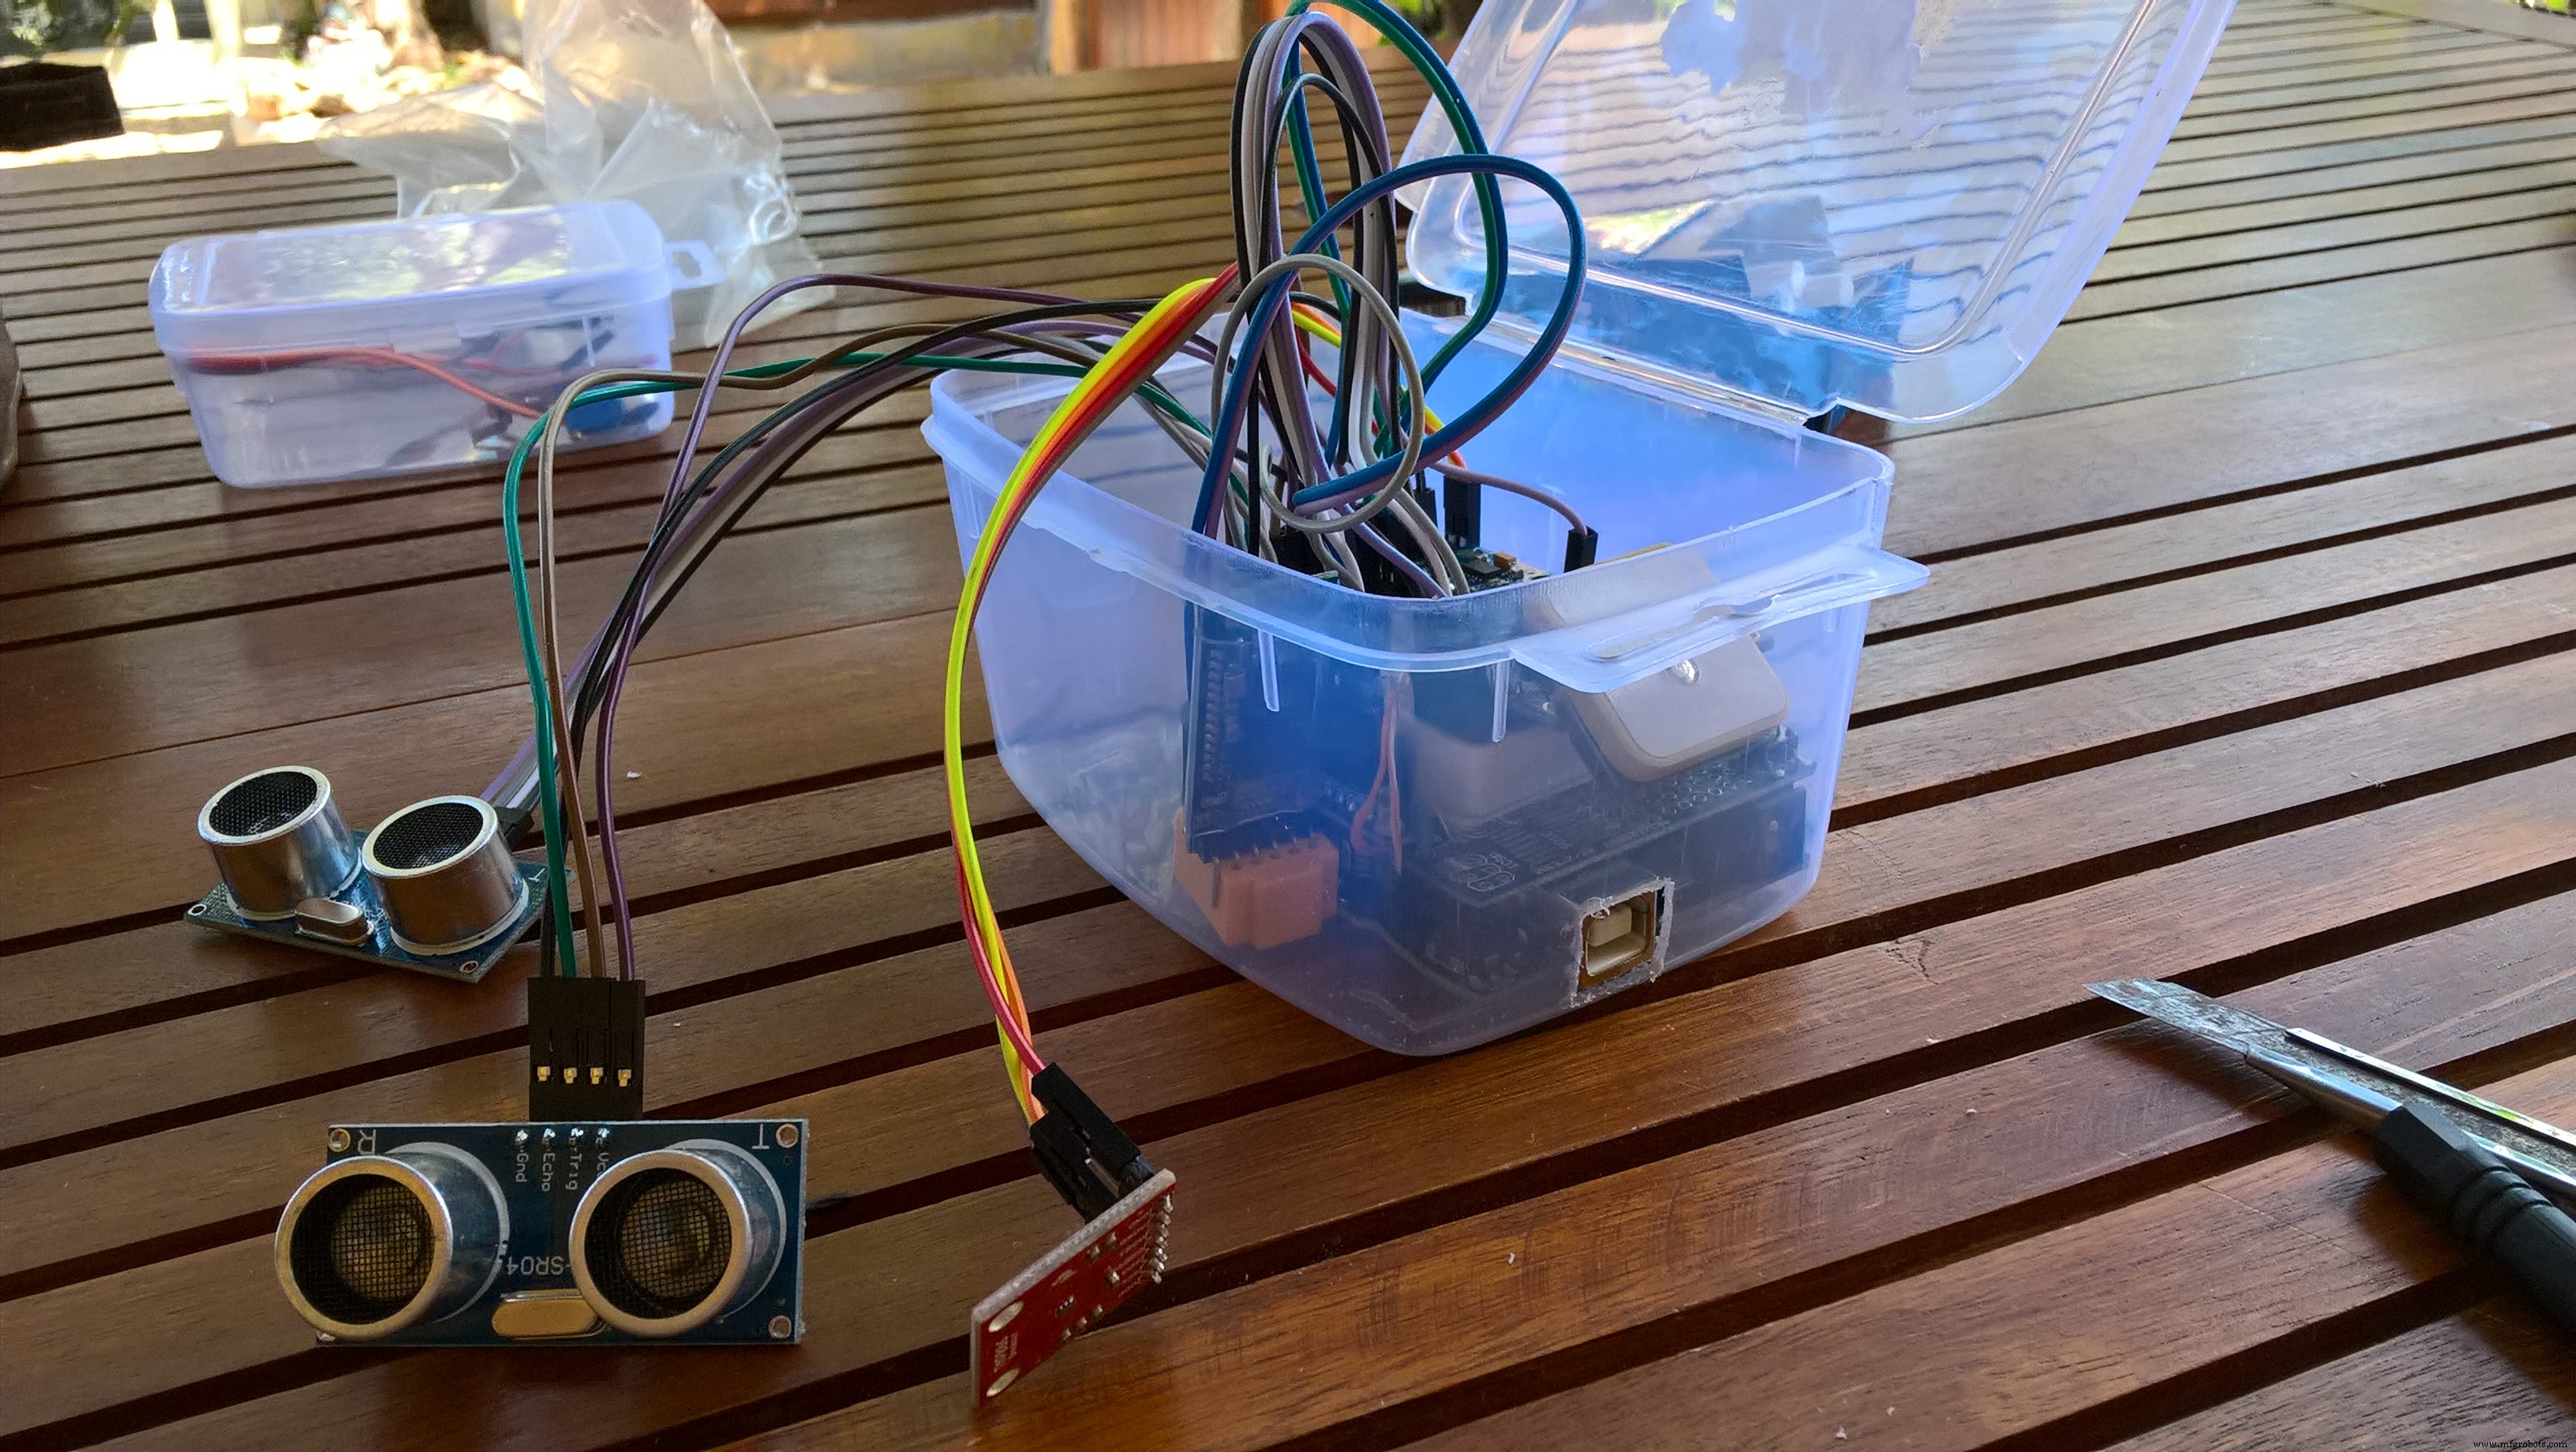
하드웨어 설정
내 하드웨어 구성은 아래와 같습니다.
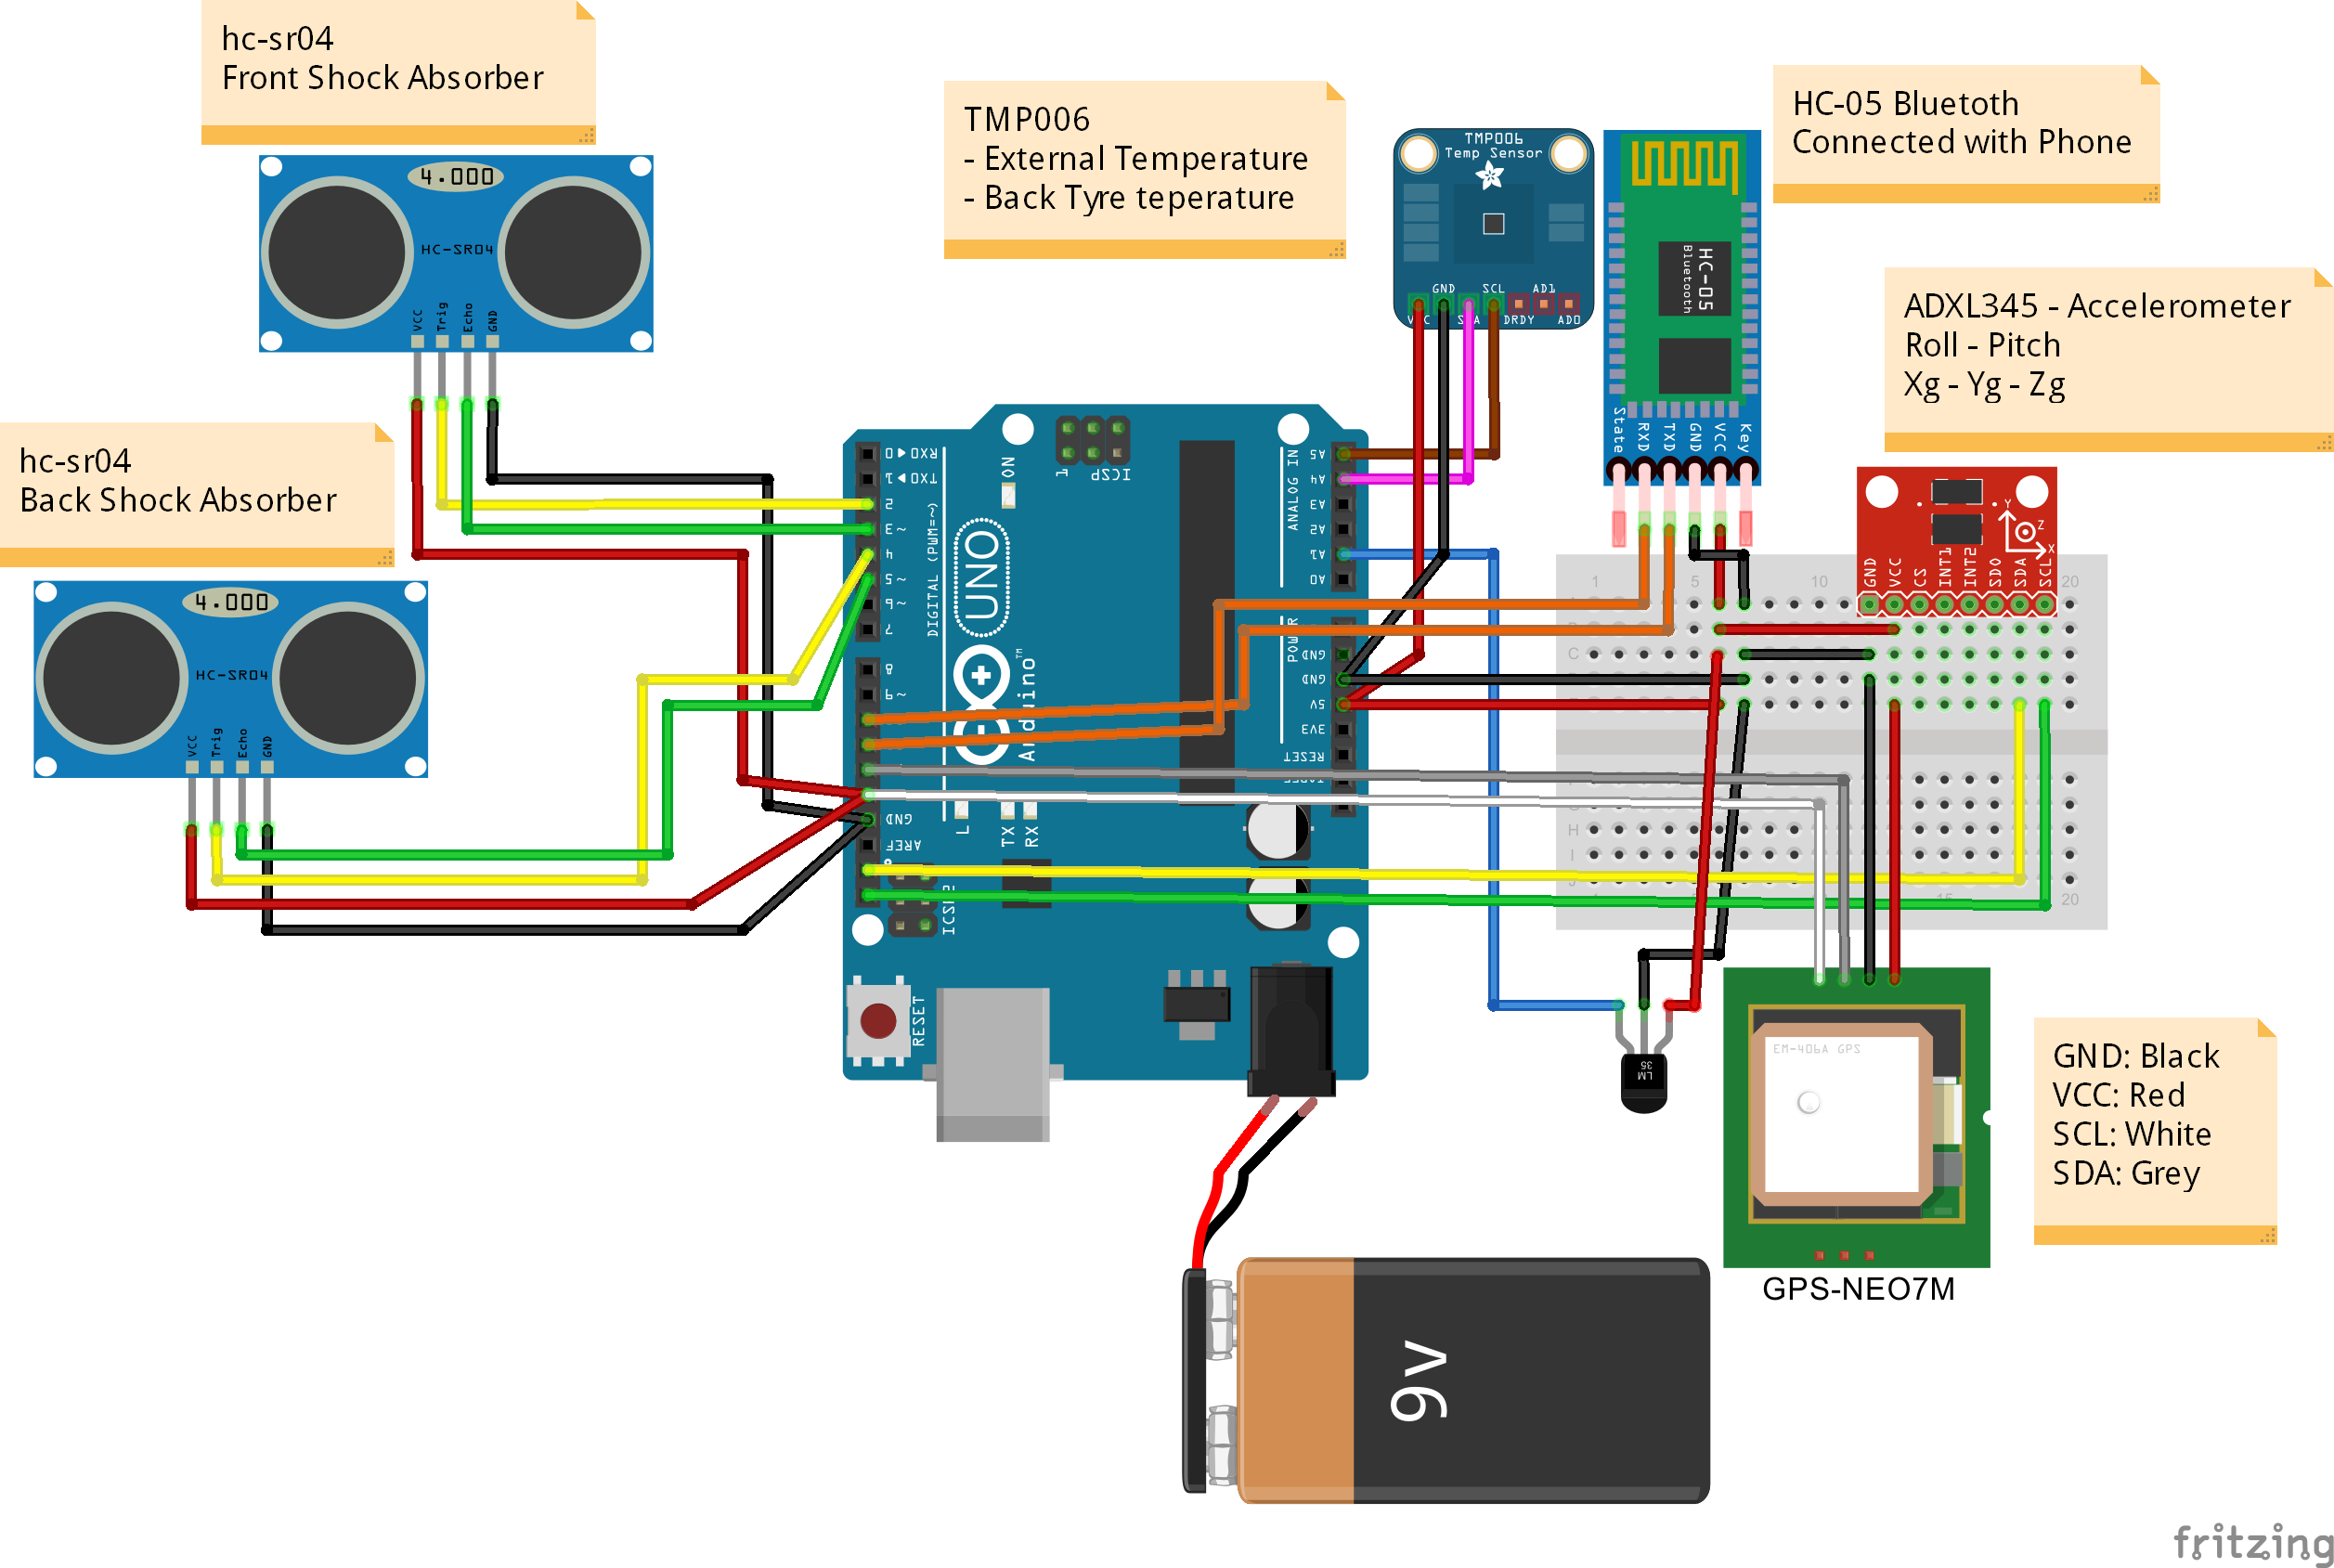
내 하드웨어 설정은 다음으로 구성됩니다.
<울>1단계 - 블루투스 연결
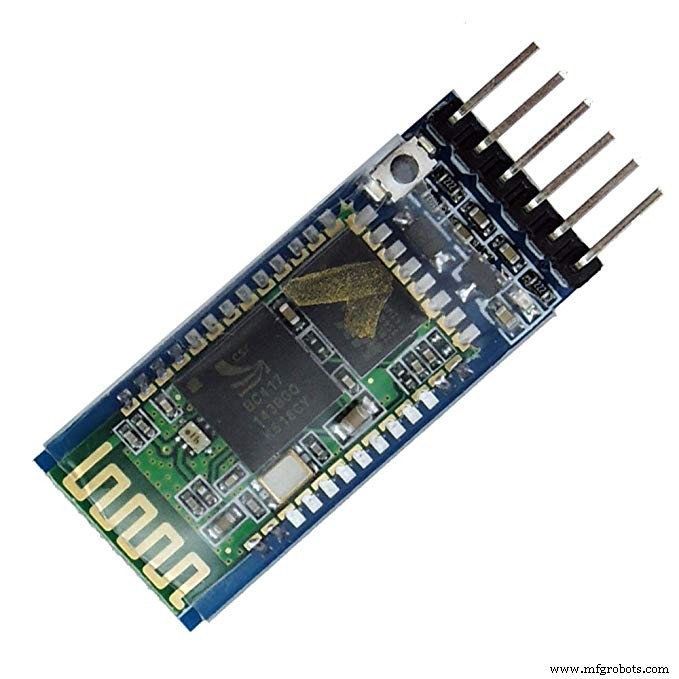
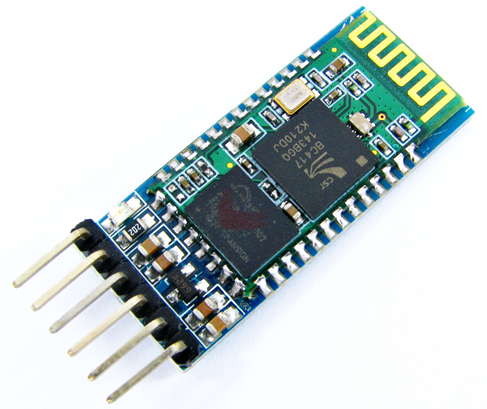
SoftwareSerial 을 사용했습니다. 블루투스 모듈을 아두이노와 연결하여 윈도우 폰과 무선 통신이 가능하도록 하는 라이브러리입니다.
HC-05 이 범위에 대해 Bluetooth 모듈이 선택되었으며 마스터 또는 슬레이브로 구성할 수 있는 직렬 포트 프로필이 있는 클래스 2 Bluetooth 모듈입니다.
다음 단계는 내 Bluetooth 장치의 기본 이름을 변경하는 것이었습니다. 기본 이름은 HC-05였습니다. ... "매력적"이 아니었습니다
이 기기를 사용하는 방법:
Arduino 코드에서:
<울>#include [...]SoftwareSerial BTSerial(10,11); // RX-TX[...]void setup(){BTSerial.begin(9600);[...]} 이제 다음 명령줄을 사용하여 원하는 모든 문자열을 Bluetooth를 통해 보낼 준비가 되었습니다.
...BTSerial.print("Hello Hackster");...
Windows Phone과 Arduino 간의 통신이 이제 준비되었으며 매우 쉬웠습니다!
2단계 - GPS 통신
이 범위에 사용된 하드웨어는 GPS-NEO7M 입니다. 모듈은 56개의 채널을 갖고 10Hz에서 정확한 위치 업데이트를 출력하는 저전력 GPS 모듈입니다.
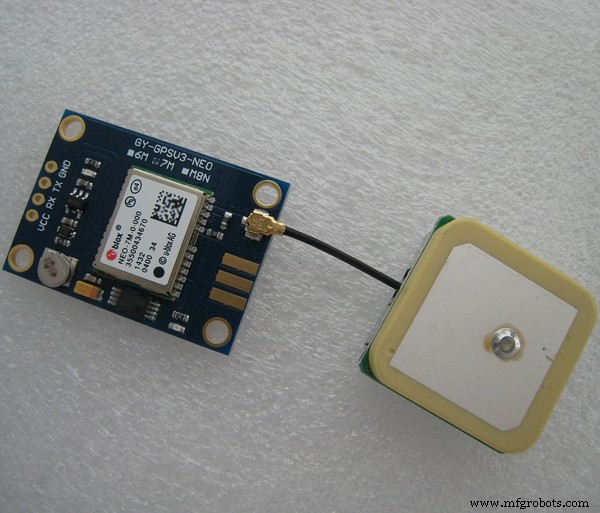
Arduino와 GPS 모듈 간의 통신은 SoftwareSerial 라이브러리 및 TinyGPS++라는 이름의 매우 흥미로운 라이브러리 활용
이 센서와 통신하는 방법:
<울>아래 코드 참조:
#include #include // GPSSoftwareSerial ss(12,13); // RX-TX// TinyGPS ObjectTinyGPSPlus 정의 gps;void setup(){// GPS Inizializess.begin(9600);[...]}void loop(){// GPS가 사용 가능한 동안 정보를 읽는 동안(ss .available()>0){if(gps.encode(ss.read())){if(gps.location.isValid()){이중 위도=gps.location.lat(); 이중 경도=gps.location .lng(); }}}[...]} 3단계 - 가속도계
3축의 가속도 값을 결정하고 롤 및 피치 각도(Lean 및 Wheelie 각도)를 계산하기 위해 ADXL345
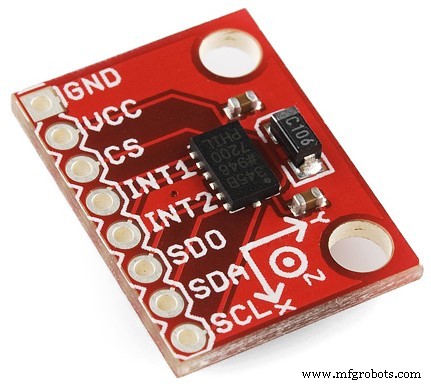
ADXL345 최대 ±16g에서 고해상도(13비트) 측정이 가능한 작고 얇은 초저전력 3축 가속도계입니다. 디지털 출력 데이터는 16비트 2의 보수 형식으로 지정되며 SPI (3선 또는 4선) 또는 I2C 디지털 인터페이스.
Arduino와 ADXL345 센서 간의 통신은 ADXL345.h를 사용하여 발생합니다. 도서관.
이 센서를 연결할 때 3축의 중력 가속도를 결정할 수 있지만 값이 즉시 보정되지 않는다는 점을 이해하는 것이 매우 중요합니다. OFFSET 설정을 위한 코드를 생성해야 합니다.
나는 첫 번째 루프에서 "영점"을 결정하기로 결정했습니다. 이를 위해 첫 번째 루프의 G 가속도는 후속 측정에서 빼야 하는 참조 값이 됩니다.
// if (i ==0) {refXg =Xg; refYg =Yg; refZg =Zg;i =1;}// 영점 빼기Xg =Xg - refXg;Yg =Yg - refYg;Zg =Zg - refZg + 1; 그런 다음 g 가속도 구성 요소를 기반으로 Lean Angle과 Wheelie Angle을 계산해야 합니다.
아래에서 이를 수행하는 2개의 간단한 수학 방정식을 볼 수 있습니다.
// 롤 및 피치 방정식roll =-(atan2(-fYg, fZg) * 180.0) / M_PI; 피치 =(atan2(fXg, sqrt(fYg * fYg + fZg * fZg)) * 180.0) / M_PI; 이 프로젝트에서 고려해야 할 사항:
<울>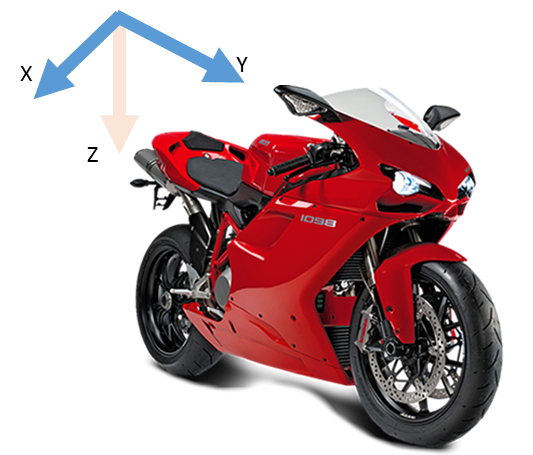
이 센서와 통신하는 방법:
<울>이제 가속 정보를 읽을 준비가 되었습니다. 아래 코드를 참조하세요.
#include #include #include // GPSSoftwareSerial ss(12,13); // RX-TX// ADXL345 Object 정의ADXL345 acc;void setup(){// ADXL345 Inizializeacc.begin();[...]}void loop(){// g 가속 구성 요소 읽기double Xg,Yg,Zg; acc.read(&Xg,&Yg,&Zg);} 4단계 - 타이어 온도
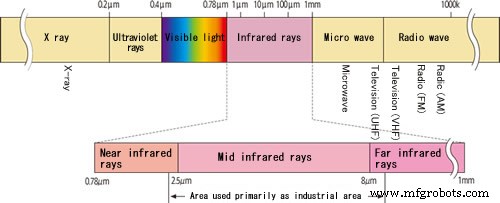
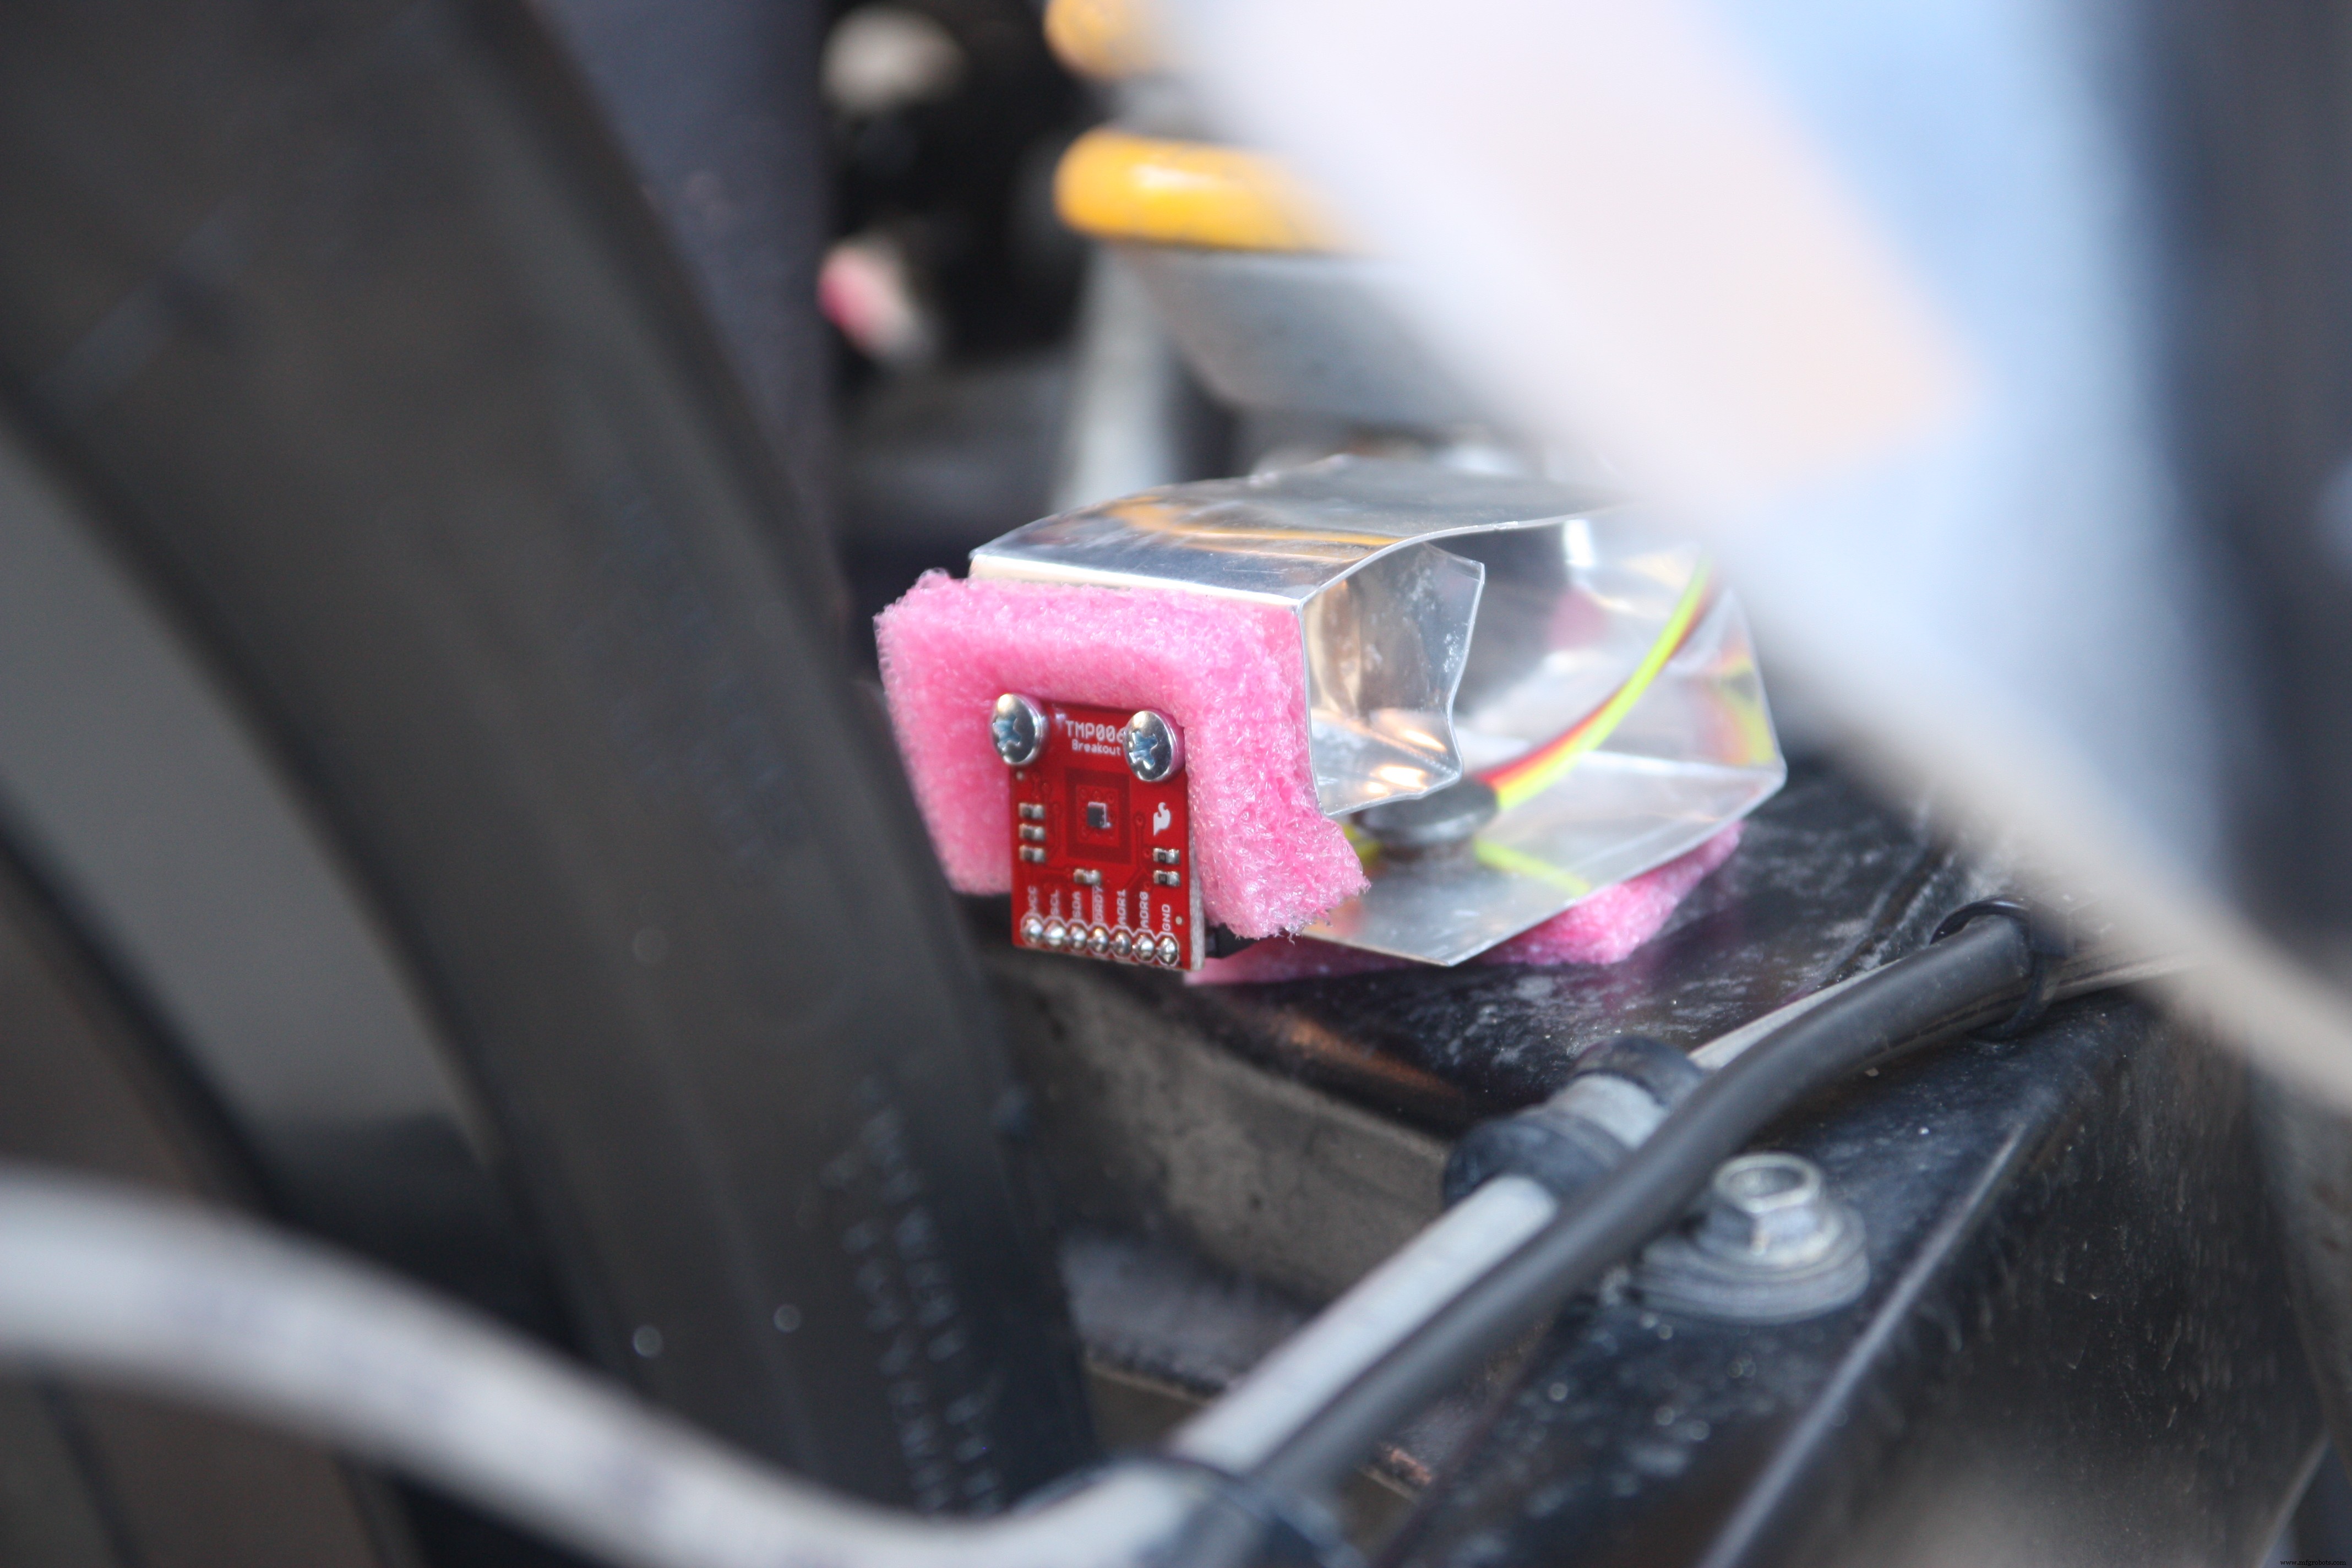
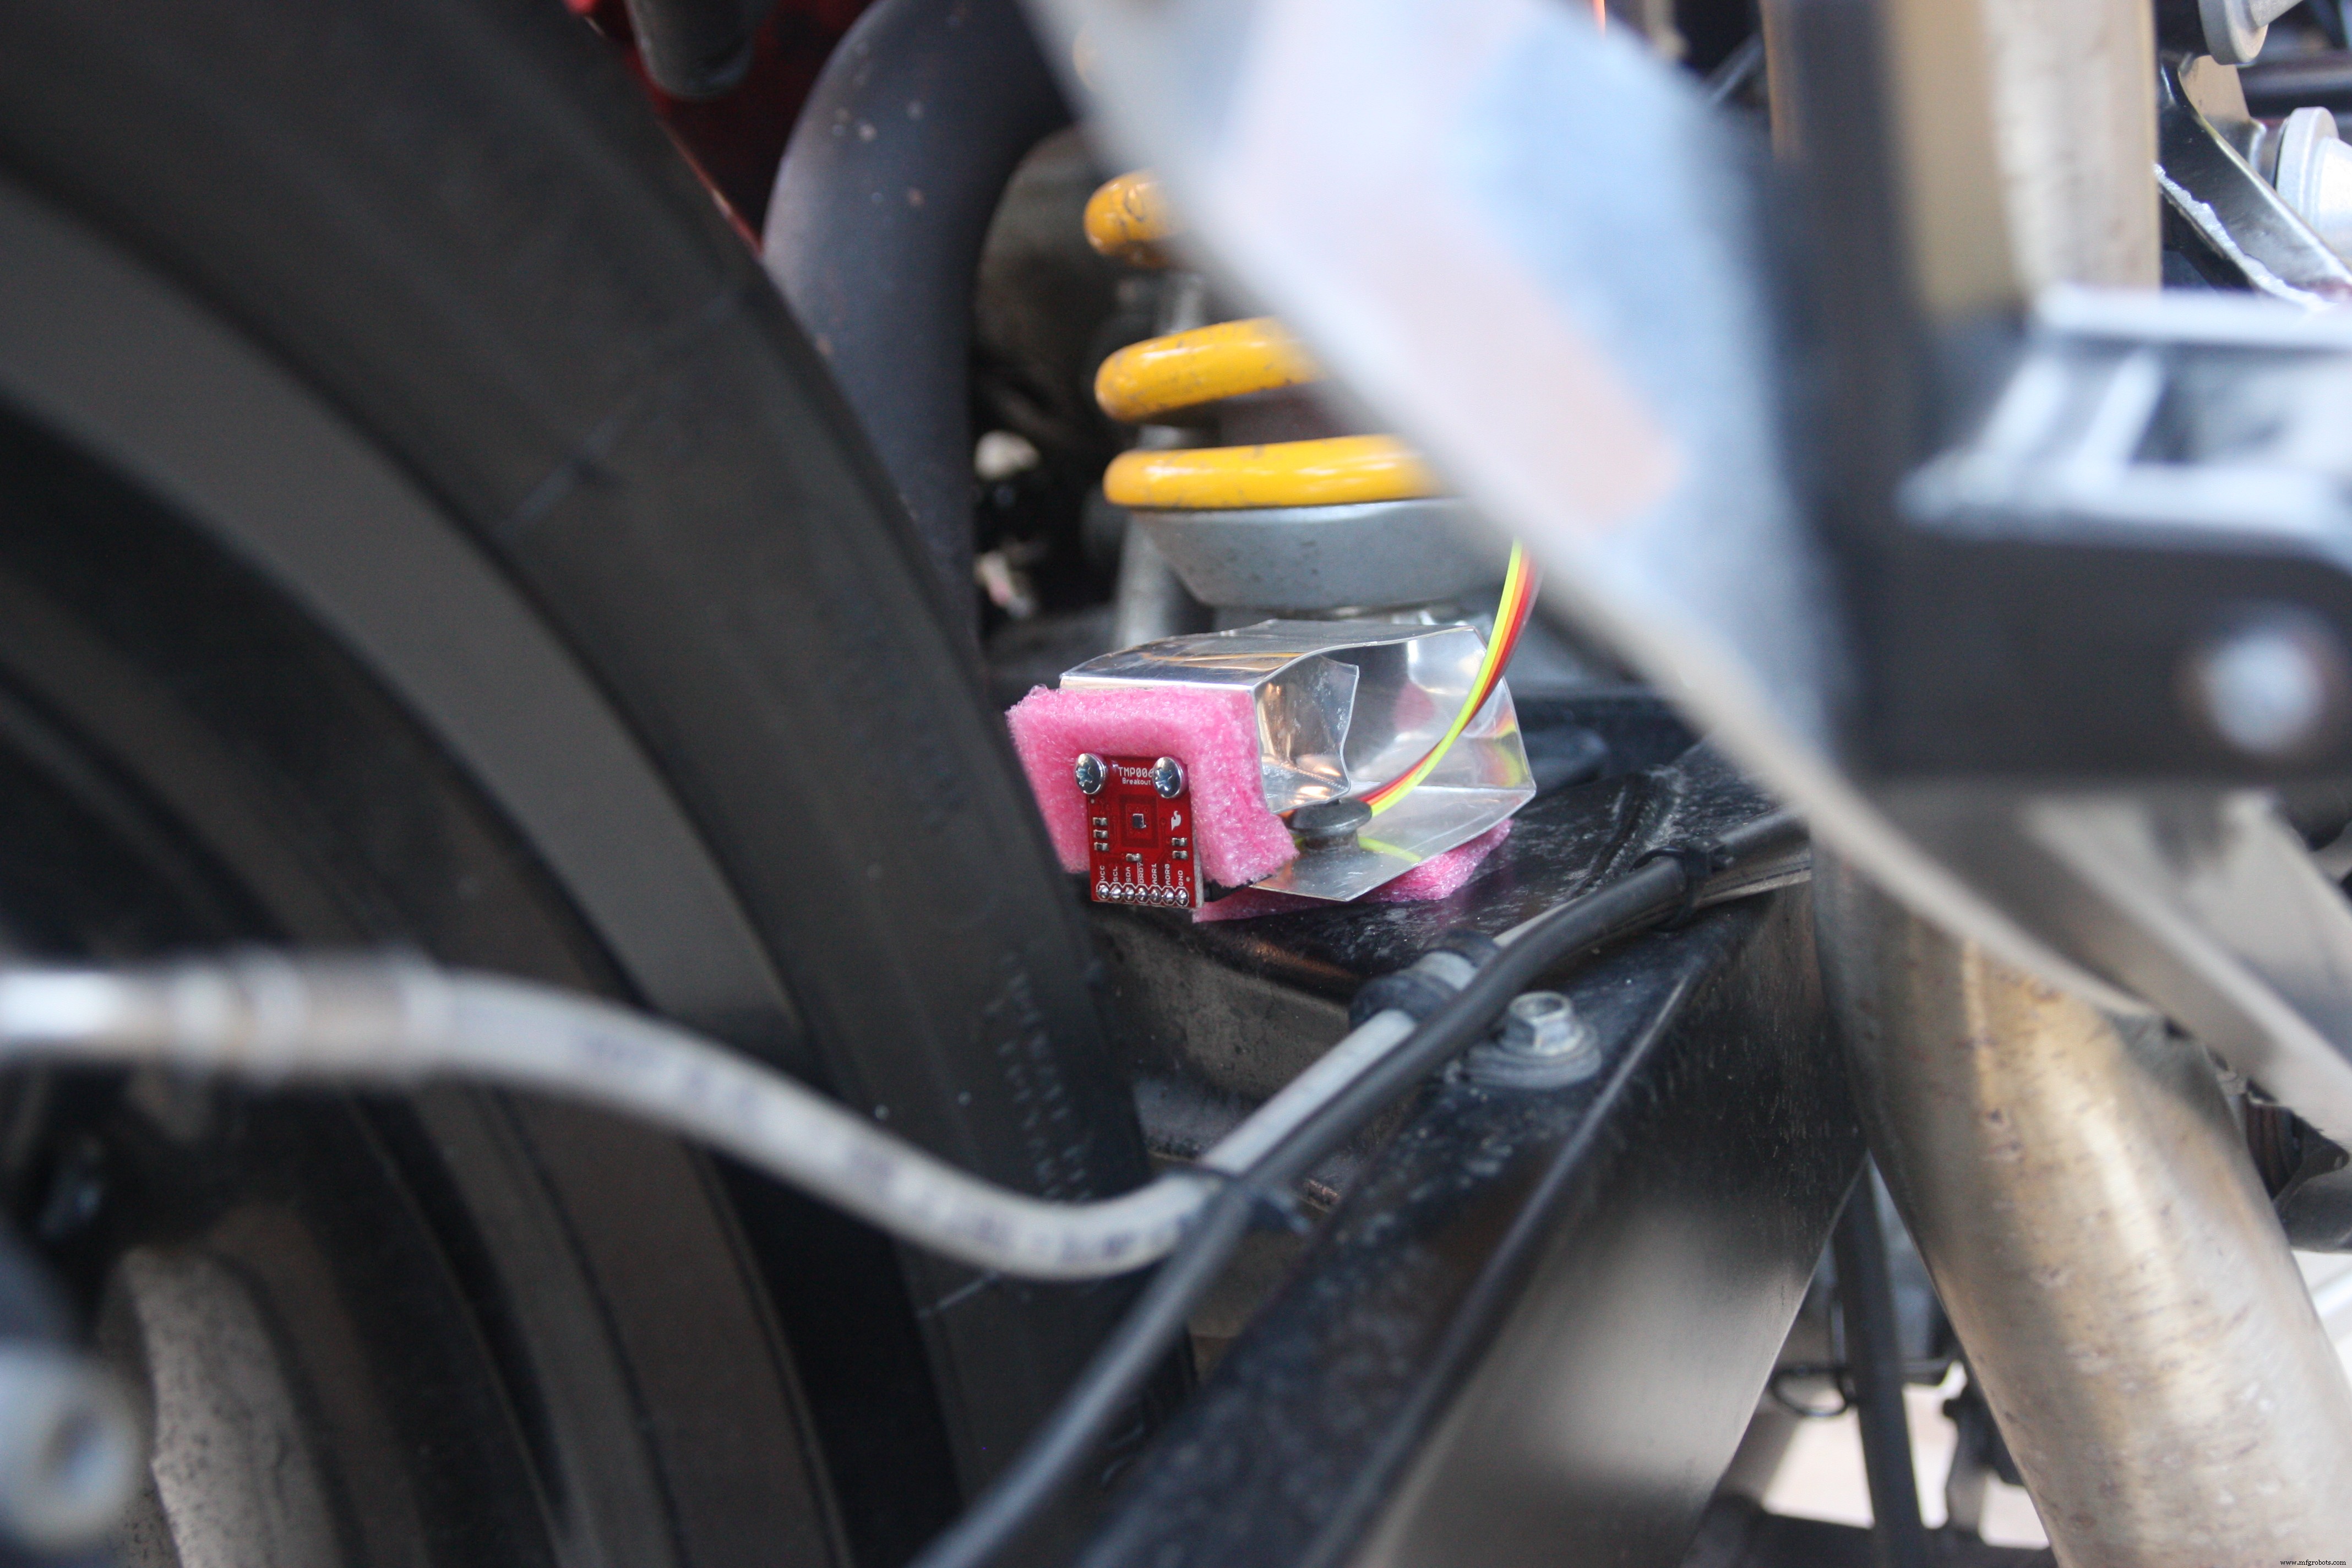
타이어 온도를 결정하기 위해 명백한 이유로 타이어에 닿지 않는 센서가 필요했습니다. 독특한 방법은 적외선 온도 센서를 사용하는 것이었습니다. 이를 위해 TMP006을 사용하기로 결정했습니다. 센서
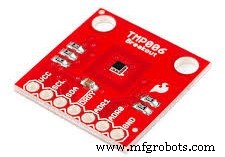
TMP006은 직접 접촉할 필요 없이 물체의 온도를 측정하는 완전히 통합된 MEM 열전퇴 센서입니다. 열전퇴는 4um 파장의 물체에서 수동 적외선 에너지를 흡수합니다. ~ 16음 최종 사용자 정의 시야 내에서.
열전퇴의 해당 전압 변화는 디지털화되고 I2C를 통해 온칩 다이 열 센서 측정으로 보고됩니다.
이제 문제는 센서를 어디에 배치해야 합니까? 데이터시트를 보면 센서와 물체 사이의 권장 거리에 대한 중요한 정보를 찾을 수 있습니다.
거리는 물체의 입체각의 반지름의 절반보다 작아야 한다는 규칙을 준수해야 합니다.
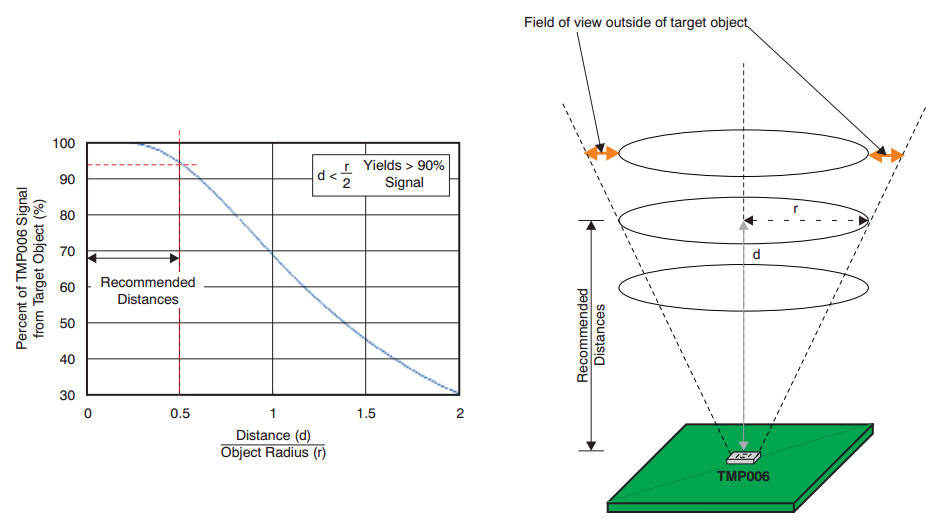
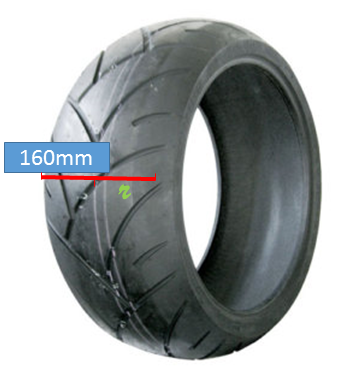
즉, 내 타이어 너비는 160mm 이고 절반 너비는 입체각의 반경(R)이 되므로 R의 최종 결과는 80mm가 됩니다. 따라서 권장 거리는 40mm입니다. (또는 그 이하), R/2와 같음
Arduino와 TMP006 간의 통신 SerialSoftware 를 사용하여 만들어집니다. 라이브러리 및 Adafruit_TMP006.h 라이브러리
#include #include "Adafruit_TMP006.h"/TMP006 함수용 변수************************* **************/Adafruit_TMP006 tmp006;void setup(){}void loop(){// 읽기 객체 IR 온도 float objt =tmp006.readObjTempC();// 센서 온도 읽기( 외부 온도) 플로트 다이어트 =tmp006.readDieTempC();} 5단계 - 외부 온도
외부 온도 값은 LM35 를 사용하여 결정되었습니다. 센서(DT 패키지).
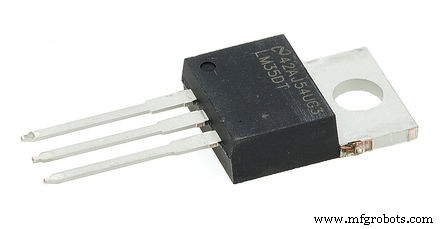
LM35 시리즈는 섭씨 온도에 선형적으로 비례하는 출력 전압을 갖는 정밀 집적 회로 1 온도 장치입니다.
각 섭씨 온도는 10mV의 증가/감소 전압을 생성합니다.
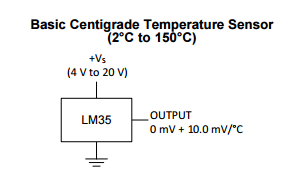
Arduino 아날로그 입력(AI)을 읽는 센서 값이 결정되었습니다.
int TempExtPin =A1; // 입력 핀 선택 float celsius =0, farhenheit =0; // 온도 변수float 밀리볼트; int 센서;[...]센서 =analogRead(TempExtPin); //LM35 값 읽기 밀리볼트 =( 센서 / 1023.0) * 5000; //밀리볼트 출력 Voltagecelsius =밀리볼트 / 10; 6단계 - 초음파 위치
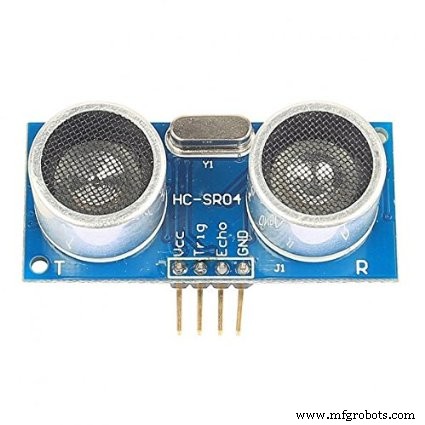
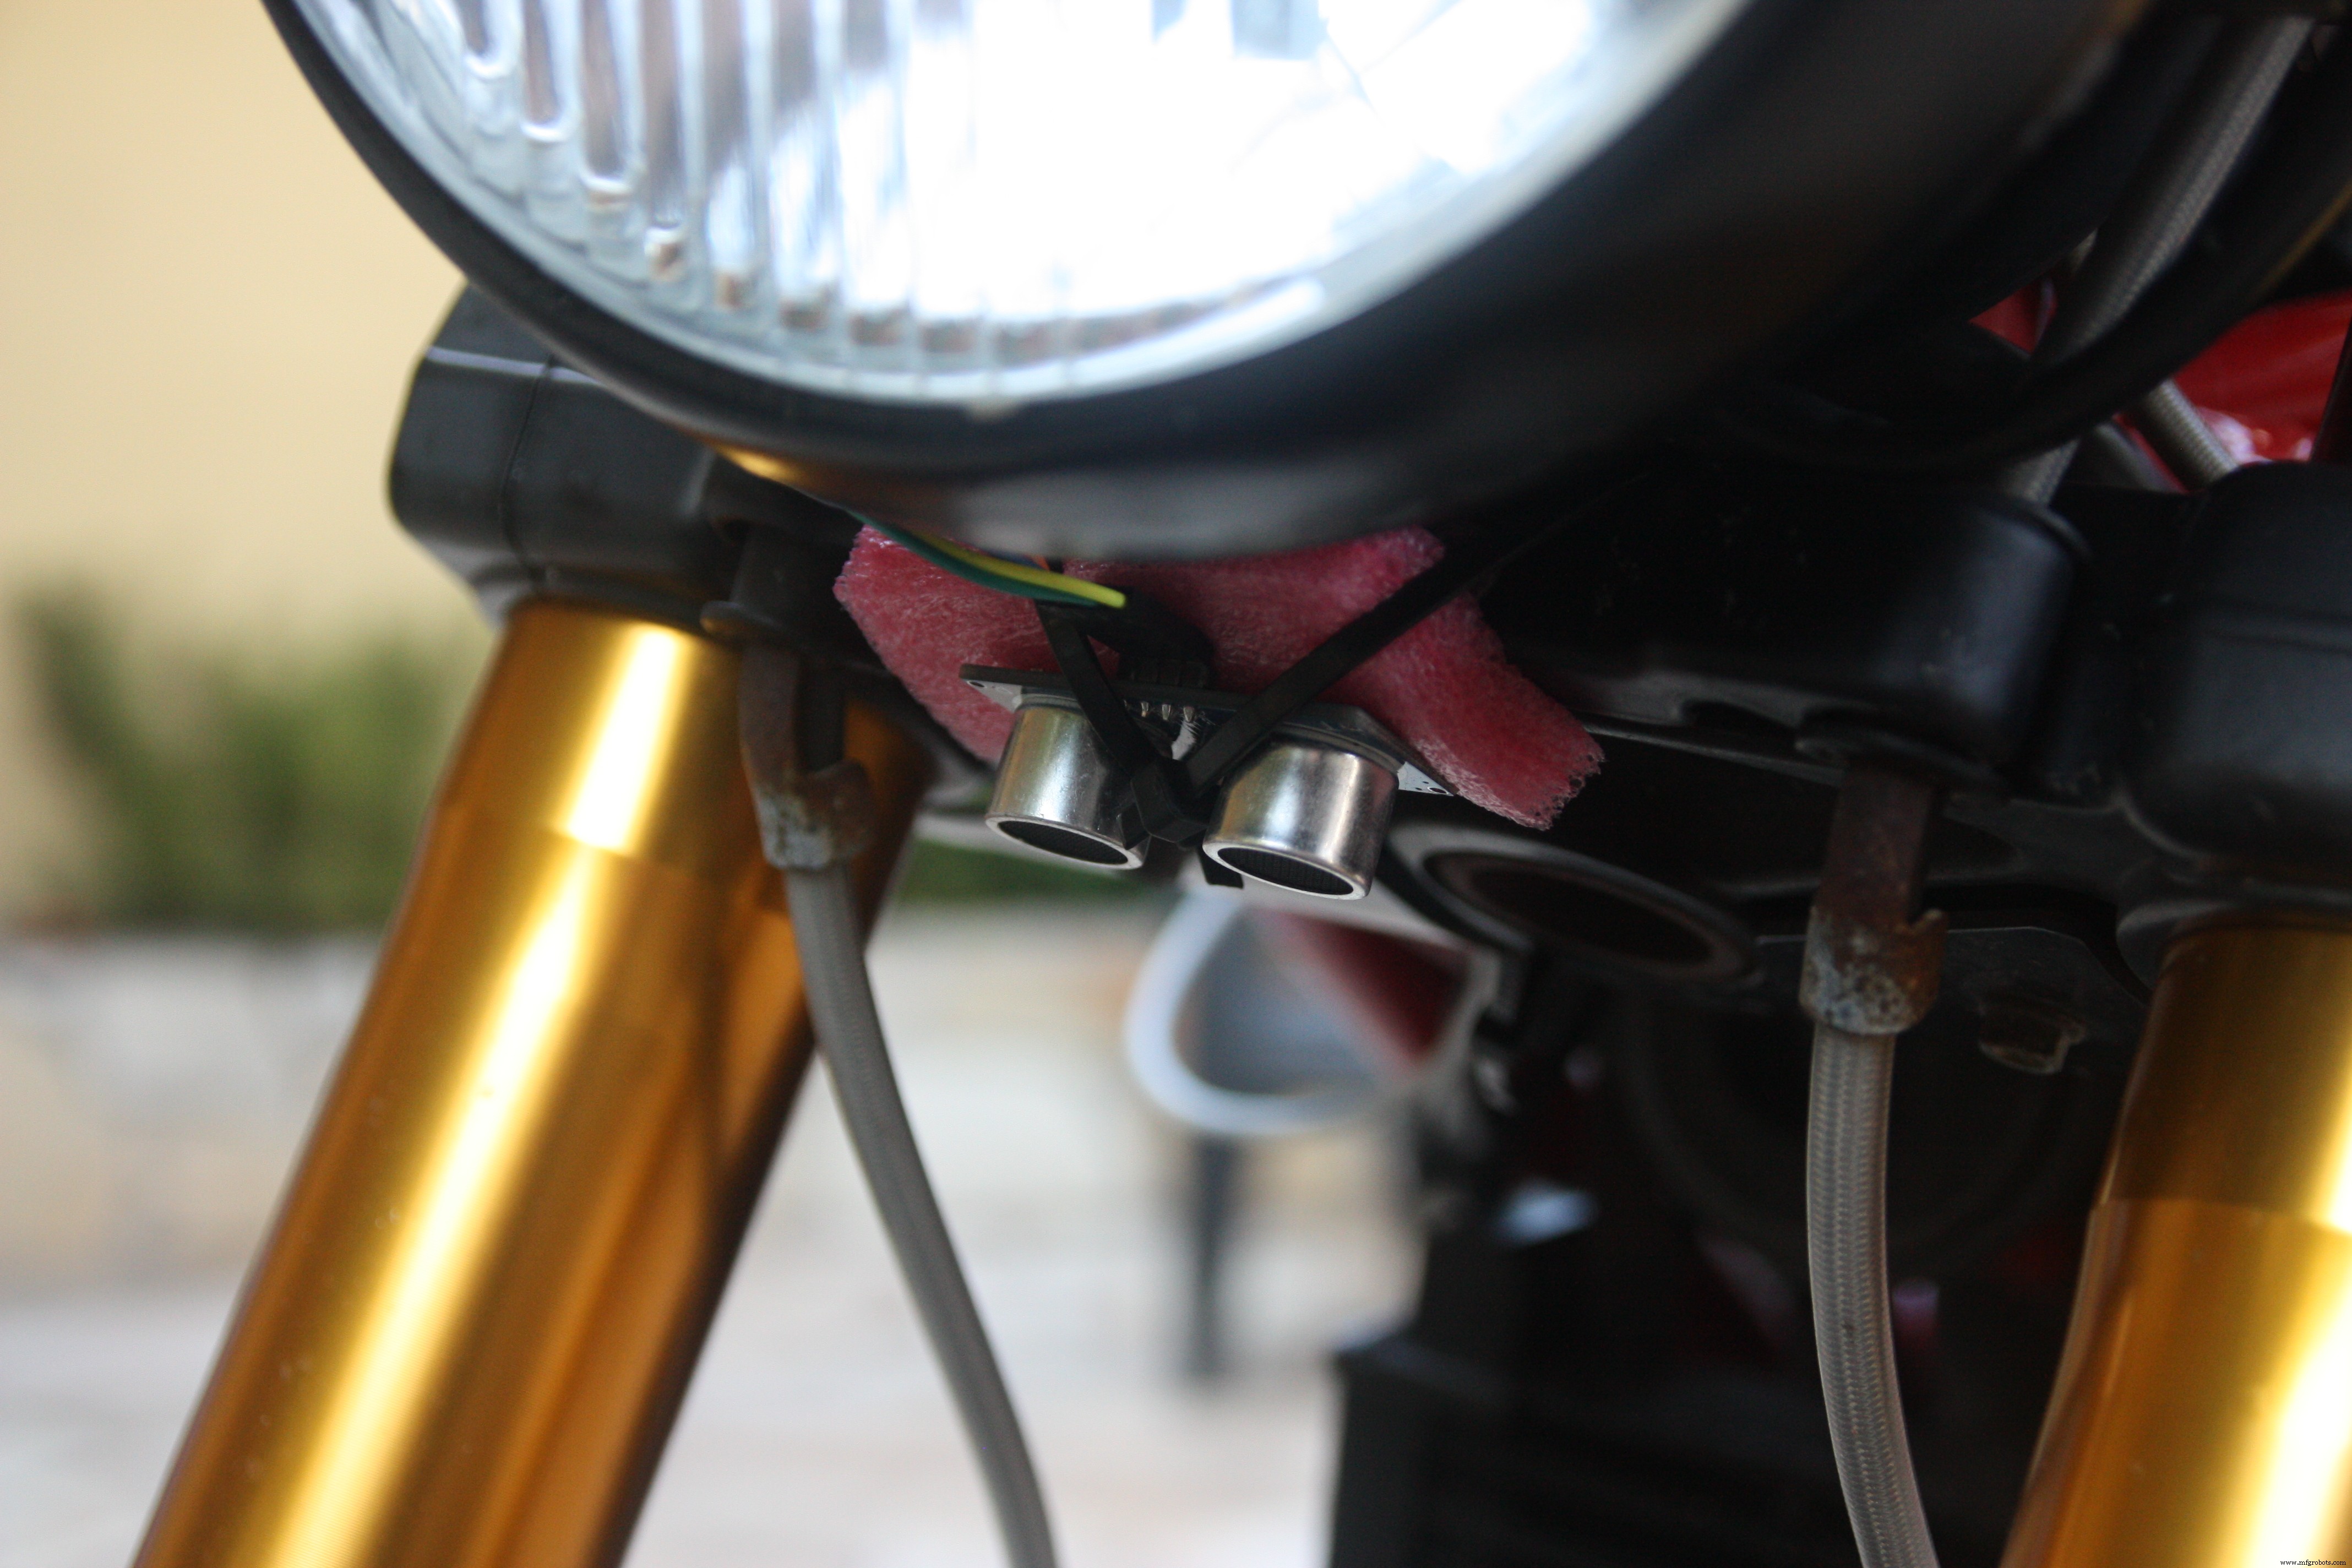
이 센서를 사용하는 목적은 오토바이 서스펜션의 이탈을 결정하는 것입니다.

HC-SR04 음파가 장애물을 만난 후 되돌아가는 데 걸리는 시간을 측정합니다. 음파 방출빔은 원뿔형으로 장애물로부터 반사된 파장도 마찬가지입니다.
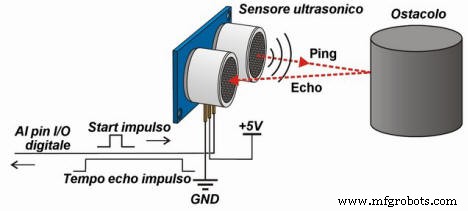
20°C에서 공기 중 음파 속도는 약 343.4m/s입니다. 이 예에서는 간단하게 340m/s의 대략적인 값을 고려할 것입니다. .
기구학 법칙 S=V x t 고려 (여기서 S:물체의 공간 또는 변위, V:속도, t:시간) 우리의 경우 거리가 S=0.034 x T임을 알릴 수 있습니다. .
우리가 변환한 시간은 파도에 의해 왔다갔다 하는 시간이기 때문에 시간을 2로 나누어야 합니다. 마지막 공식은 t입니다. cm/마이크로초 단위의 센서에서 반환된 시간입니다. 입니다:
S=0.034 x t/2
아래에서 물체의 거리를 결정하는 데 사용할 수 있는 예를 볼 수 있습니다.
digitalWrite( triggerPort, LOW );// triggerdigitalWrite( triggerPort, HIGH );delayMicroseconds(10);digitalWrite(triggerPort, LOW);long duration =pulseIn( echoPort, HIGH );long r에 10마이크로초 펄스를 보냅니다. =0.034 * 기간 / 2; 위의 코드는 센서의 작동 방식을 잘 설명하고 있지만 이 코드가 매우 느리고 성능이 좋지 않습니다. .
이 프로젝트를 위해 NewPing.h라는 새 라이브러리를 사용하기로 결정했습니다. 자세한 내용은 이 링크를 방문하여 프로젝트의 전체 Arduino 코드를 참조하십시오.
NewPing.h 사용 라이브러리는 매우 쉽습니다.
<울>#include /************************************ *******HC RS04 기능에 대한 변수 정의**************************************** ******/// HC-RS04 포트 int triggerPort =2;int echoPort =3;// 핀의 NewPing 설정 및 최대 거리NewPing sonar(triggerPort, echoPort, 200);void setup(){}void loop() {/*** 읽기 위치 ***/int Pos=ReadPositionPing();}int ReadPositionPing(){unsigned int uS =sonar.ping();return sonar.convert_cm(uS);}
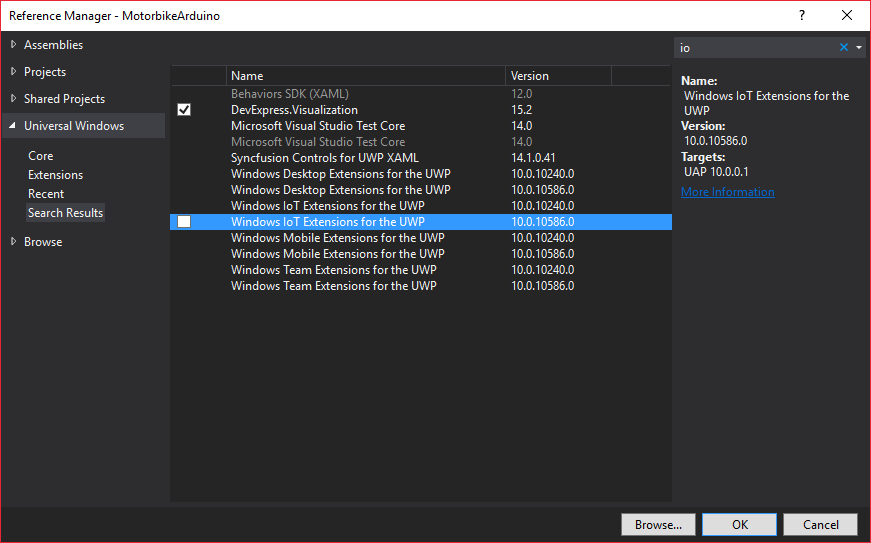
UWP 소프트웨어
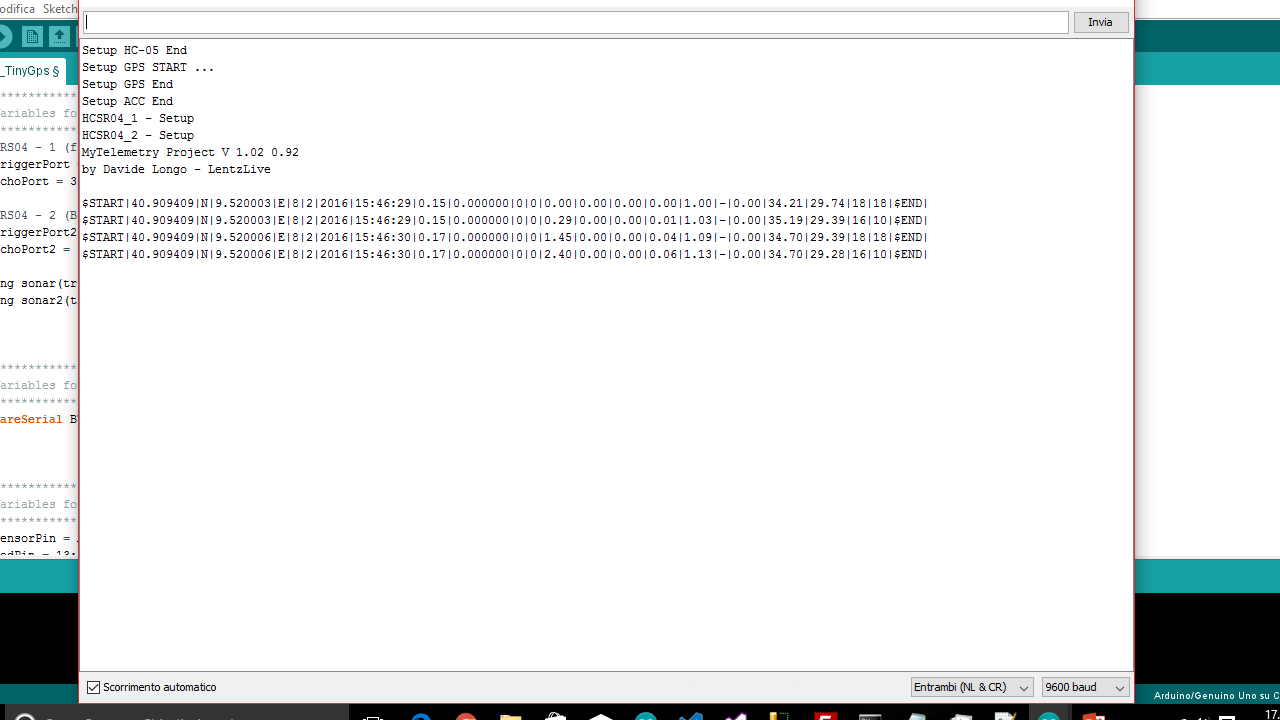
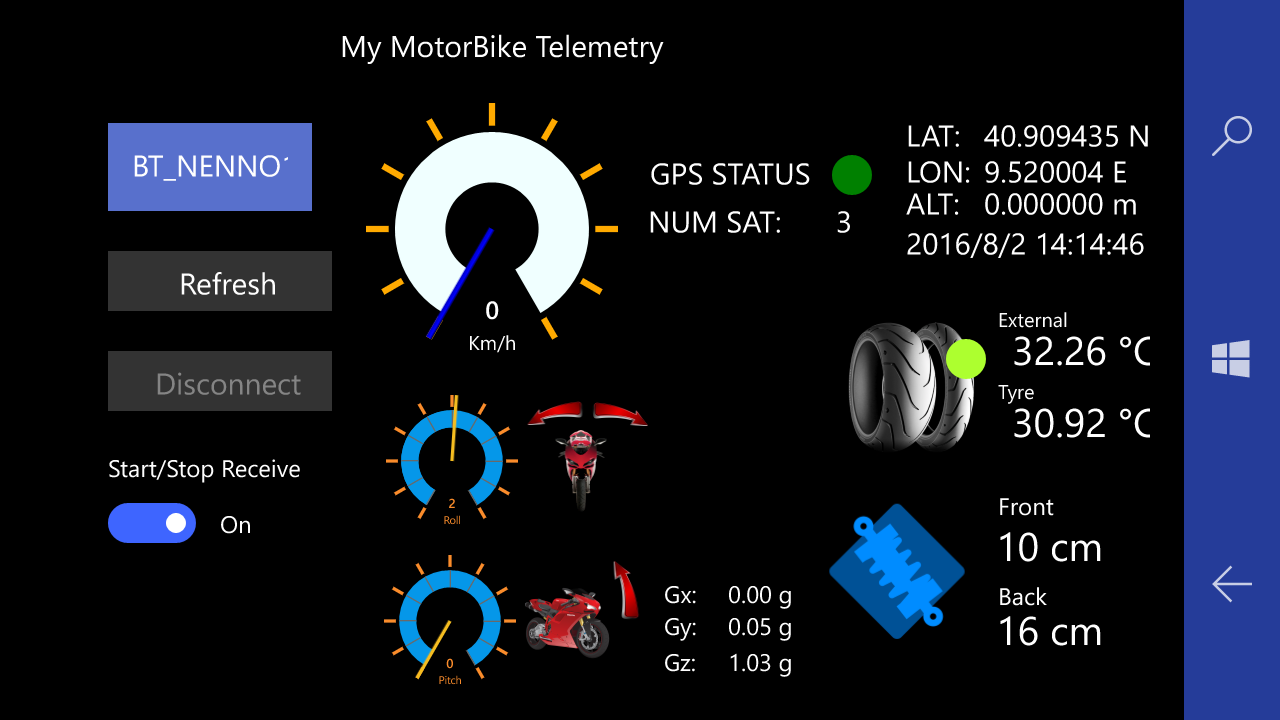
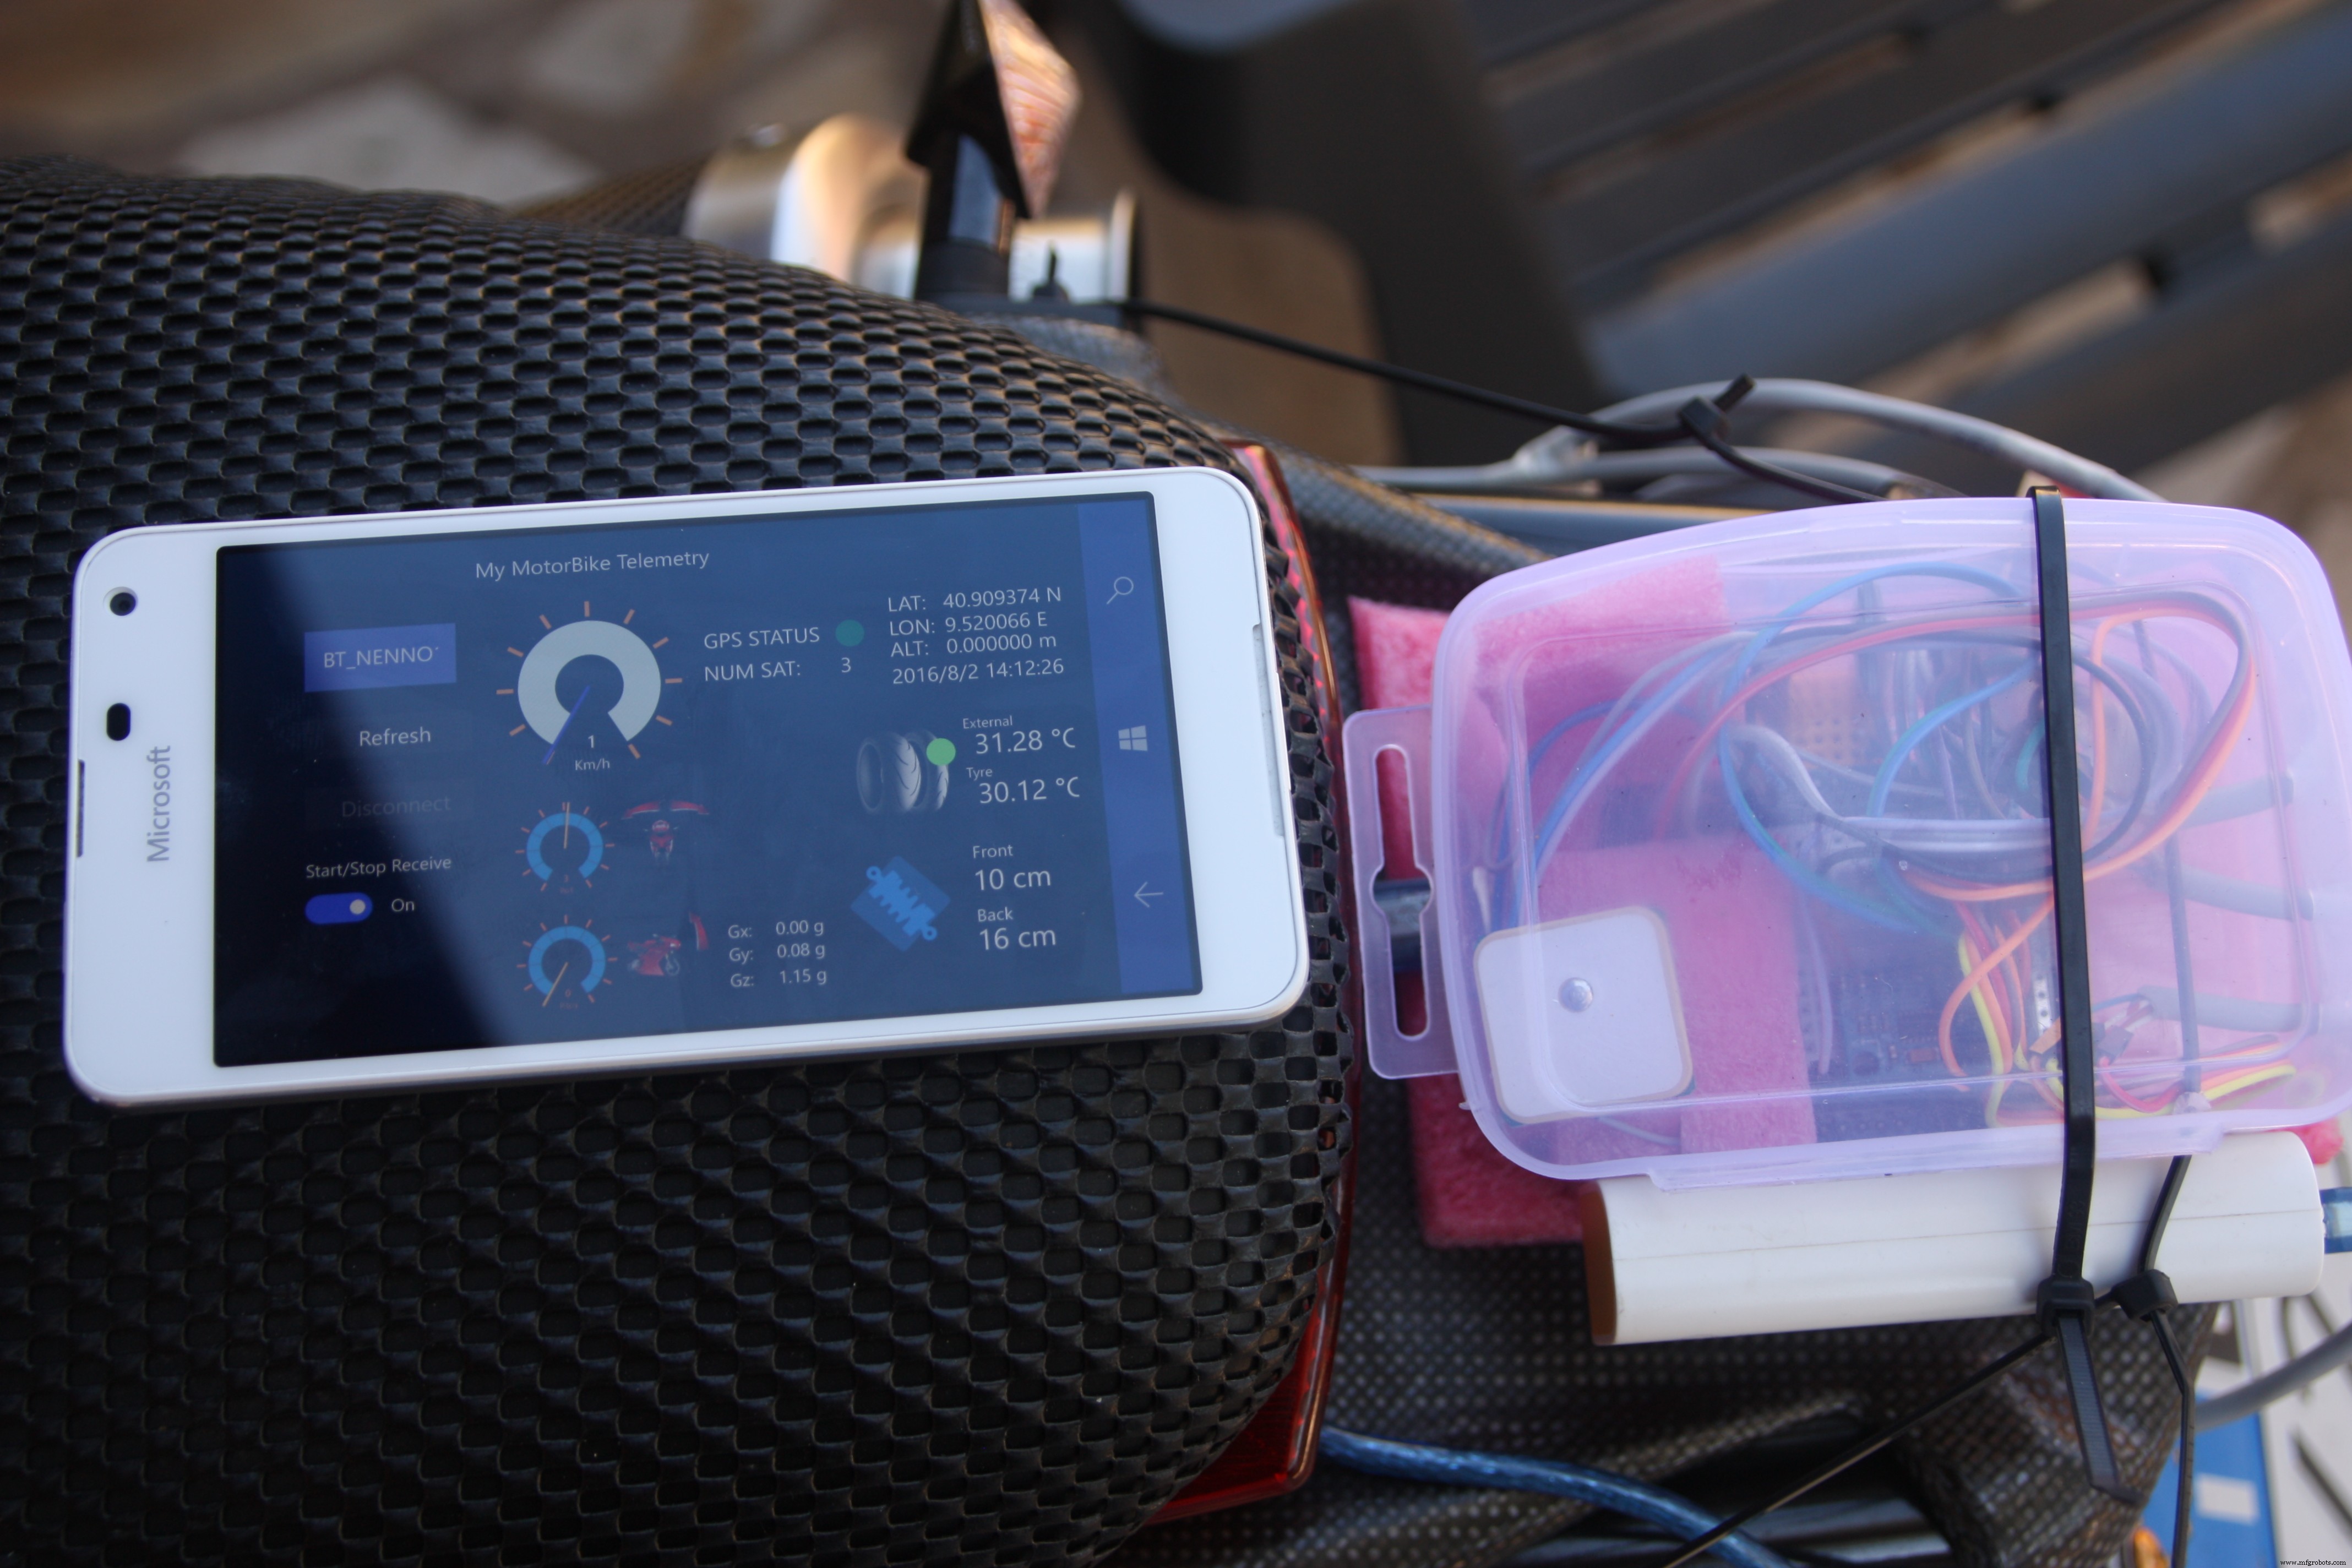
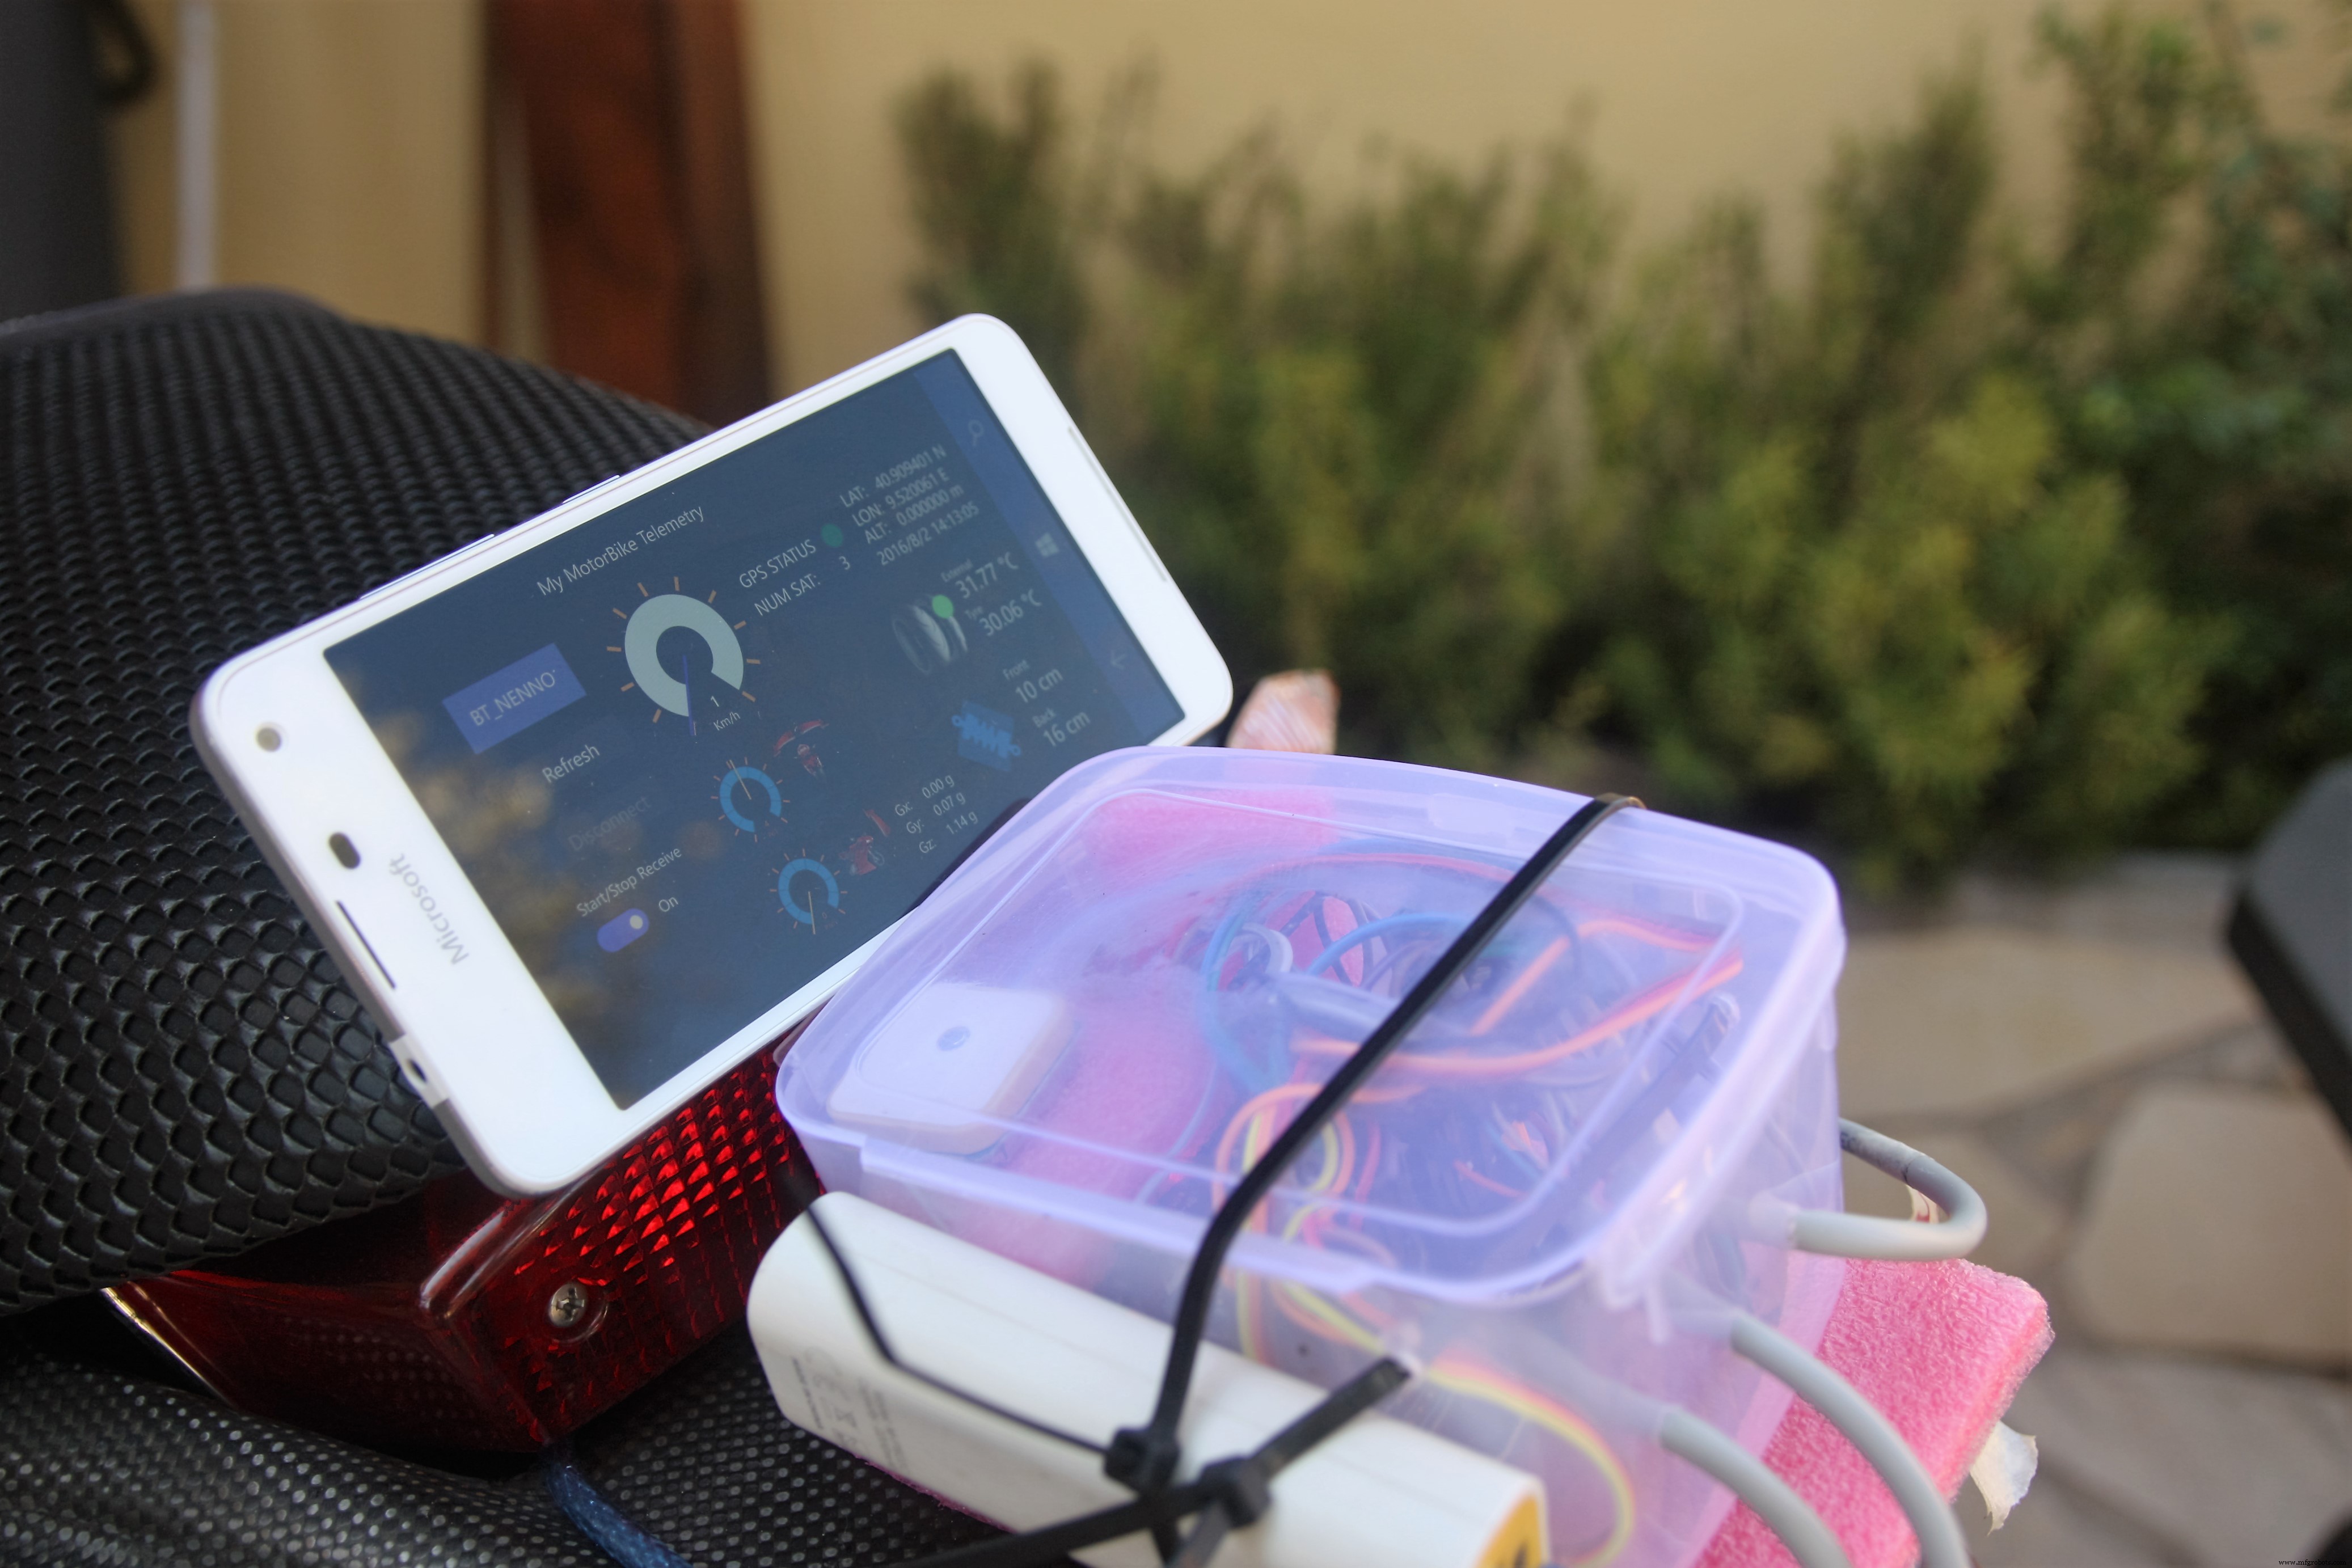
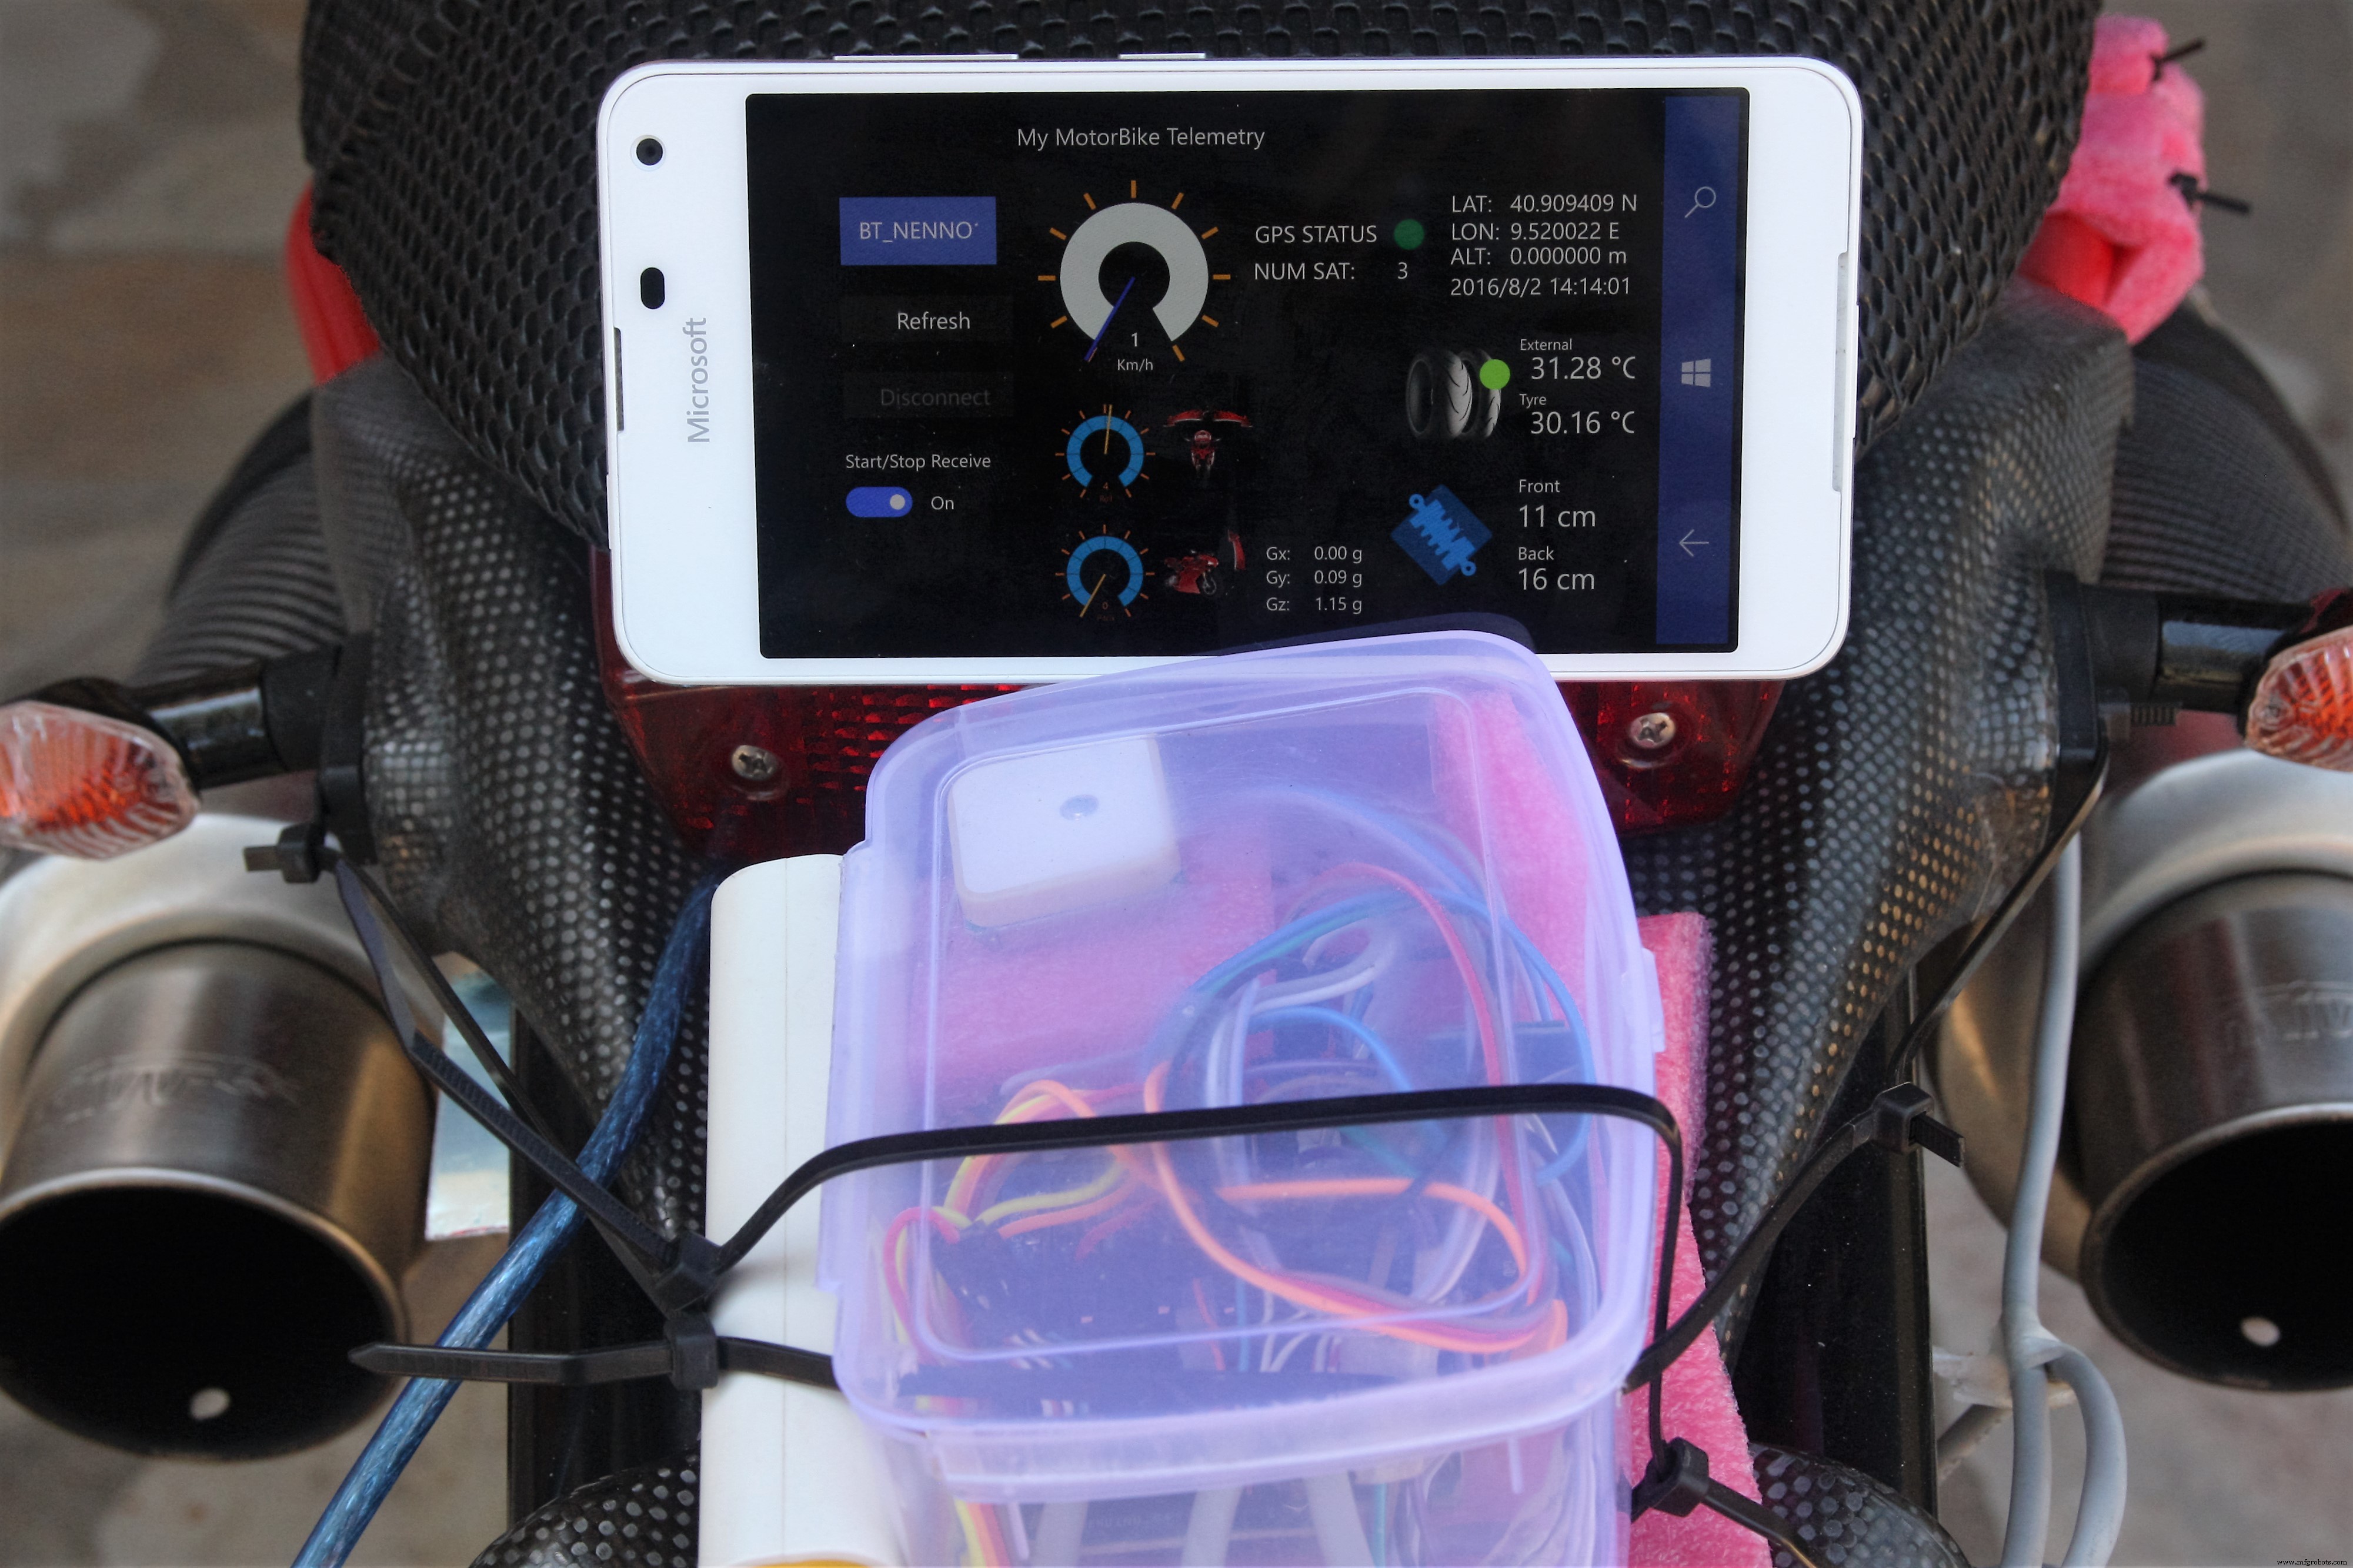
소프트웨어는 블루투스를 통해 제어 장치에 연결된 사용자 인터페이스로 구성됩니다. UI는 Arduino에서 보낸 모든 데이터를 표시하고 IoTHub 로 보냅니다. 센서 값.
Arduino와 UWP 간의 직렬 통신은 입력 문자열을 읽어서 해석됩니다.
각 문자열 수신된 START 그리고 END 마커. 입력 문자열의 형식이 올바른 경우 응용 프로그램은 정보를 뱉어내고 응용 프로그램 사용자 인터페이스에 표시합니다.
아래에서 START/END 마커가 포함된 Arduino에서 보낸 문자열의 예를 볼 수 있습니다. 이 문자열은 각 센서 값을 결정하기 위해 "파이프" 문자로 분할됩니다.
<코드>$START|40.909409|N|9.520008|E|8|2|2016|15:46:42|0.09|0.000000|0|0|-0.21|0.00|0.00|-0.02|0.98|-|0.0 35.19|29.58|16|10|$END|
전송된 문자열 분할 후 배열 정의 아래:
<울>Arduino IDE의 "직렬 모니터"를 통해 Arduino 코드가 어떻게 작동하는지 확인할 수 있습니다.
Bluetooth를 통해 중앙 장치에서 전송된 모든 데이터를 관리하기 위해 UWP의 성능을 보여주는 좋은 예인 유니버설 Windows 응용 프로그램을 개발했습니다. 아시다시피 UWP는 Windows 10이 탑재된 모든 장치 제품군에서 응용 프로그램을 실행할 수 있는 플랫폼입니다.
사용자 인터페이스는 매우 간단하고 직관적입니다. 왼쪽에서 Bluetooth 연결 기능을 볼 수 있으며 중간에 속도, 기울기 각도 및 Wheelie 각도를 표시하는 데 사용되는 3개의 게이지를 볼 수 있습니다. 모든 G 구성 요소가 표시되고 오른쪽에는 GPS 위치, 온도 및 충격 흡수 장치에 대한 정보가 표시됩니다.
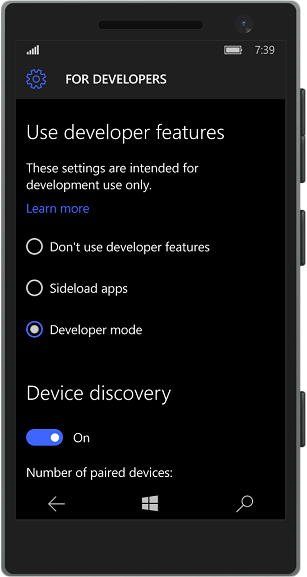
Windows 10 Mobile에 앱을 배포하는 방법은 무엇입니까?
Microsoft는 Windows 10 SDK Preview Build 10166을 통해 Windows 10 애플리케이션 배포(WinAppDeployCmd.exe) 도구를 도입했습니다.
Windows 10 응용 프로그램 배포(WinAppDeployCmd)는 Windows 10 PC에서 Windows 10 모바일 장치로 유니버설 Windows 앱을 배포하는 데 사용할 수 있는 명령줄 유틸리티입니다. 이를 통해 사용자는 전체 Visual Studio 솔루션에 액세스할 필요 없이 USB를 통해 연결되거나 동일한 서브넷에서 사용 가능한 장치에 .AppX 파일을 배포할 수 있습니다.
1단계:
먼저 모바일 장치를 "개발자 모드"로 이동합니다(업데이트 및 보안으로 이동 => 개발자용 ).
그런 다음 USB를 통해 장치를 연결하고 USB 연결이 표시되도록 합니다(PIN 코드가 반환됨)
2단계:
프로젝트를 마우스 오른쪽 버튼으로 클릭합니다. =>저장 =>앱 패키지 만들기
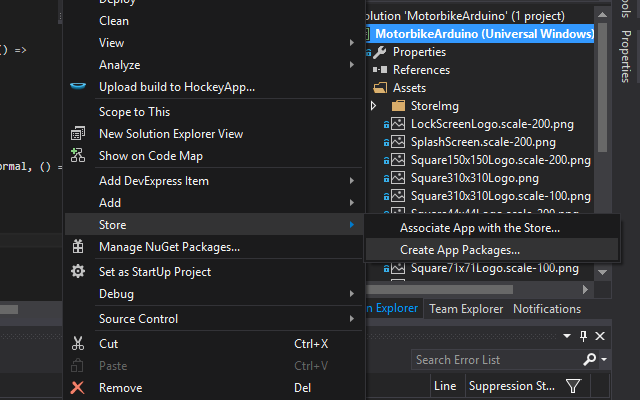
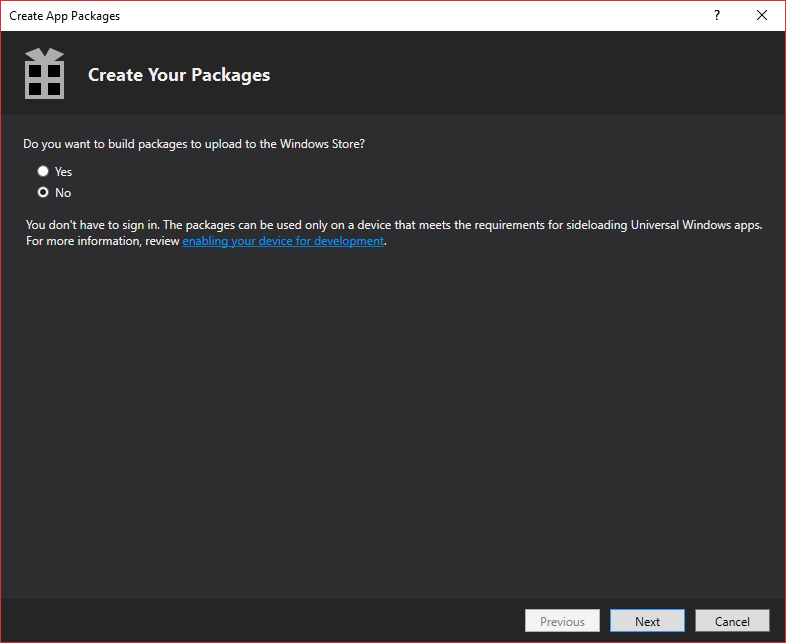
3단계:
앱 패키지 만들기 마법사에서 아니요 를 선택합니다. 로컬 패키지를 만들고 다음을 클릭하려면 . 그런 다음 대상으로 할 프로세서 플랫폼을 선택합니다. 우리의 목적을 위해 ARM 플랫폼을 선택하고 CREATE를 클릭합니다. .
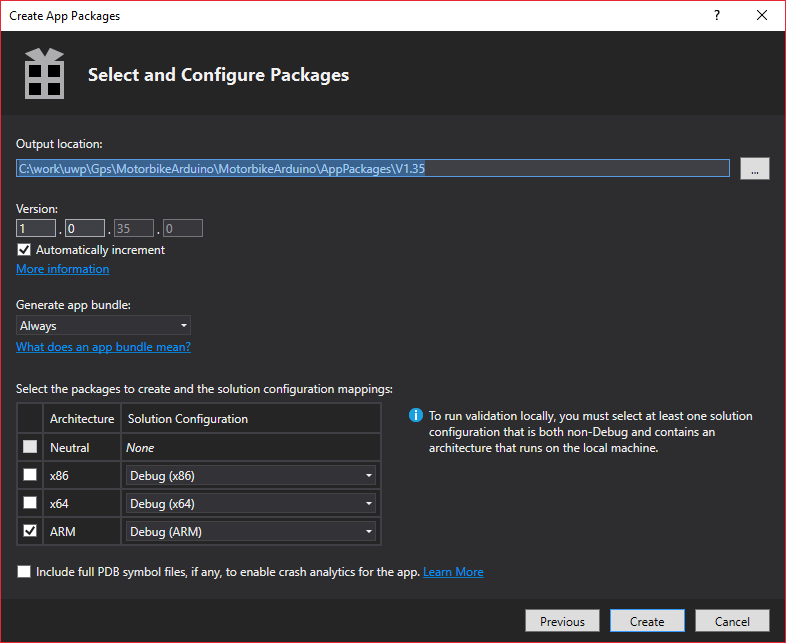
생성 프로세스가 끝나면 마법사는 패키지가 생성된 로컬 URL을 제공합니다.
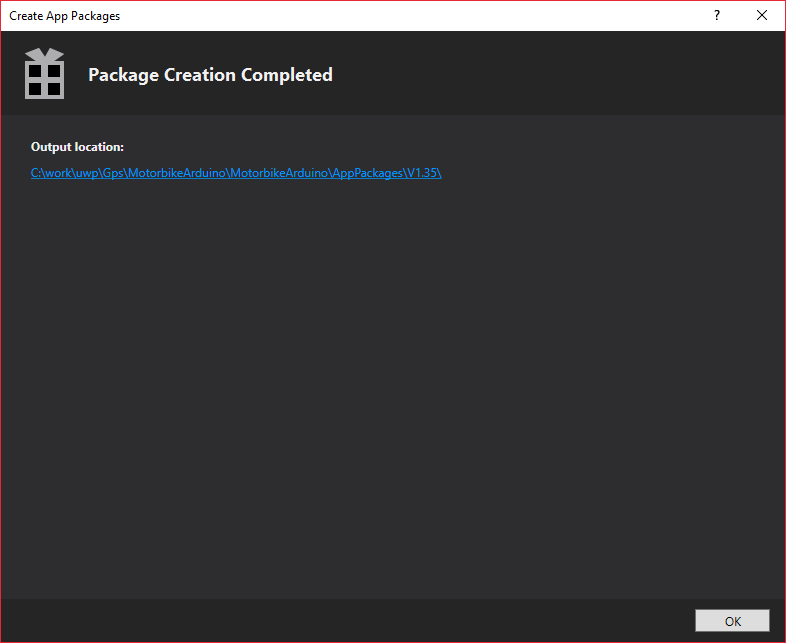
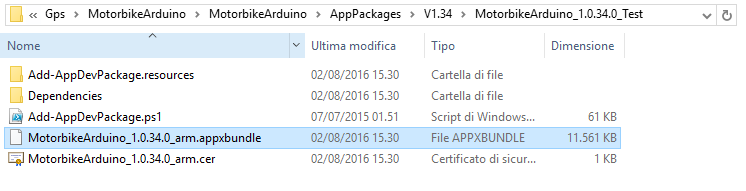
URL을 열면 장치에 배포할 수 있는 Appx 파일을 찾을 수 있습니다.
4단계:
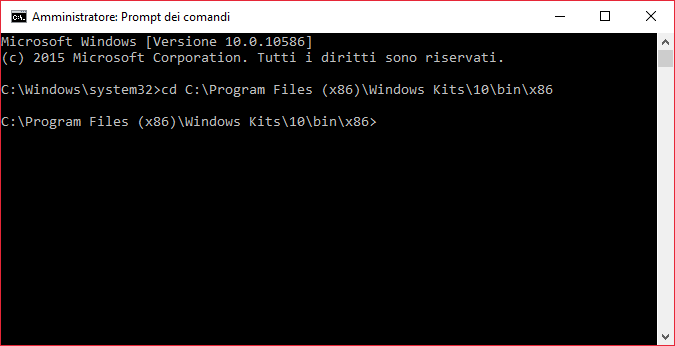
명령 프롬프트를 열고 포커스를 C:\Program Files (x86)\Windows Kits\10\bin\x86\
으로 이동합니다.다음 명령줄을 입력하십시오.
WinAppDeployCmd 설치 - 파일 "C:\work\uwp\Gps\MotorbikeArduino\MotorbikeArduino\AppPackages\V1.35\MotorbikeArduino_1.0.35.0_Debug_Test\MotorbikeArduino_1.0.35.0_arm_Debug.pin.0.0bundle -" 코드> AAA123
(여기서 AAA123 연결 모드에서 USB에 연결된 휴대전화에서 반환된 핀 코드입니다.
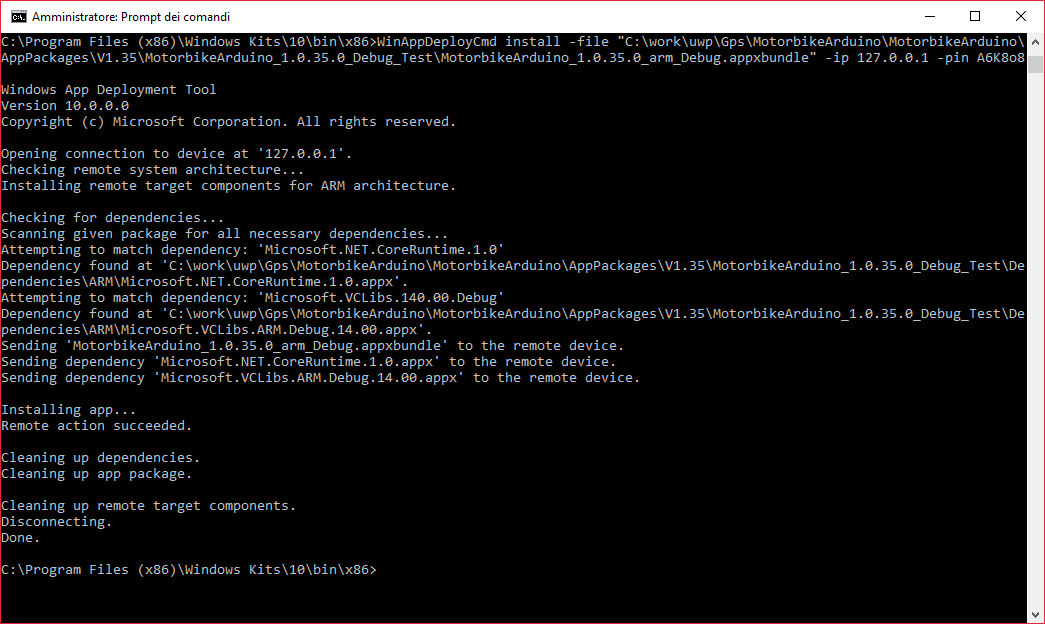
프로세스가 끝나면 애플리케이션이 기기에 설치되고 "시작하려면 고정"할 수 있습니다.

하늘빛
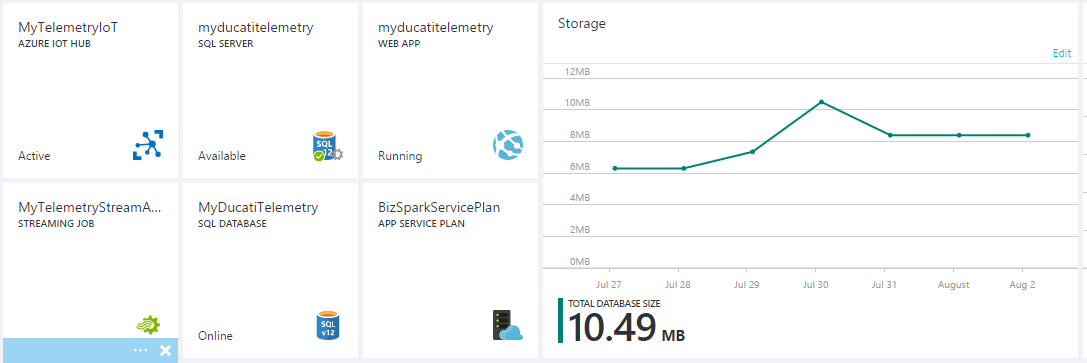
이제 Azure 서비스를 구성하는 방법을 설명할 준비가 되었습니다. 이 프로젝트의 경우 다음을 생성해야 합니다.
<울>그래 가자! AZURE 계정이 있습니까?
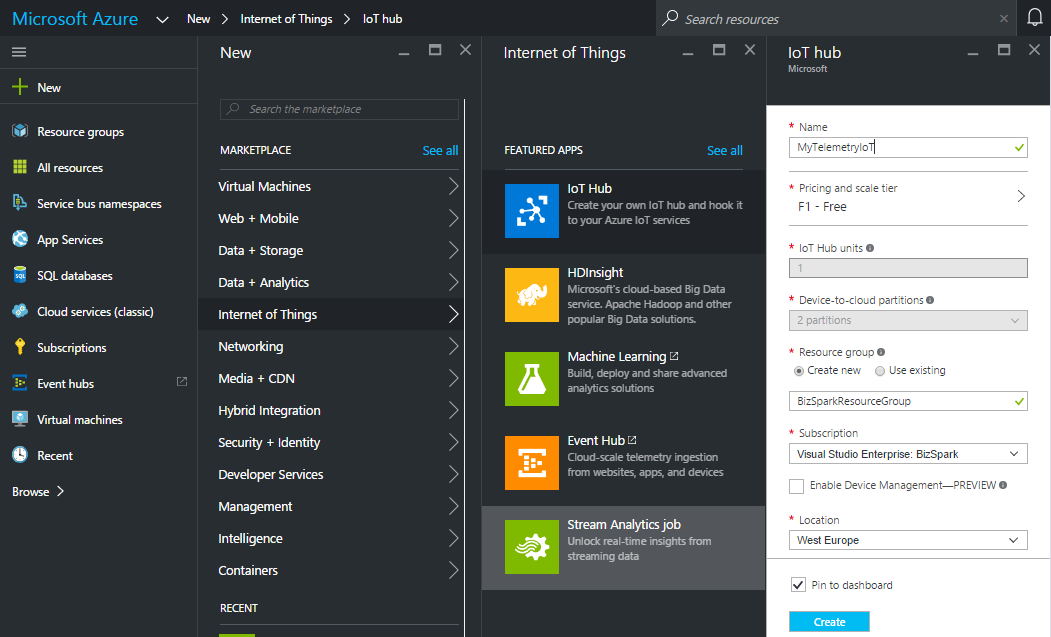
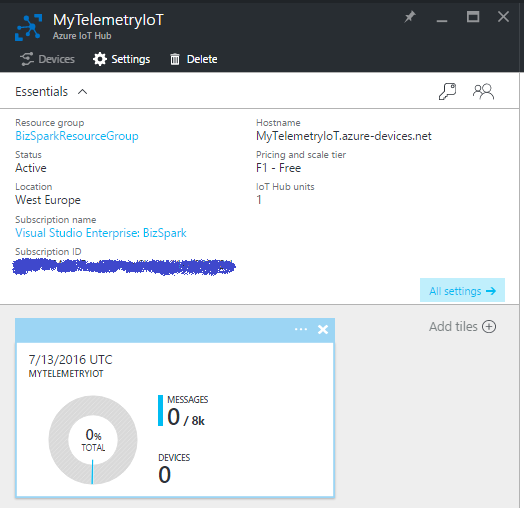
<울>1단계 - IoT Hub 만들기 및 구성:
IoTHUB는 클라우드에 대한 원격 측정 값의 액세스 지점입니다.
IoTHub를 만들고 새로 만들기 를 클릭합니다. => 생각의 인터넷 => IoT 허브 허브 필드를 컴파일하고 만들기를 클릭합니다.
그런 다음 Azure 대시보드에 IoT HUB가 표시될 수 있습니다. 배포하고 몇 초 후에 IoT HUB가 준비됩니다.
대시보드에서 새 타일을 클릭하고 모든 설정 으로 이동합니다. 블레이드.
IoTHub 호스트 이름 보기 메모:
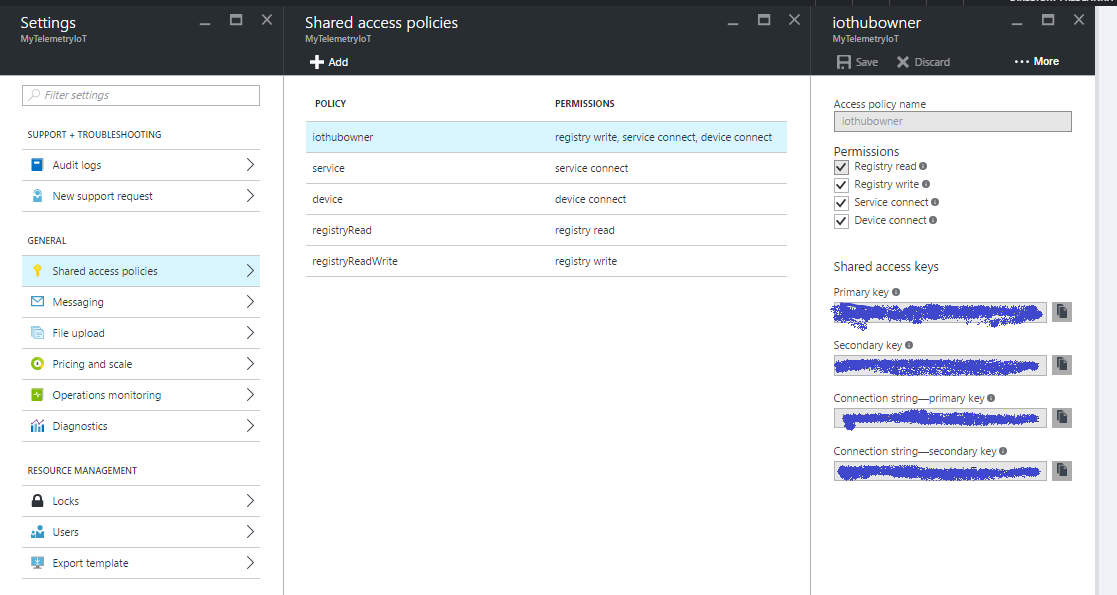
공유 액세스 정책 블레이드에서 iothubowner를 클릭합니다. 정책을 선택한 다음 iothubowner의 연결 문자열을 복사하여 기록해 둡니다. 블레이드
알겠습니다... IoT 허브가 성공적으로 생성되었으며 거의 사용할 준비가 되었습니다!
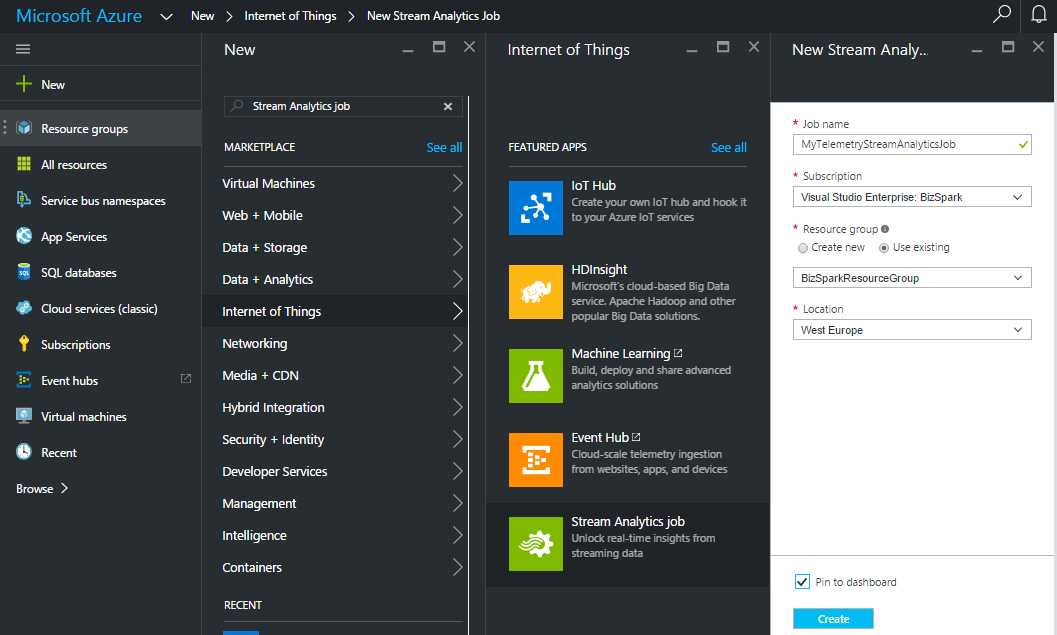
2단계 - 스트림 분석 생성 및 구성
스트림 분석은 IoTHUB에 전송된 모든 데이터를 읽고 쓰고 데이터베이스 테이블에 저장하는 목적을 가지고 있습니다.
새 Stream Analytics 작업 만들기:
새로 만들기 를 클릭하십시오. => 생각의 인터넷 => Stream Analytics 작업
모든 필드를 컴파일하고 만들기 버튼을 클릭하십시오.
이제 입력/출력 및 streamAnalityncs JOB 쿼리를 구성할 준비가 되었습니다.
입력 설정 - 소스 선택 . 이 경우 소스는 IoTHub입니다.
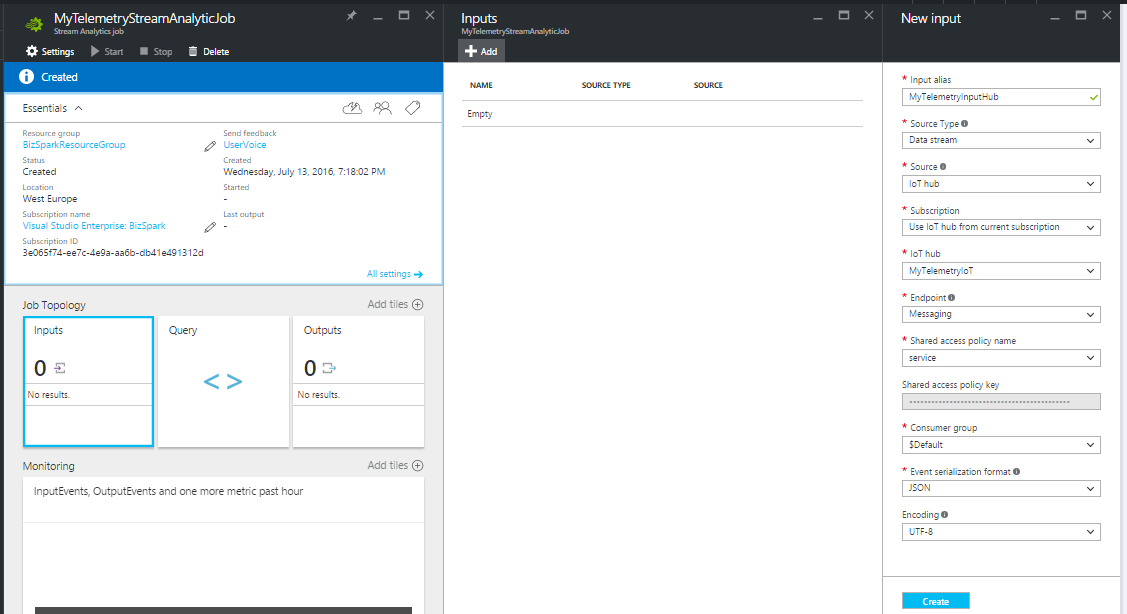
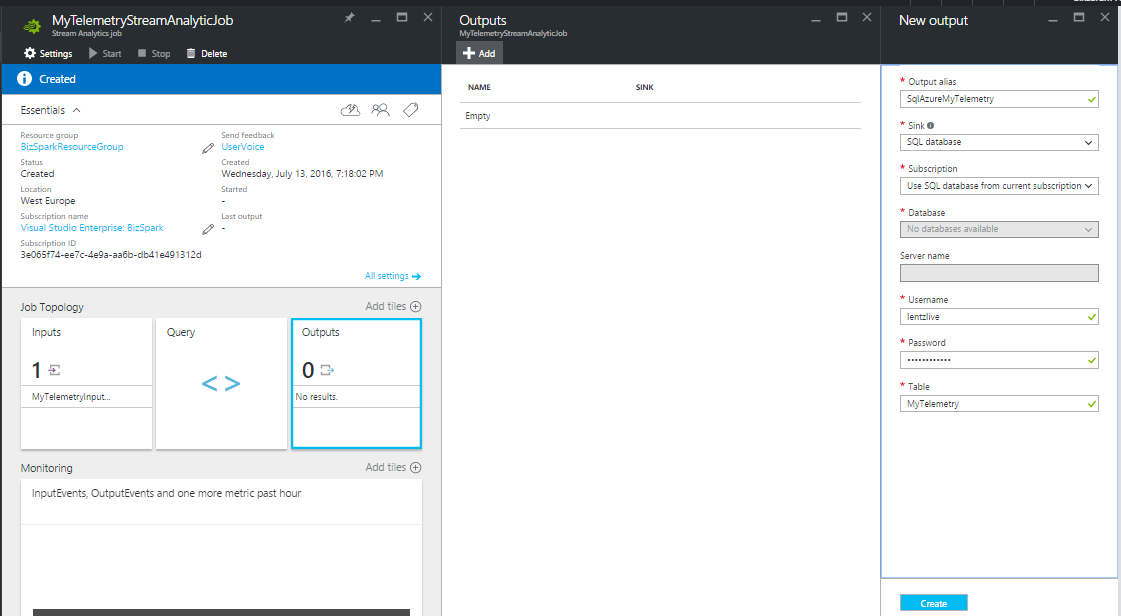
출력 설정 - 대상을 선택합니다. 우리의 경우 출력은 SQL Azure 데이터베이스의 테이블이 됩니다(다음 단계에서 sql db를 생성하는 방법을 보여드리겠습니다)
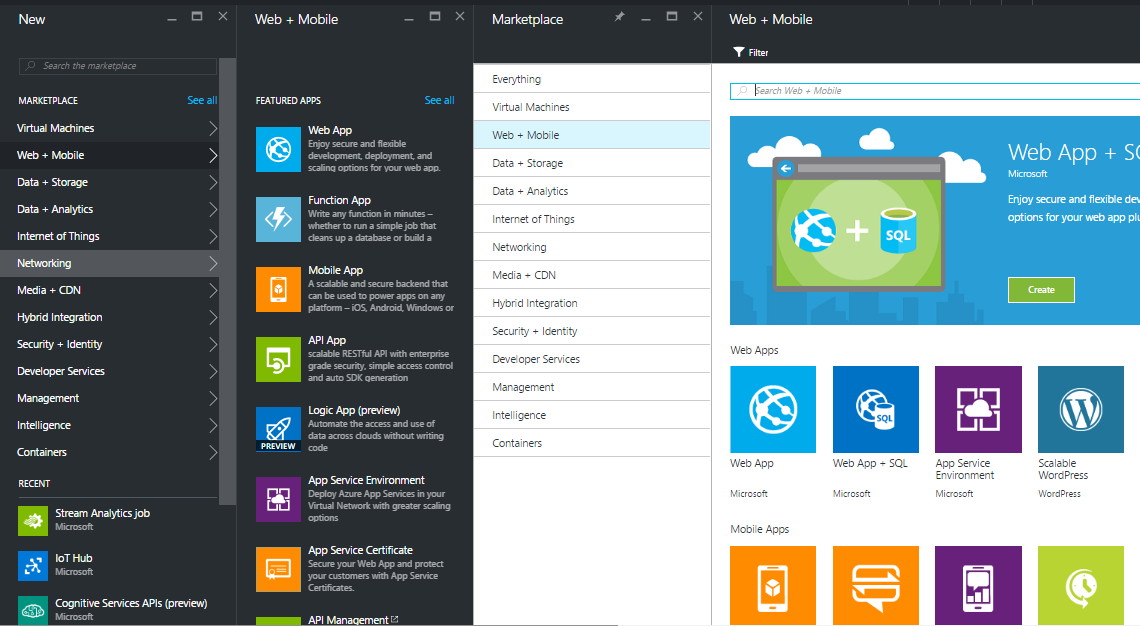
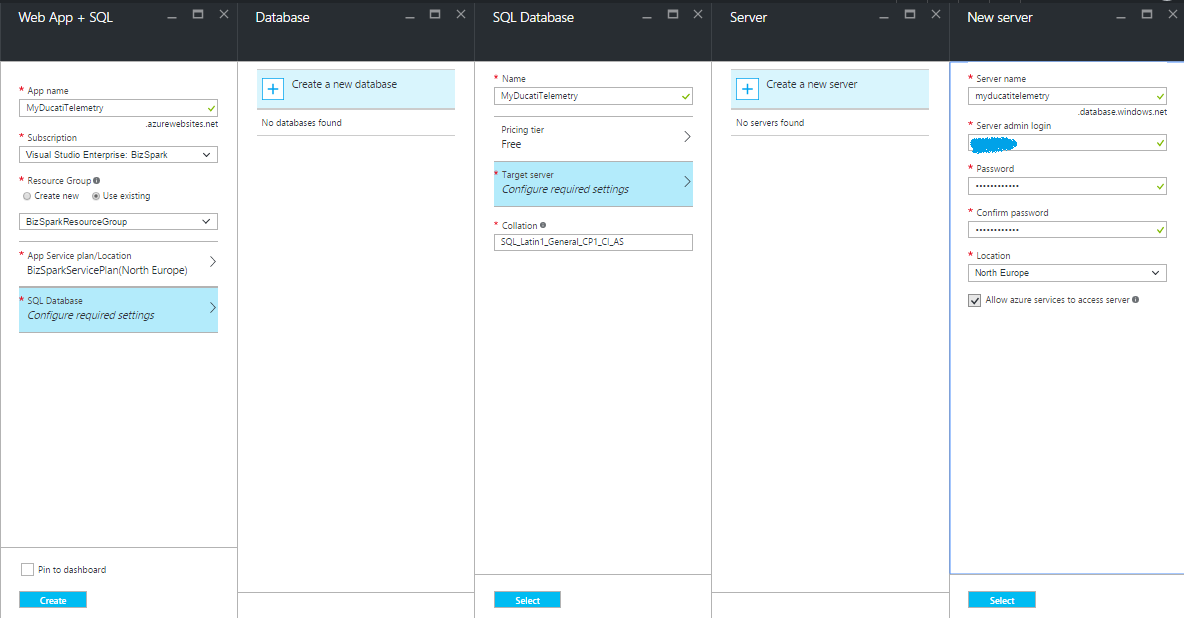
3단계 - WebApp + SQL Azure 만들기
대시보드로 이동하여 WebApp+SQL(새로 만들기 => 네트워킹 => 웹 + 모바일 => 웹 앱 + SQL )
이제 다음 필드를 컴파일하여 웹앱을 구성합니다.
<울>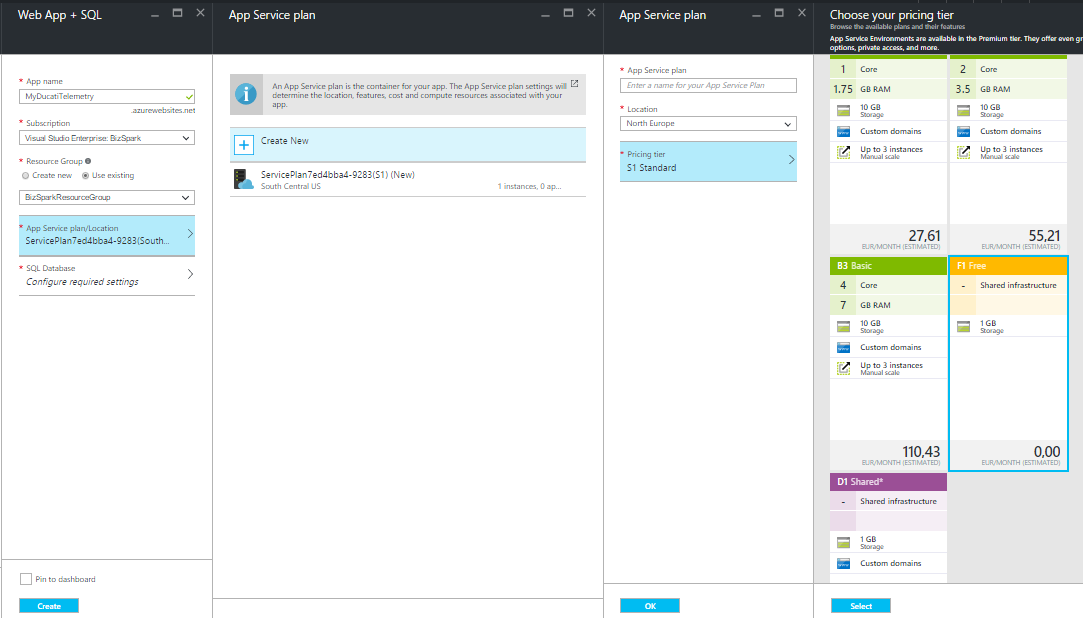
SQL을 구성하고 새 SQL을 만들고 이름을 선택합니다. , 가격 등급 , 서버 이름 관리자 로그인 자격 증명 추가 :
이제 2단계로 돌아갑니다. , 이제 StreamAnalitycs 쿼리를 만들 준비가 되었습니다. StreamAnalyticJob 타일을 클릭하고 "쿼리"를 선택합니다. 오른쪽 패널에 검색어를 입력하세요.
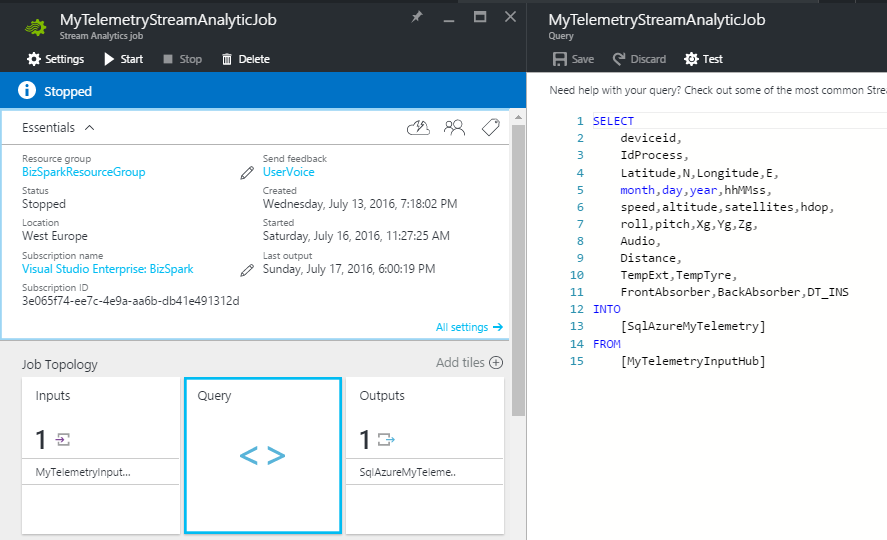
보시다시피 쿼리는 프로세스 워크플로를 설명합니다. Catch the data from "MyTelemetryInputHub" and save them into "SqlAzureMyTelemetry" ... easy&wonderful!!
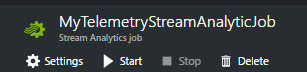
At the end, we have only to start the JOB clicking the START 버튼.
Create a DeviceId for HUB
This step is necessary in order to create a connection between my device and the IoTHUB. We need to create a new device identity and add into the ID registry of the IoT HUB.
For more information please visit the follow link
To generate a new one deviceId, you have to create a Console Application in Visual Studio.
In the NuGet Package Manager window, search and install the Microsoft.Azure.Devices package.
Add the below code In your Console application, replace your IoTHub Connection String and chose a deviceId alias (in my case the deviced is MyDucatiMonsterDevice ).
class Program{//Install-Package Microsoft.Azure.Devicesstatic RegistryManager registryManager;// Connection String HUBstatic string connectionString ="xxxxxxxxxxxxxx";static void Main(string[] args){registryManager =RegistryManager.CreateFromConnectionString(connectionString);AddDeviceAsync().Wait();Console.ReadLine();}// creates a new device identity with ID myFirstDeviceprivate async static Task AddDeviceAsync(){ string deviceId ="myDucatiMonsterDevice";Device device;try{device =await registryManager.AddDeviceAsync(new Device(deviceId));}catch (DeviceAlreadyExistsException){device =await registryManager.GetDeviceAsync(deviceId);}Console.WriteLine("Generated device key:{0}", device.Authentication.SymmetricKey.PrimaryKey);}} Run the console application (press F5) and generate your device key!
WEB application
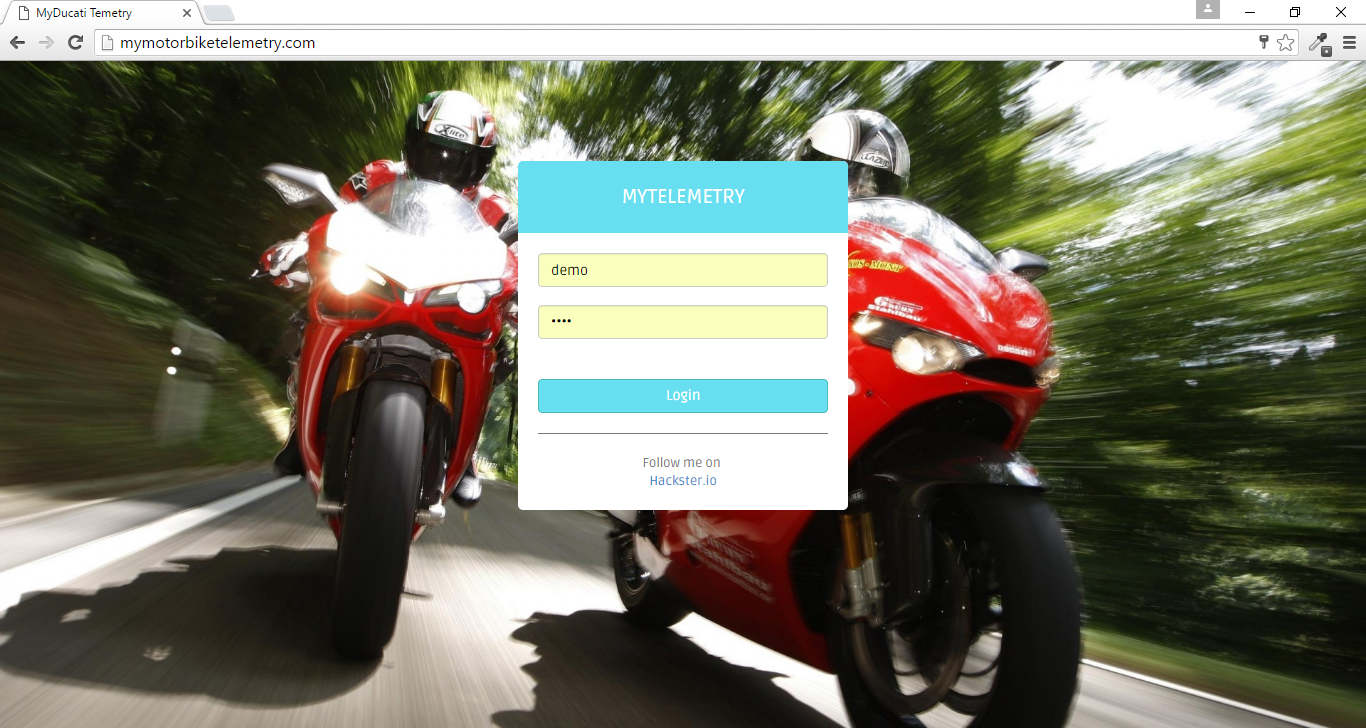
At this point of the project i thinked about how can i see my telemetry data and how can i show them to my friends and share the results on the social media. to do that I decided to create a responsive web site in ASP .NET
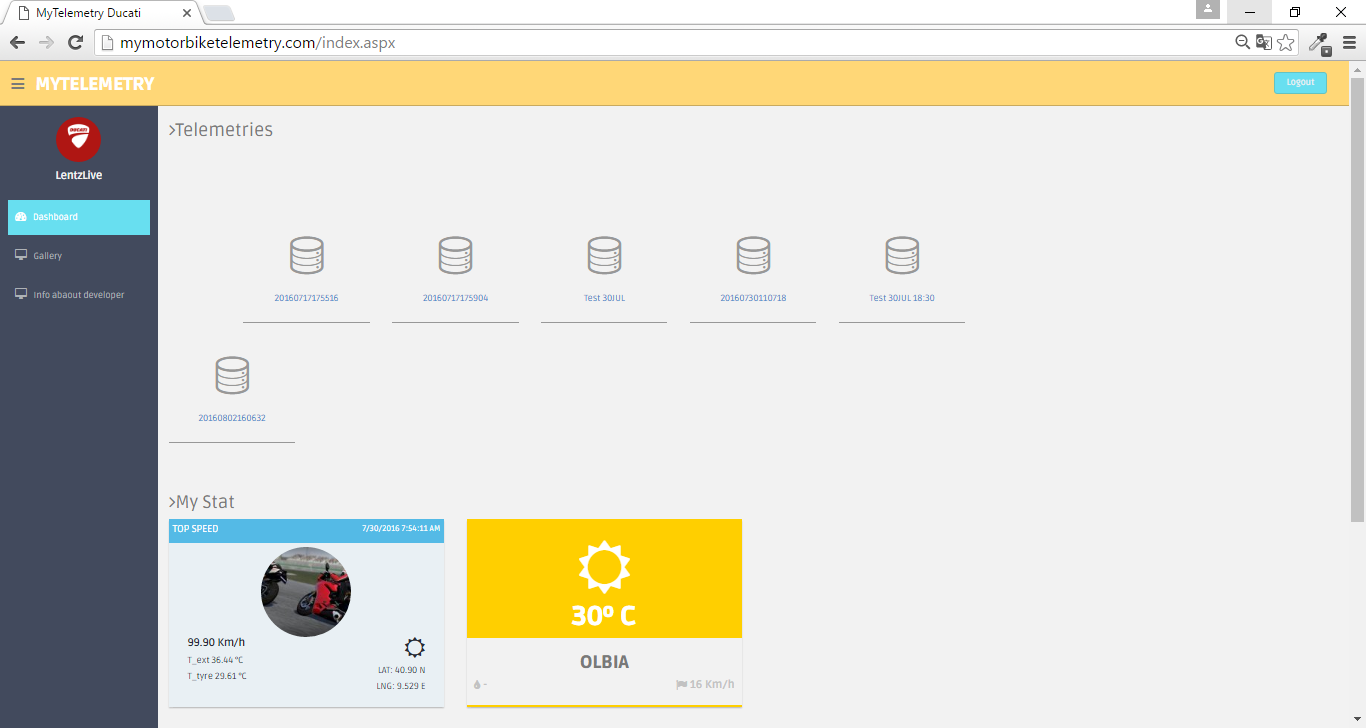
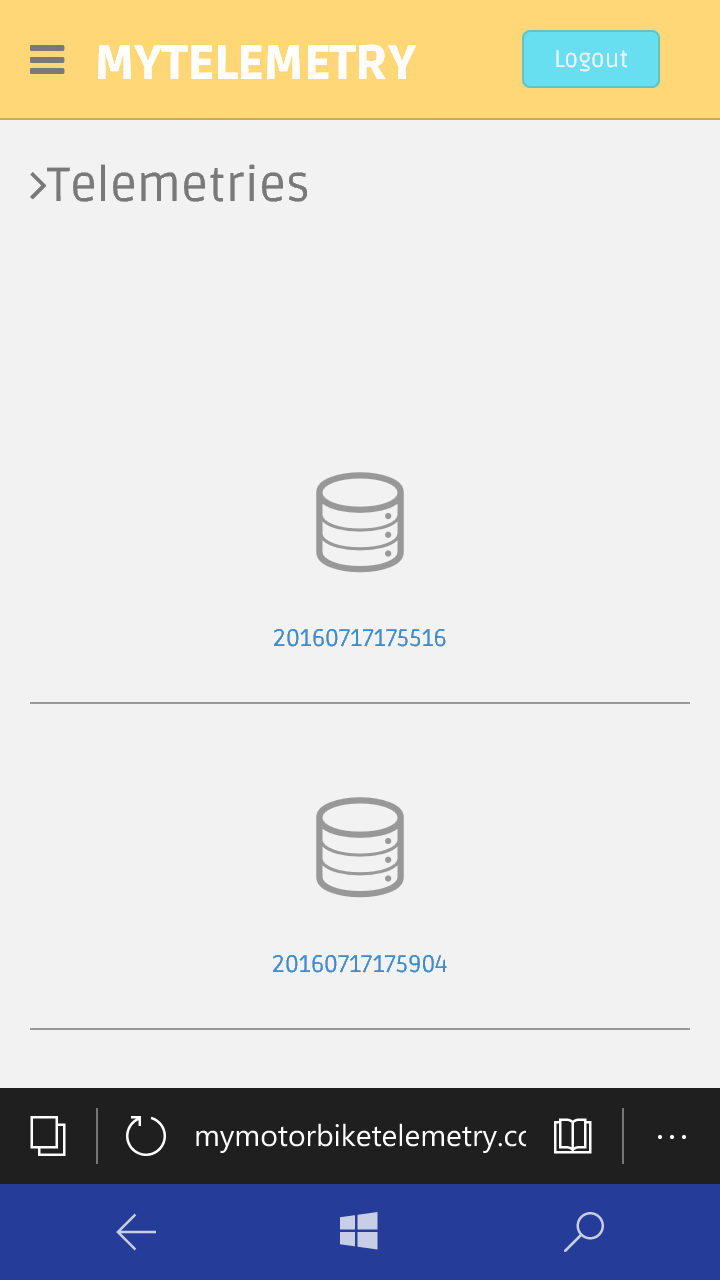
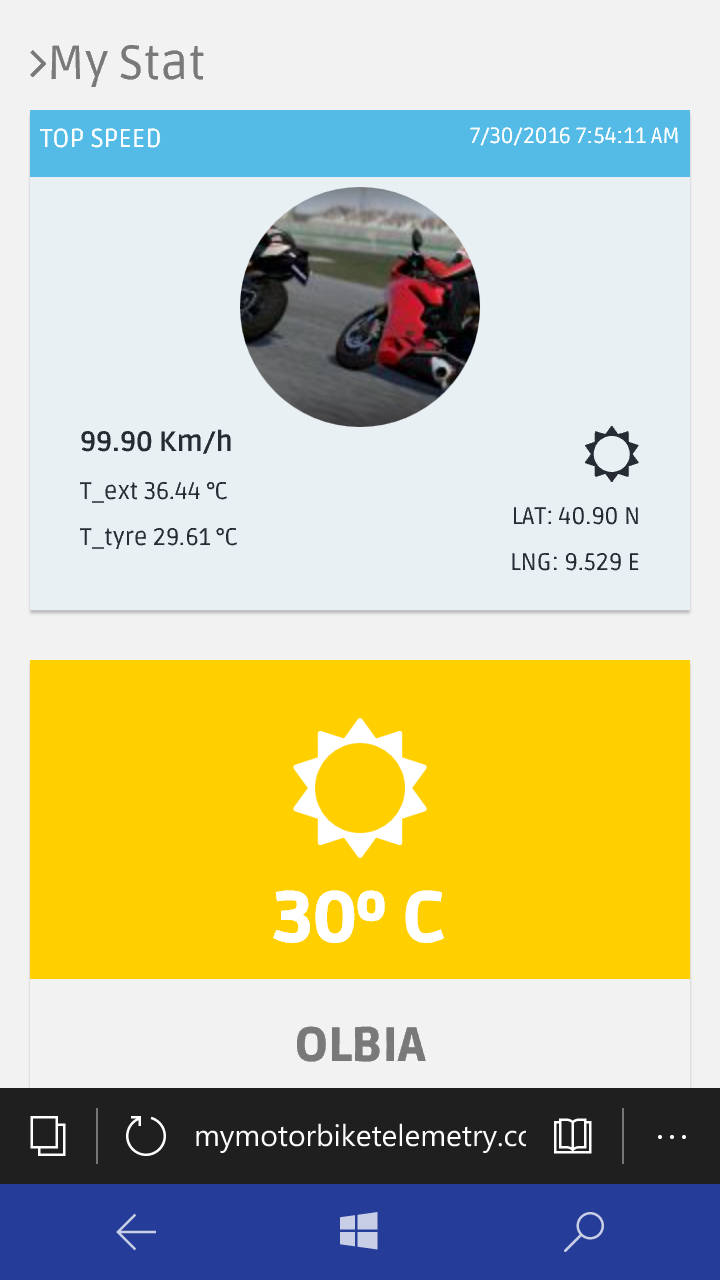
The website consist in a dashboard contains all my telemetries. The data has been read using the Entity framework from SQL Azure.
You can discover the web site by the following url:
Has been created an account for all Hackster Users , SignIn using the following user/psw credentials:
User ID:demoPassword:demo The web site is look like this:
And look like this in mobile version:

When you create a web app in azure using the Free tier, the domain name will be something like this:
To change the domain name you have to buy one and on azure this is very simple! Follow this steps:
<울>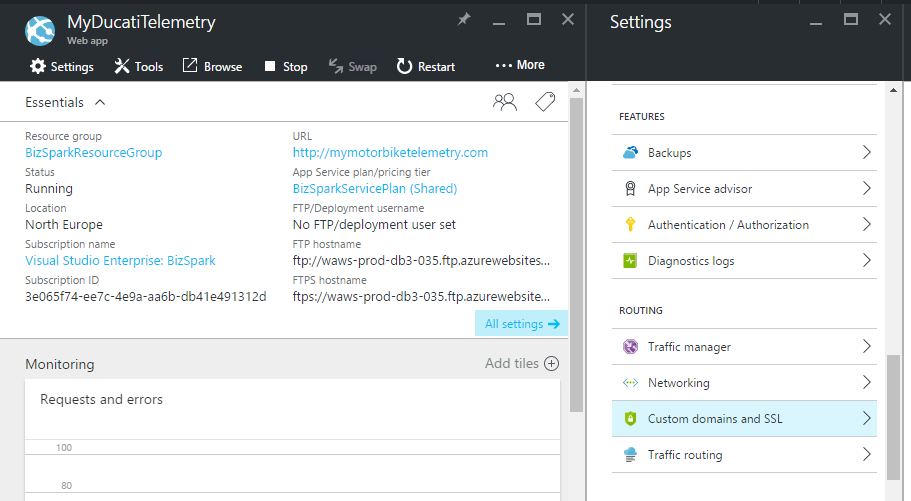
Ducati Monster Wiring
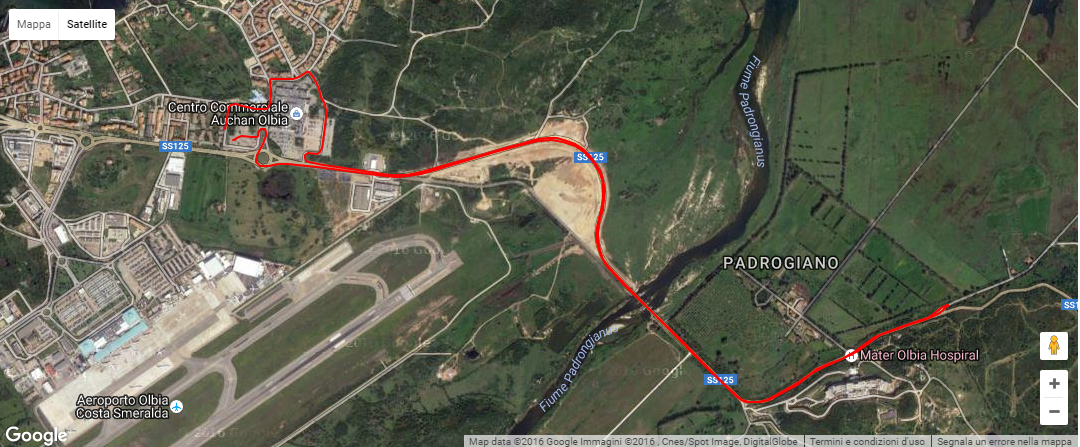
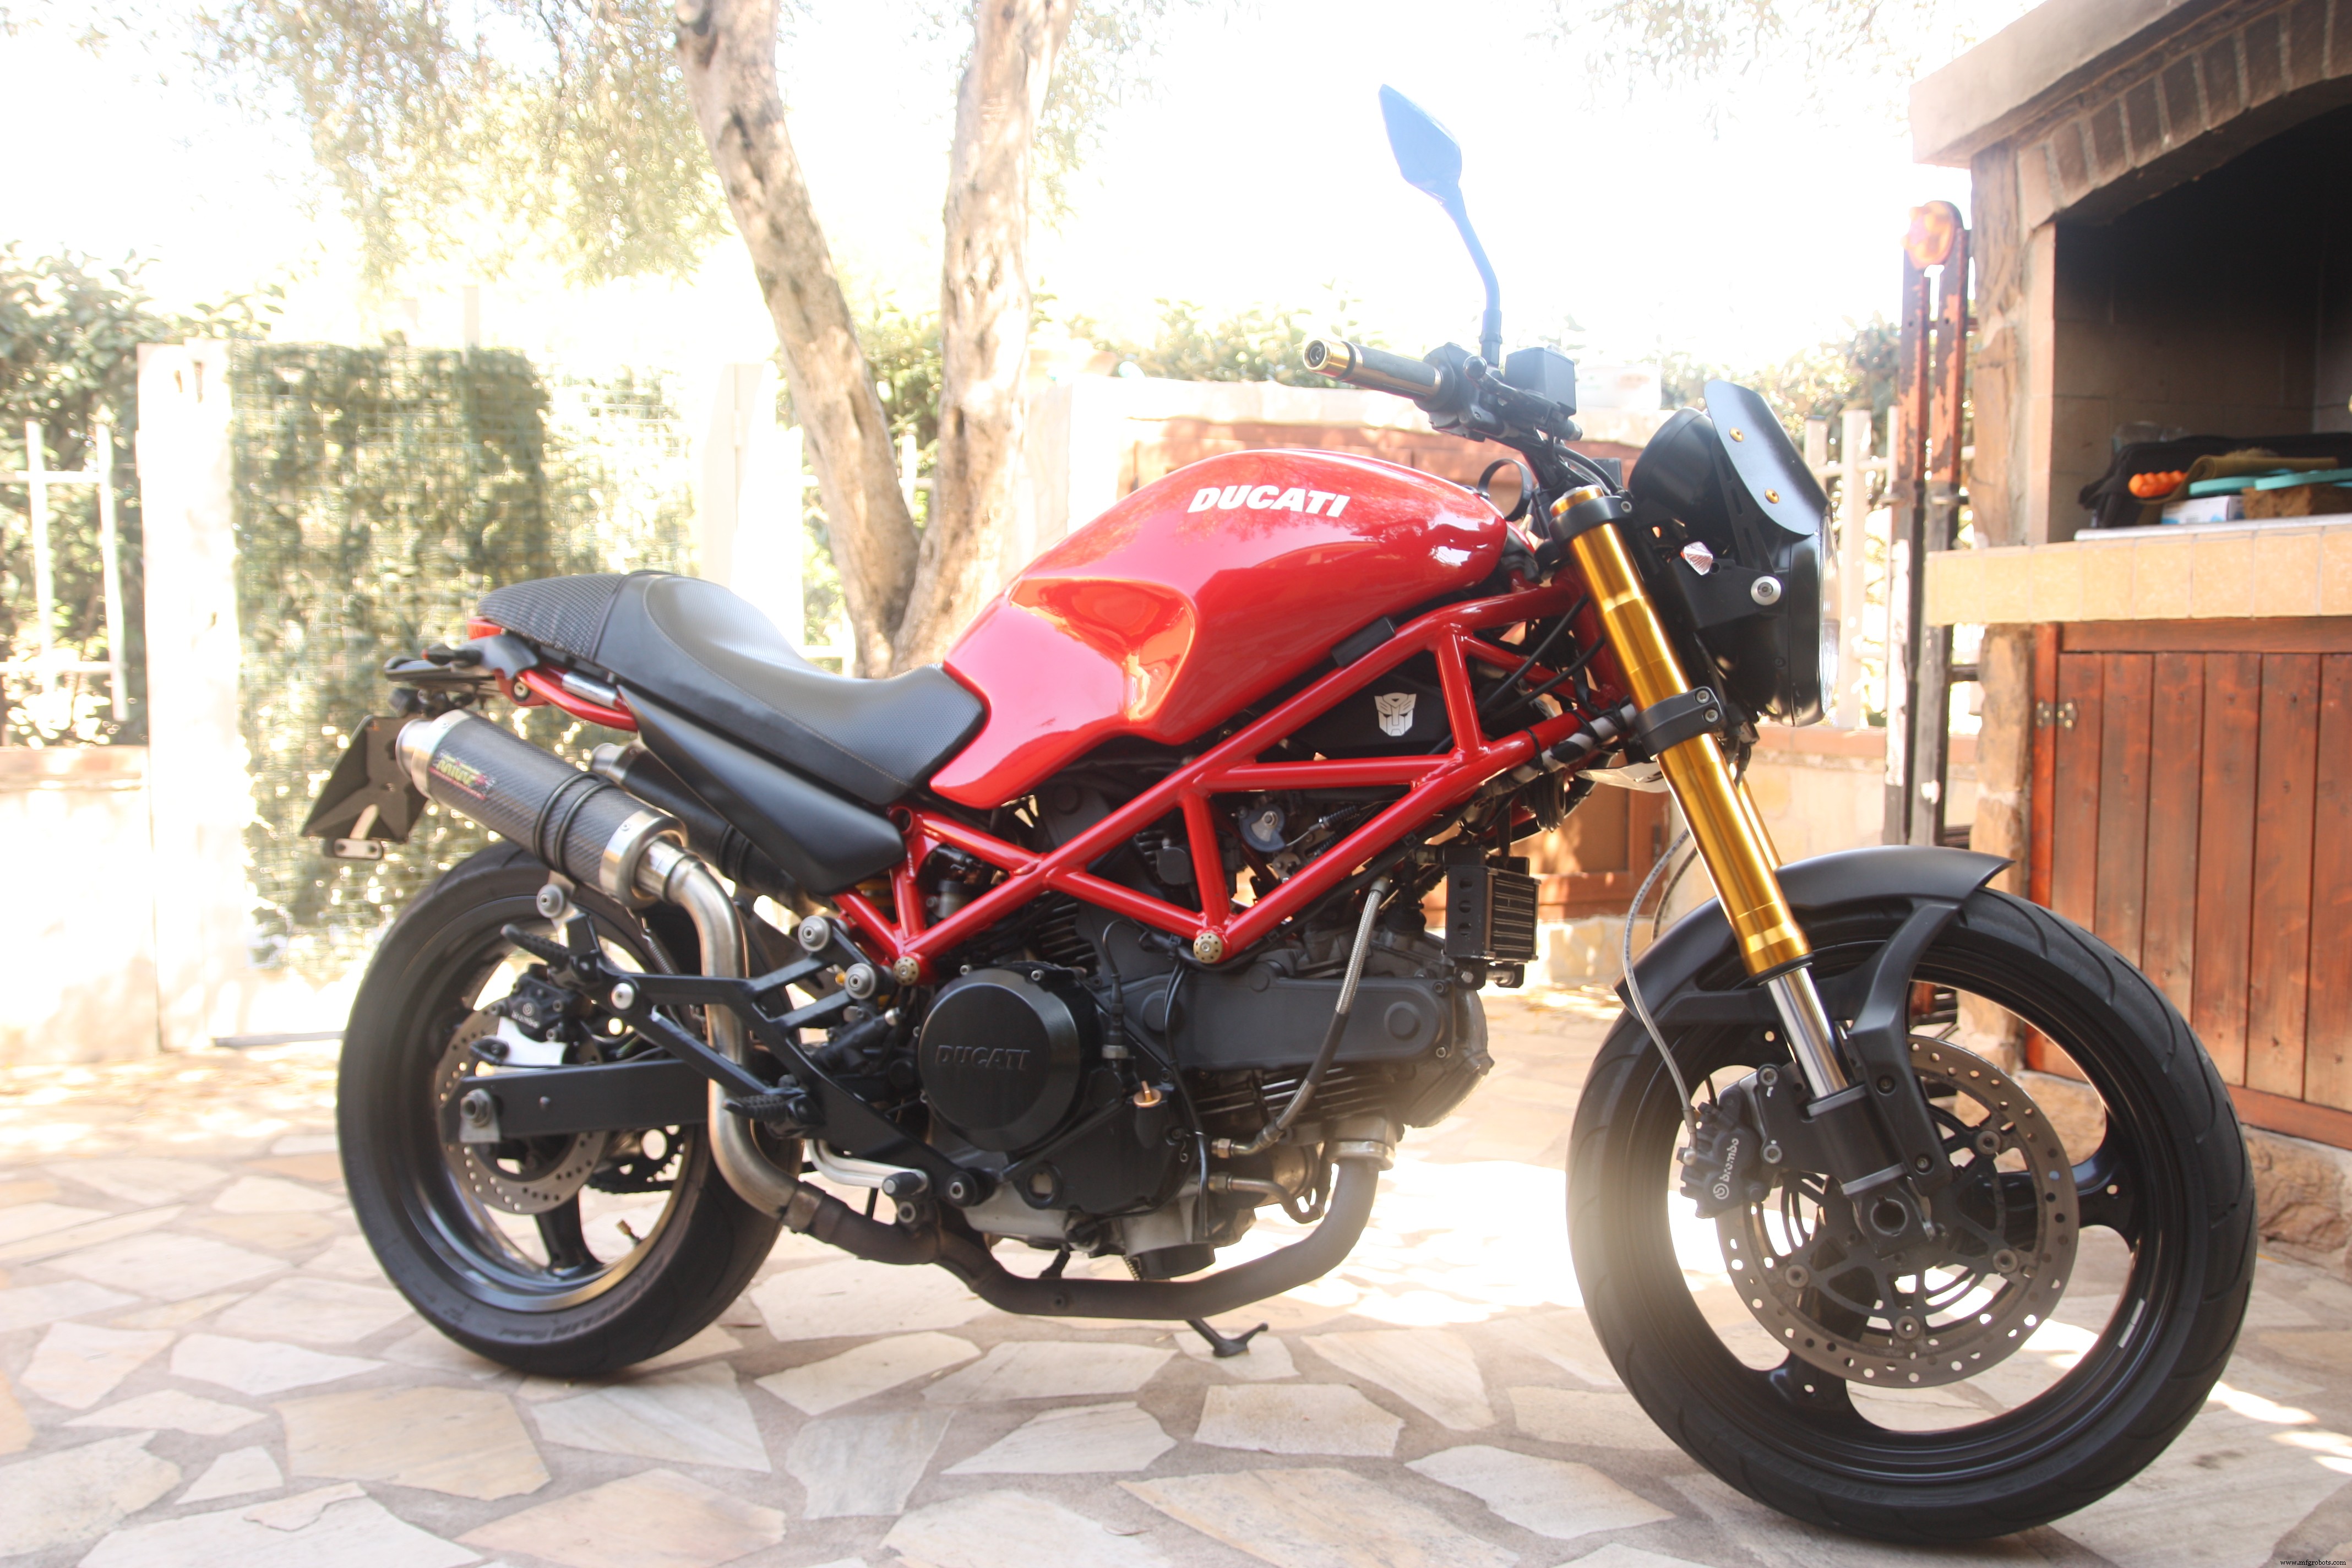
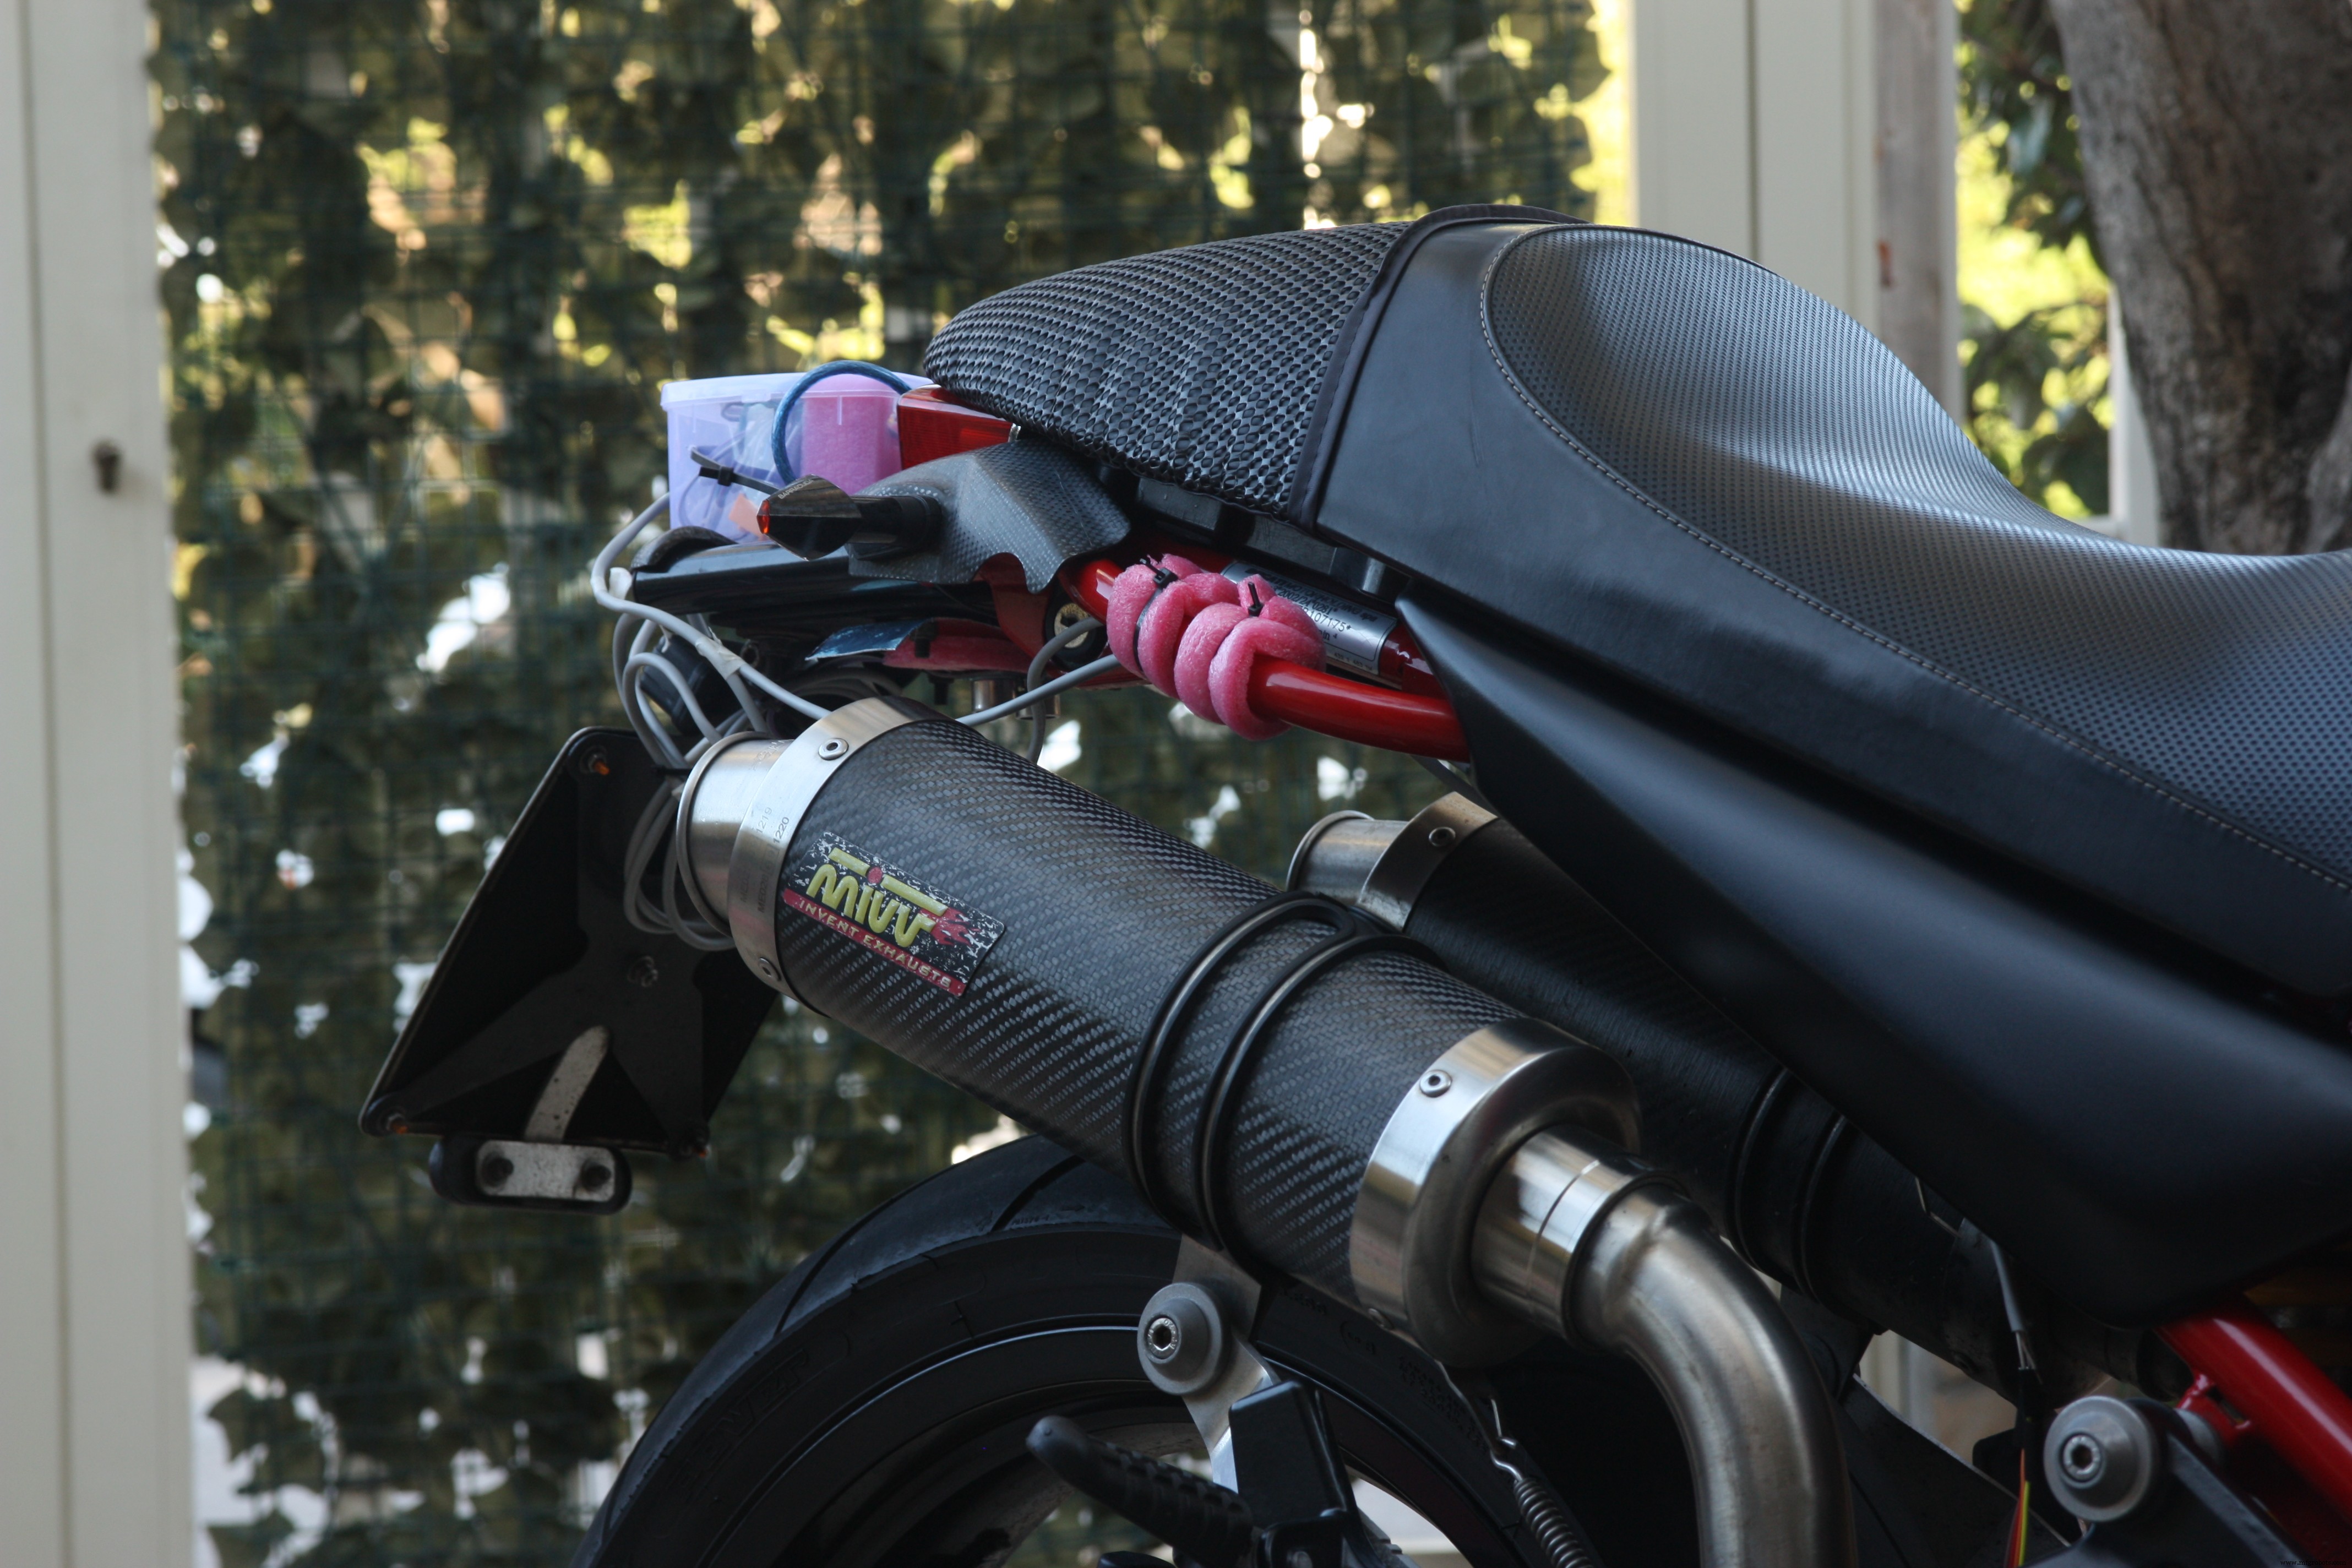
Now is time to Introduce my motorbike, this is my Ducati Monster 695 that for this project has been the cavy.
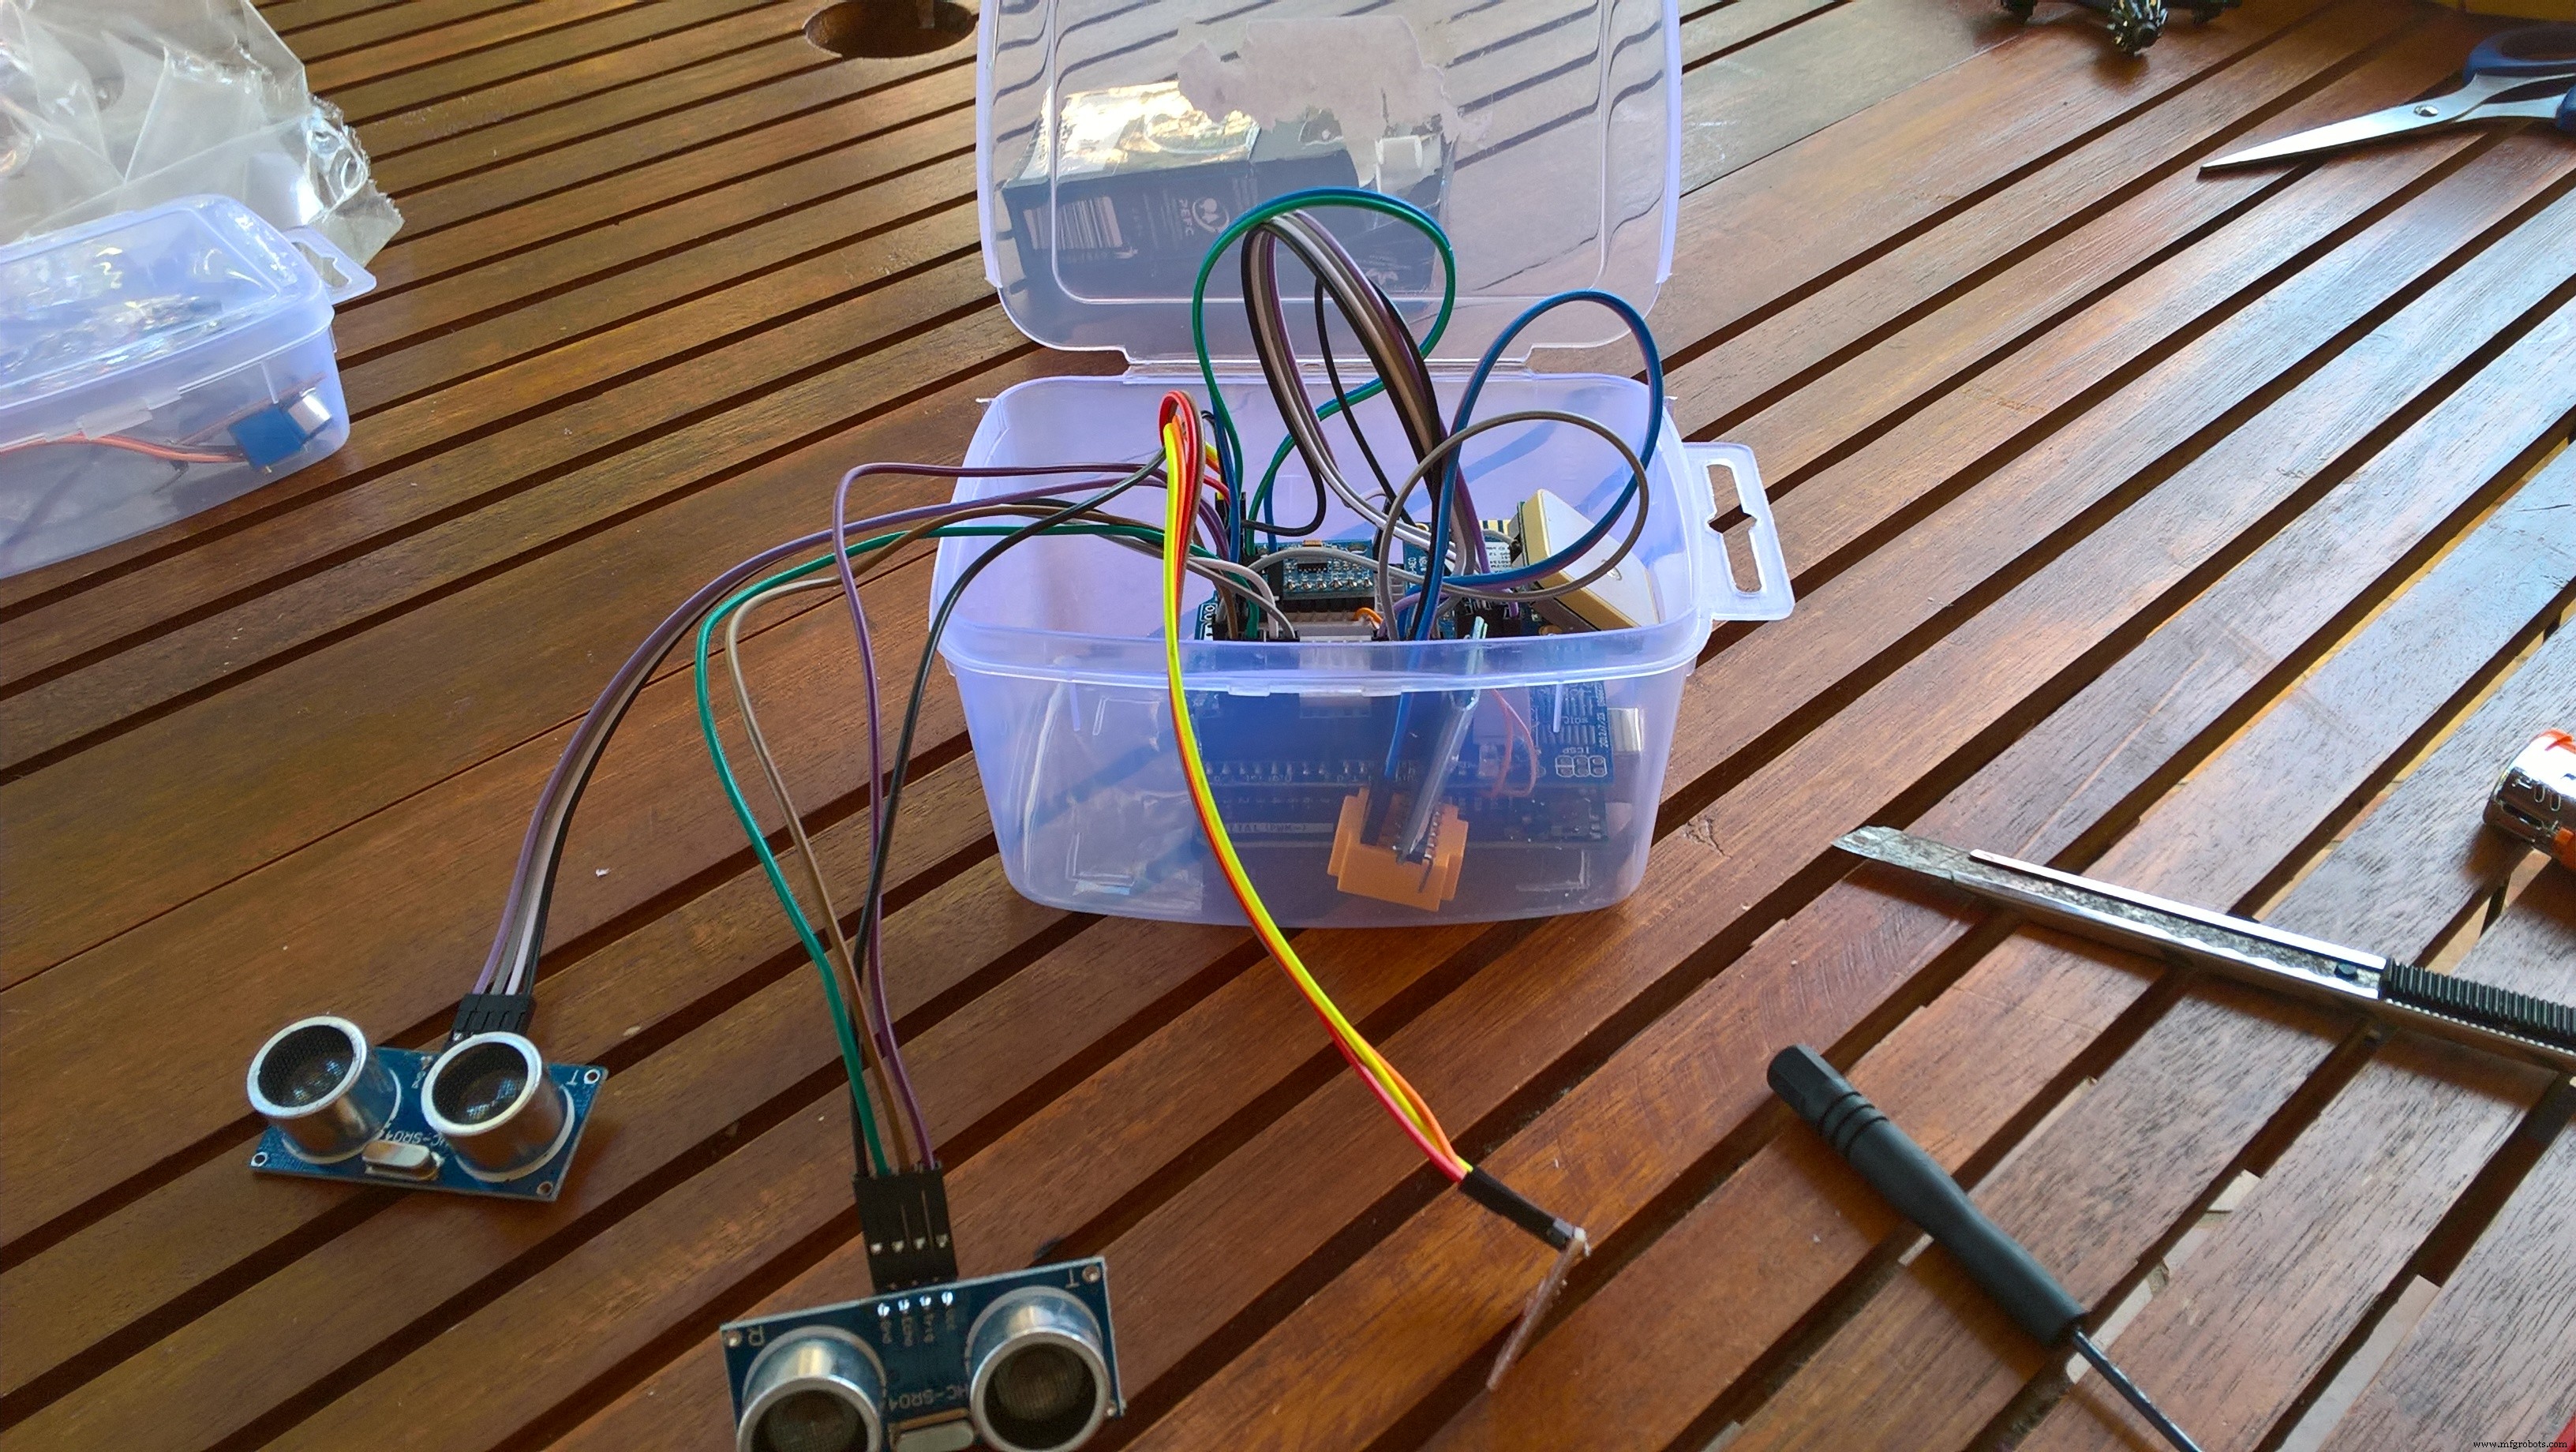
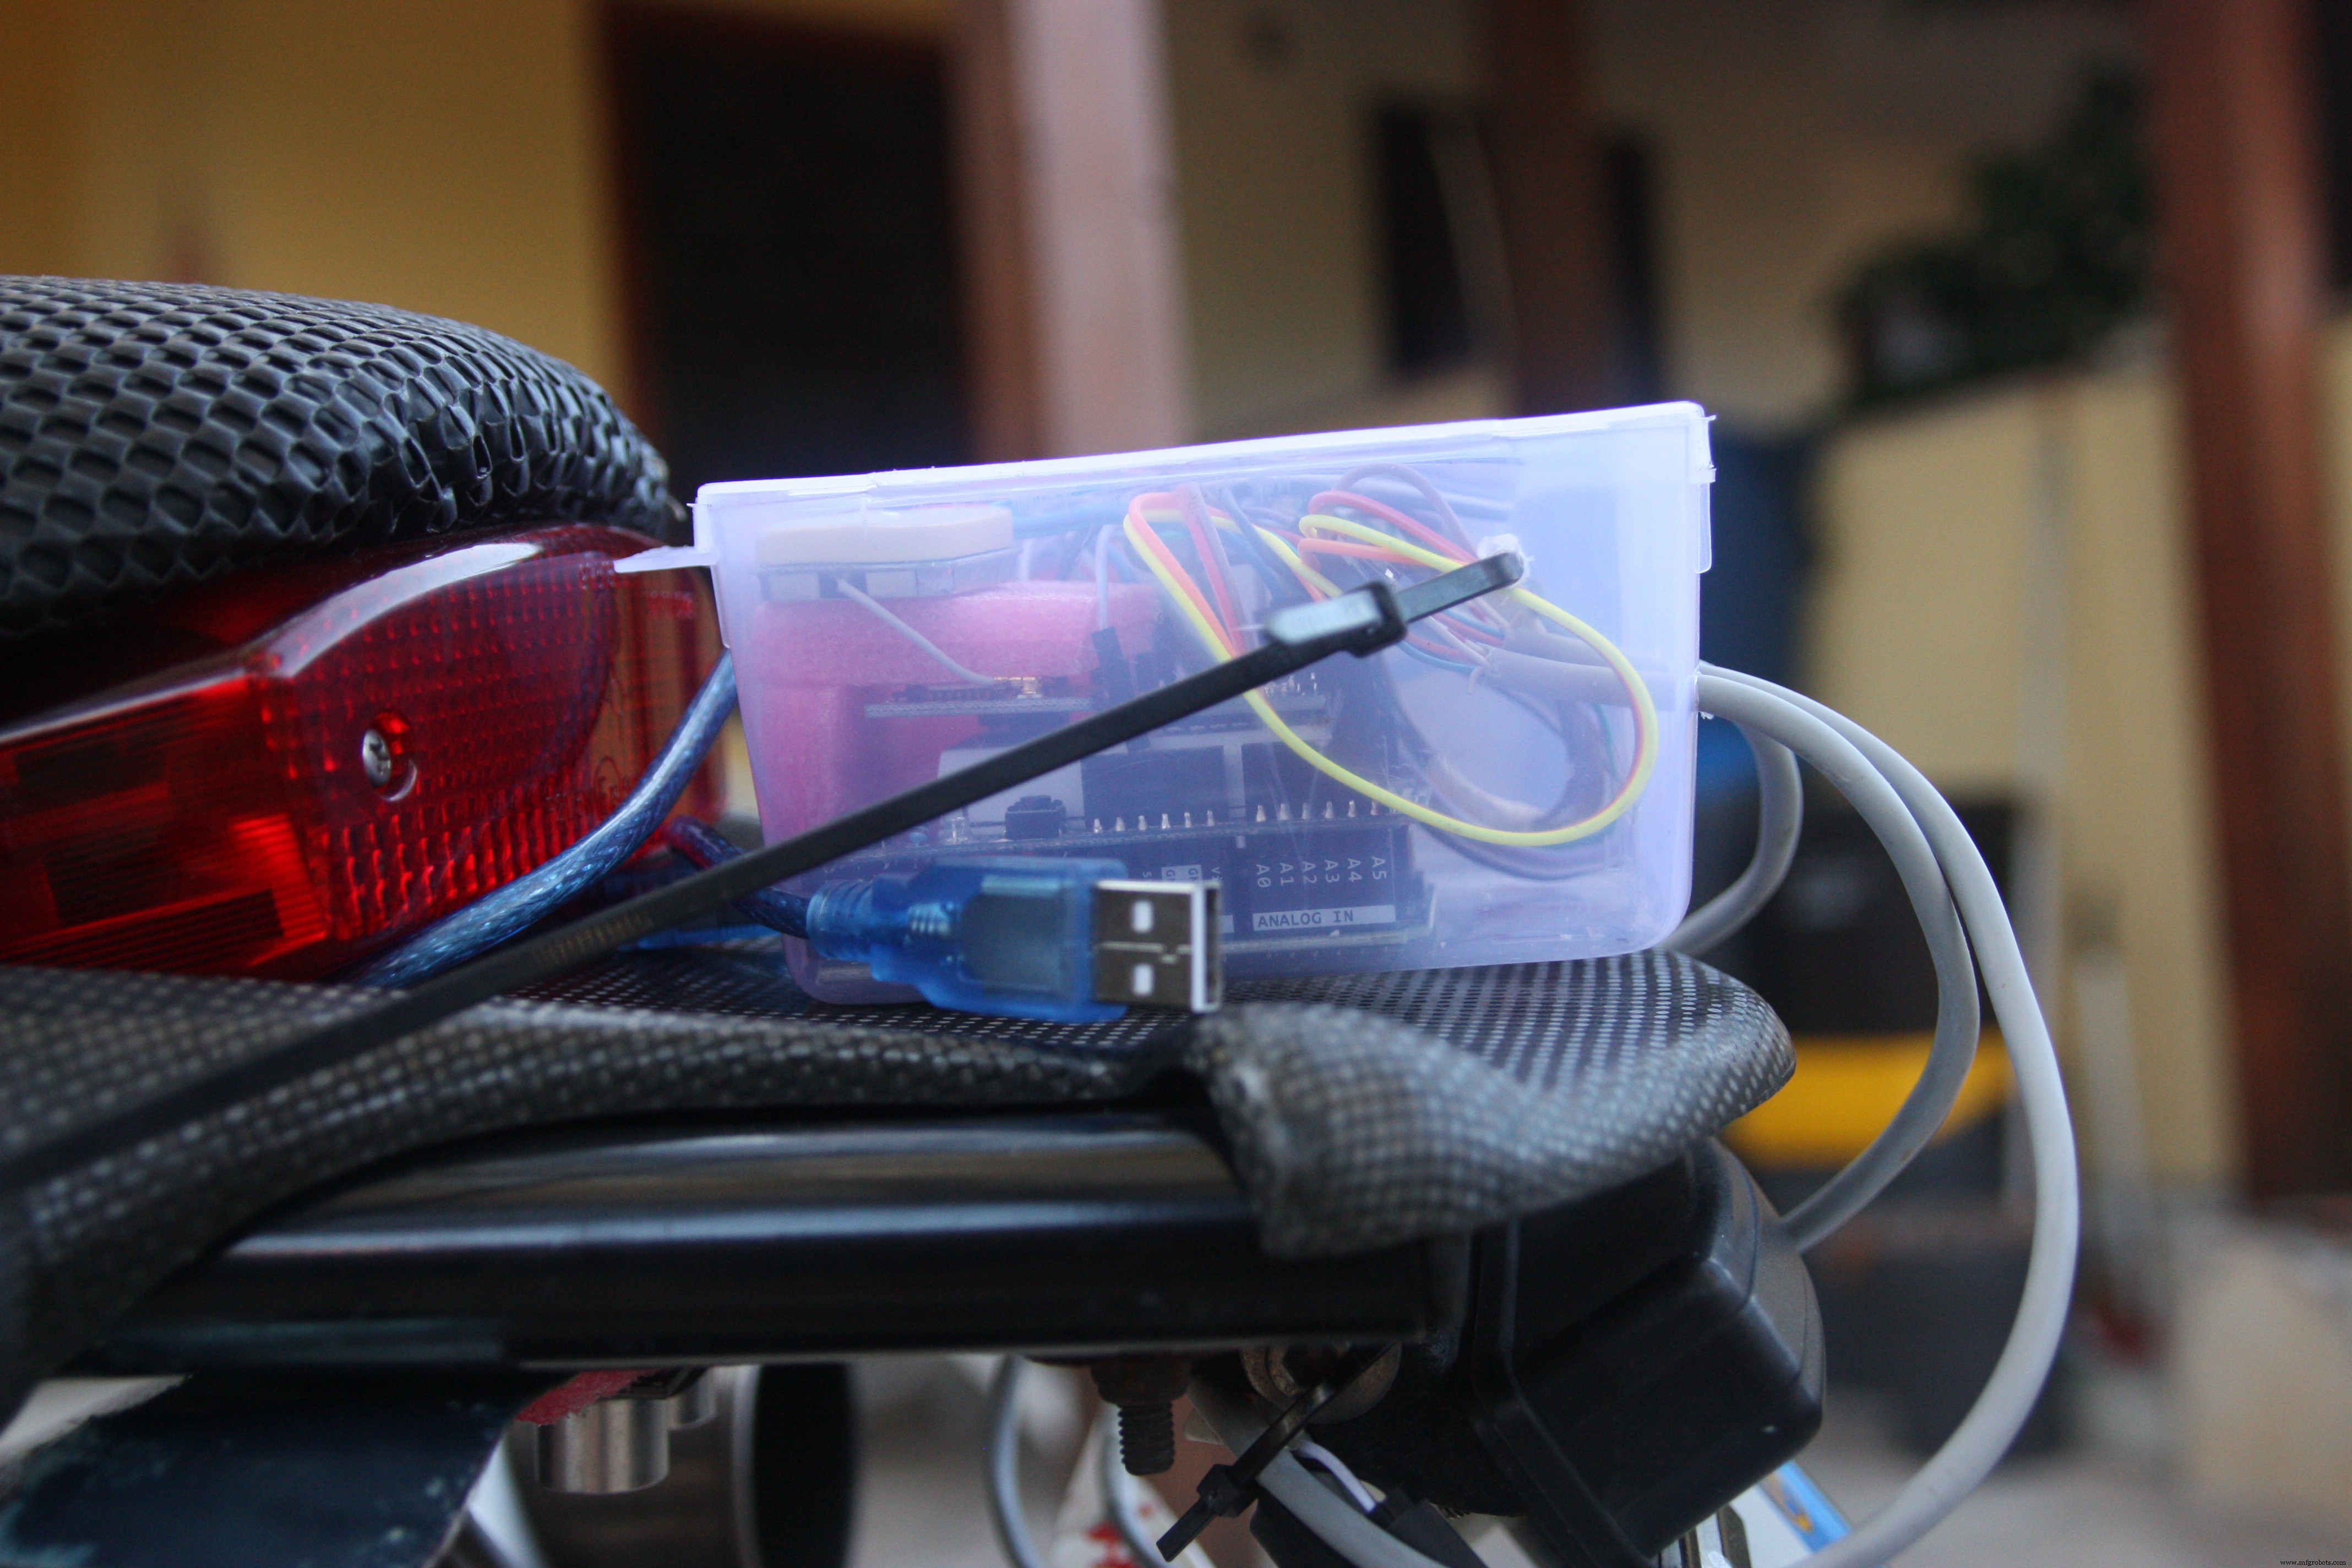
Below some pictures about my Hardware (control unit) mounted onboard.
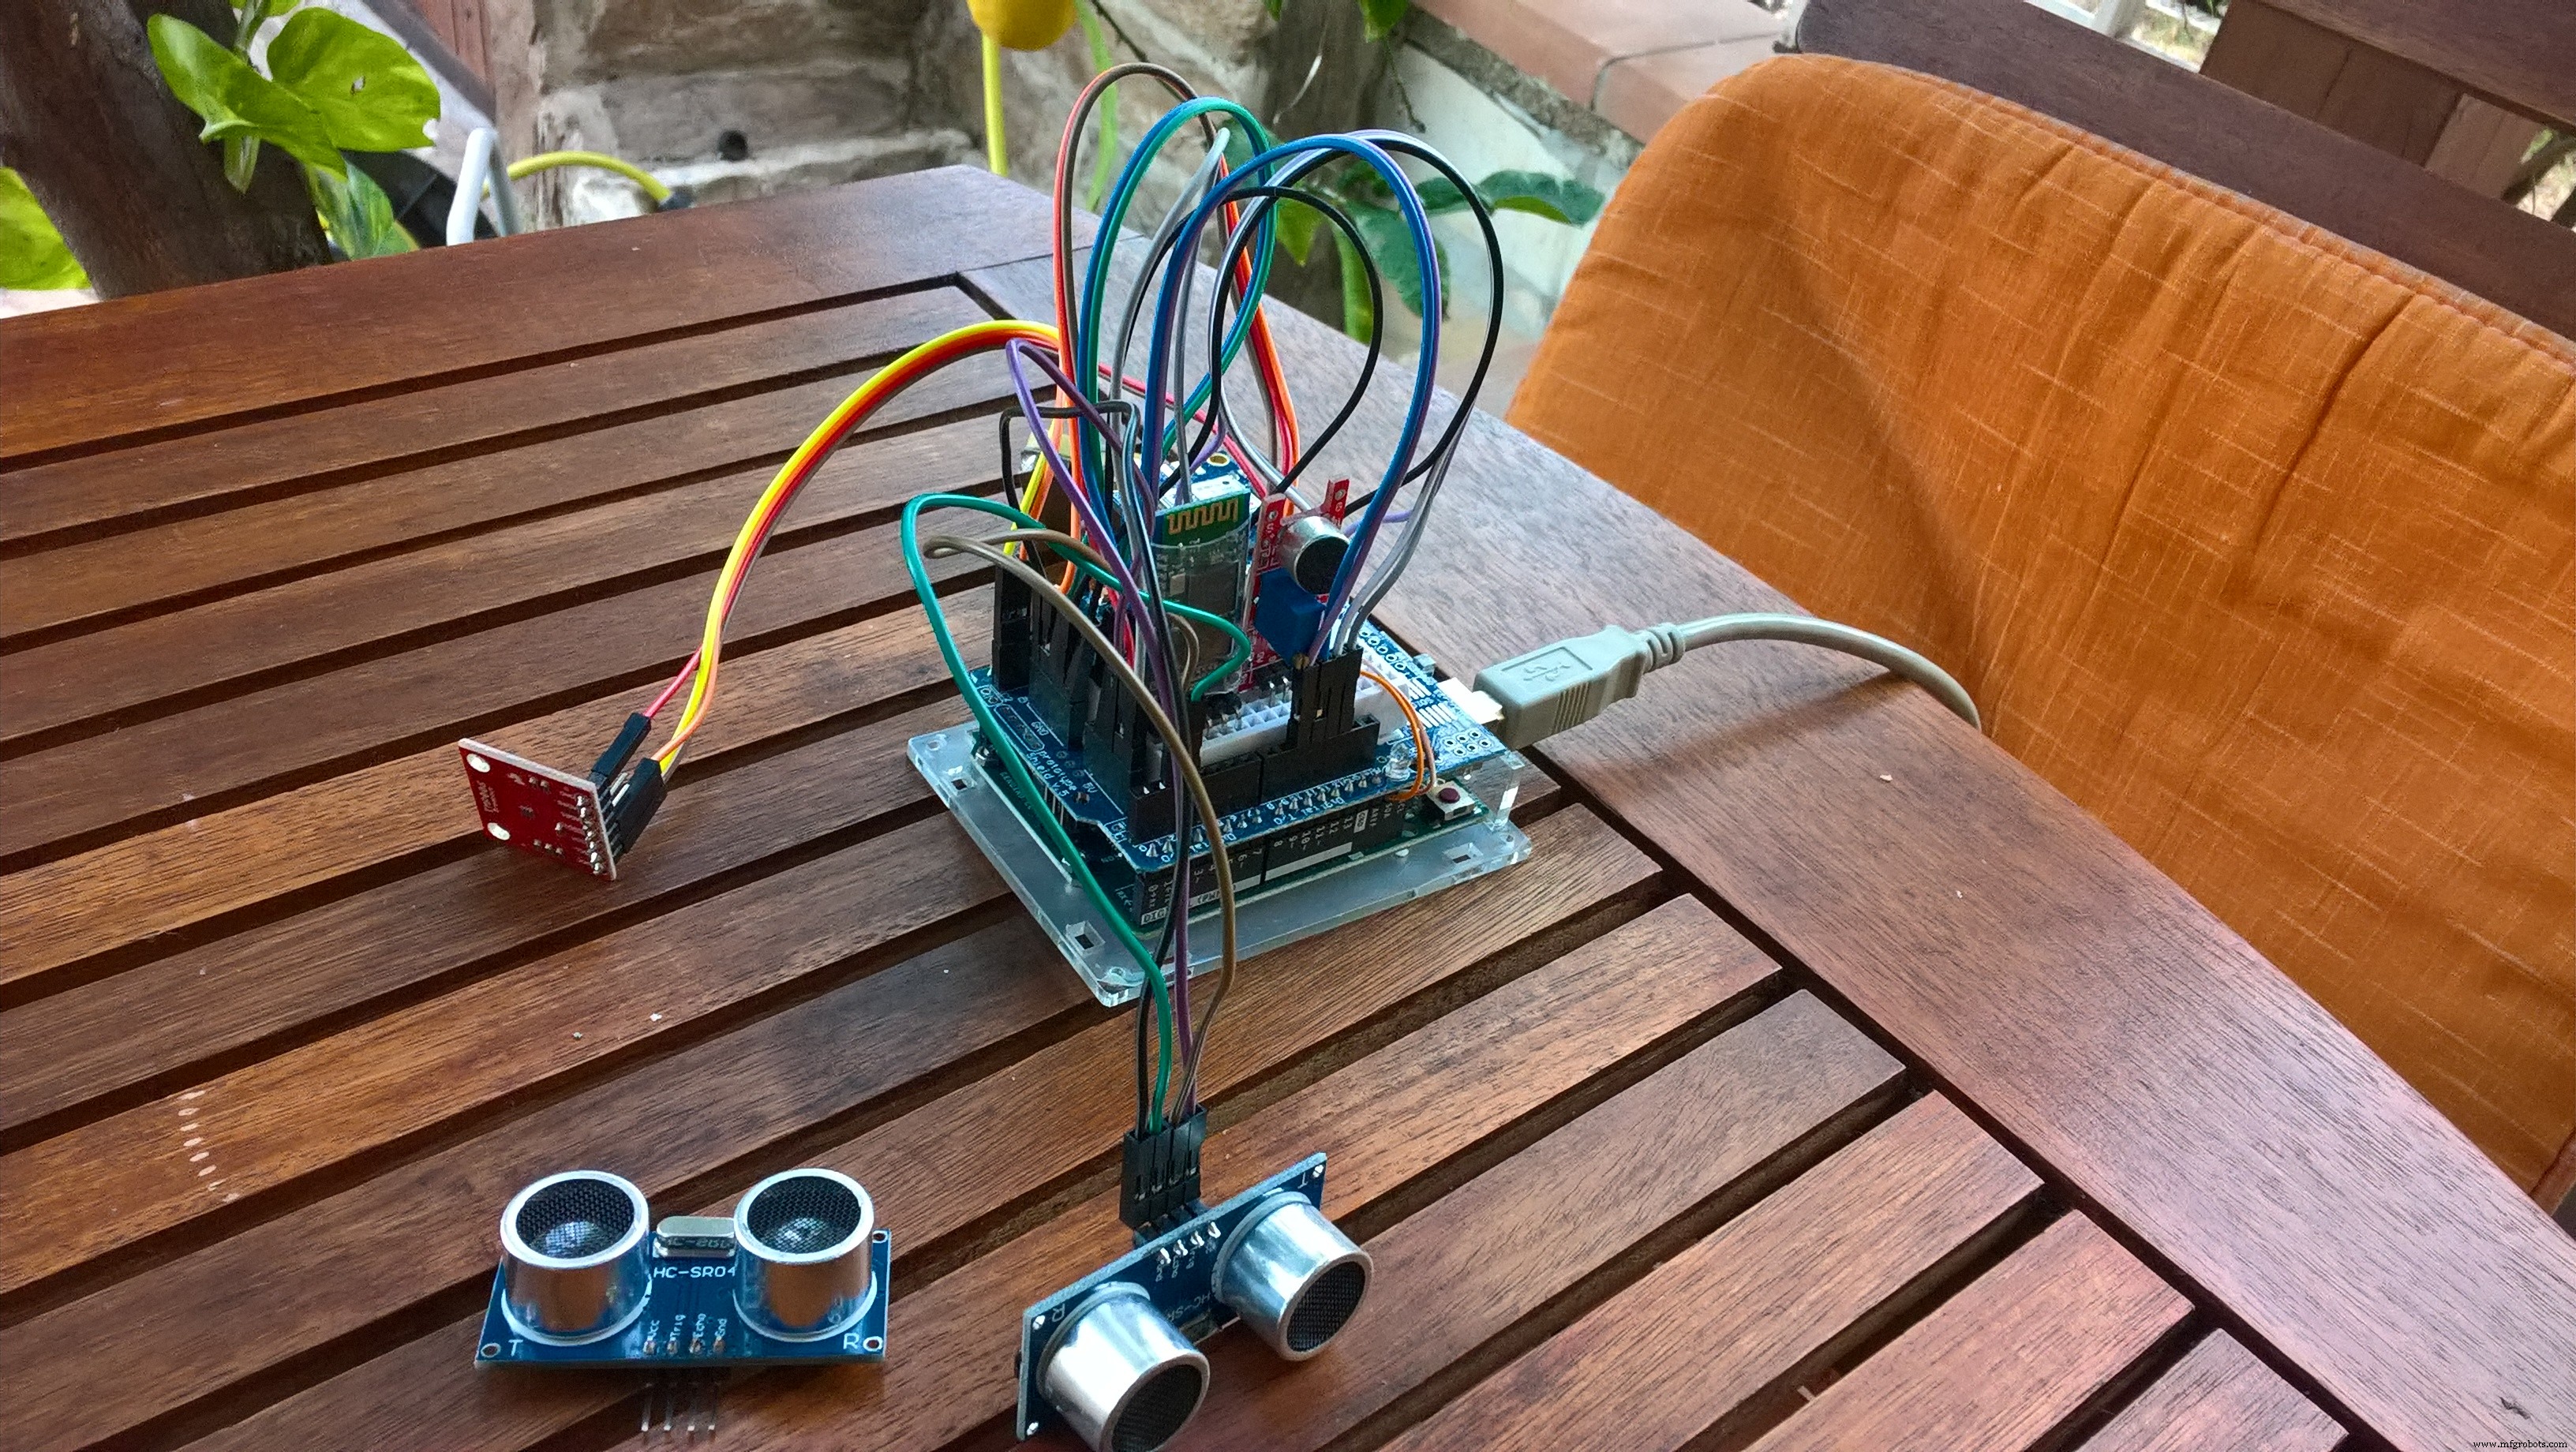

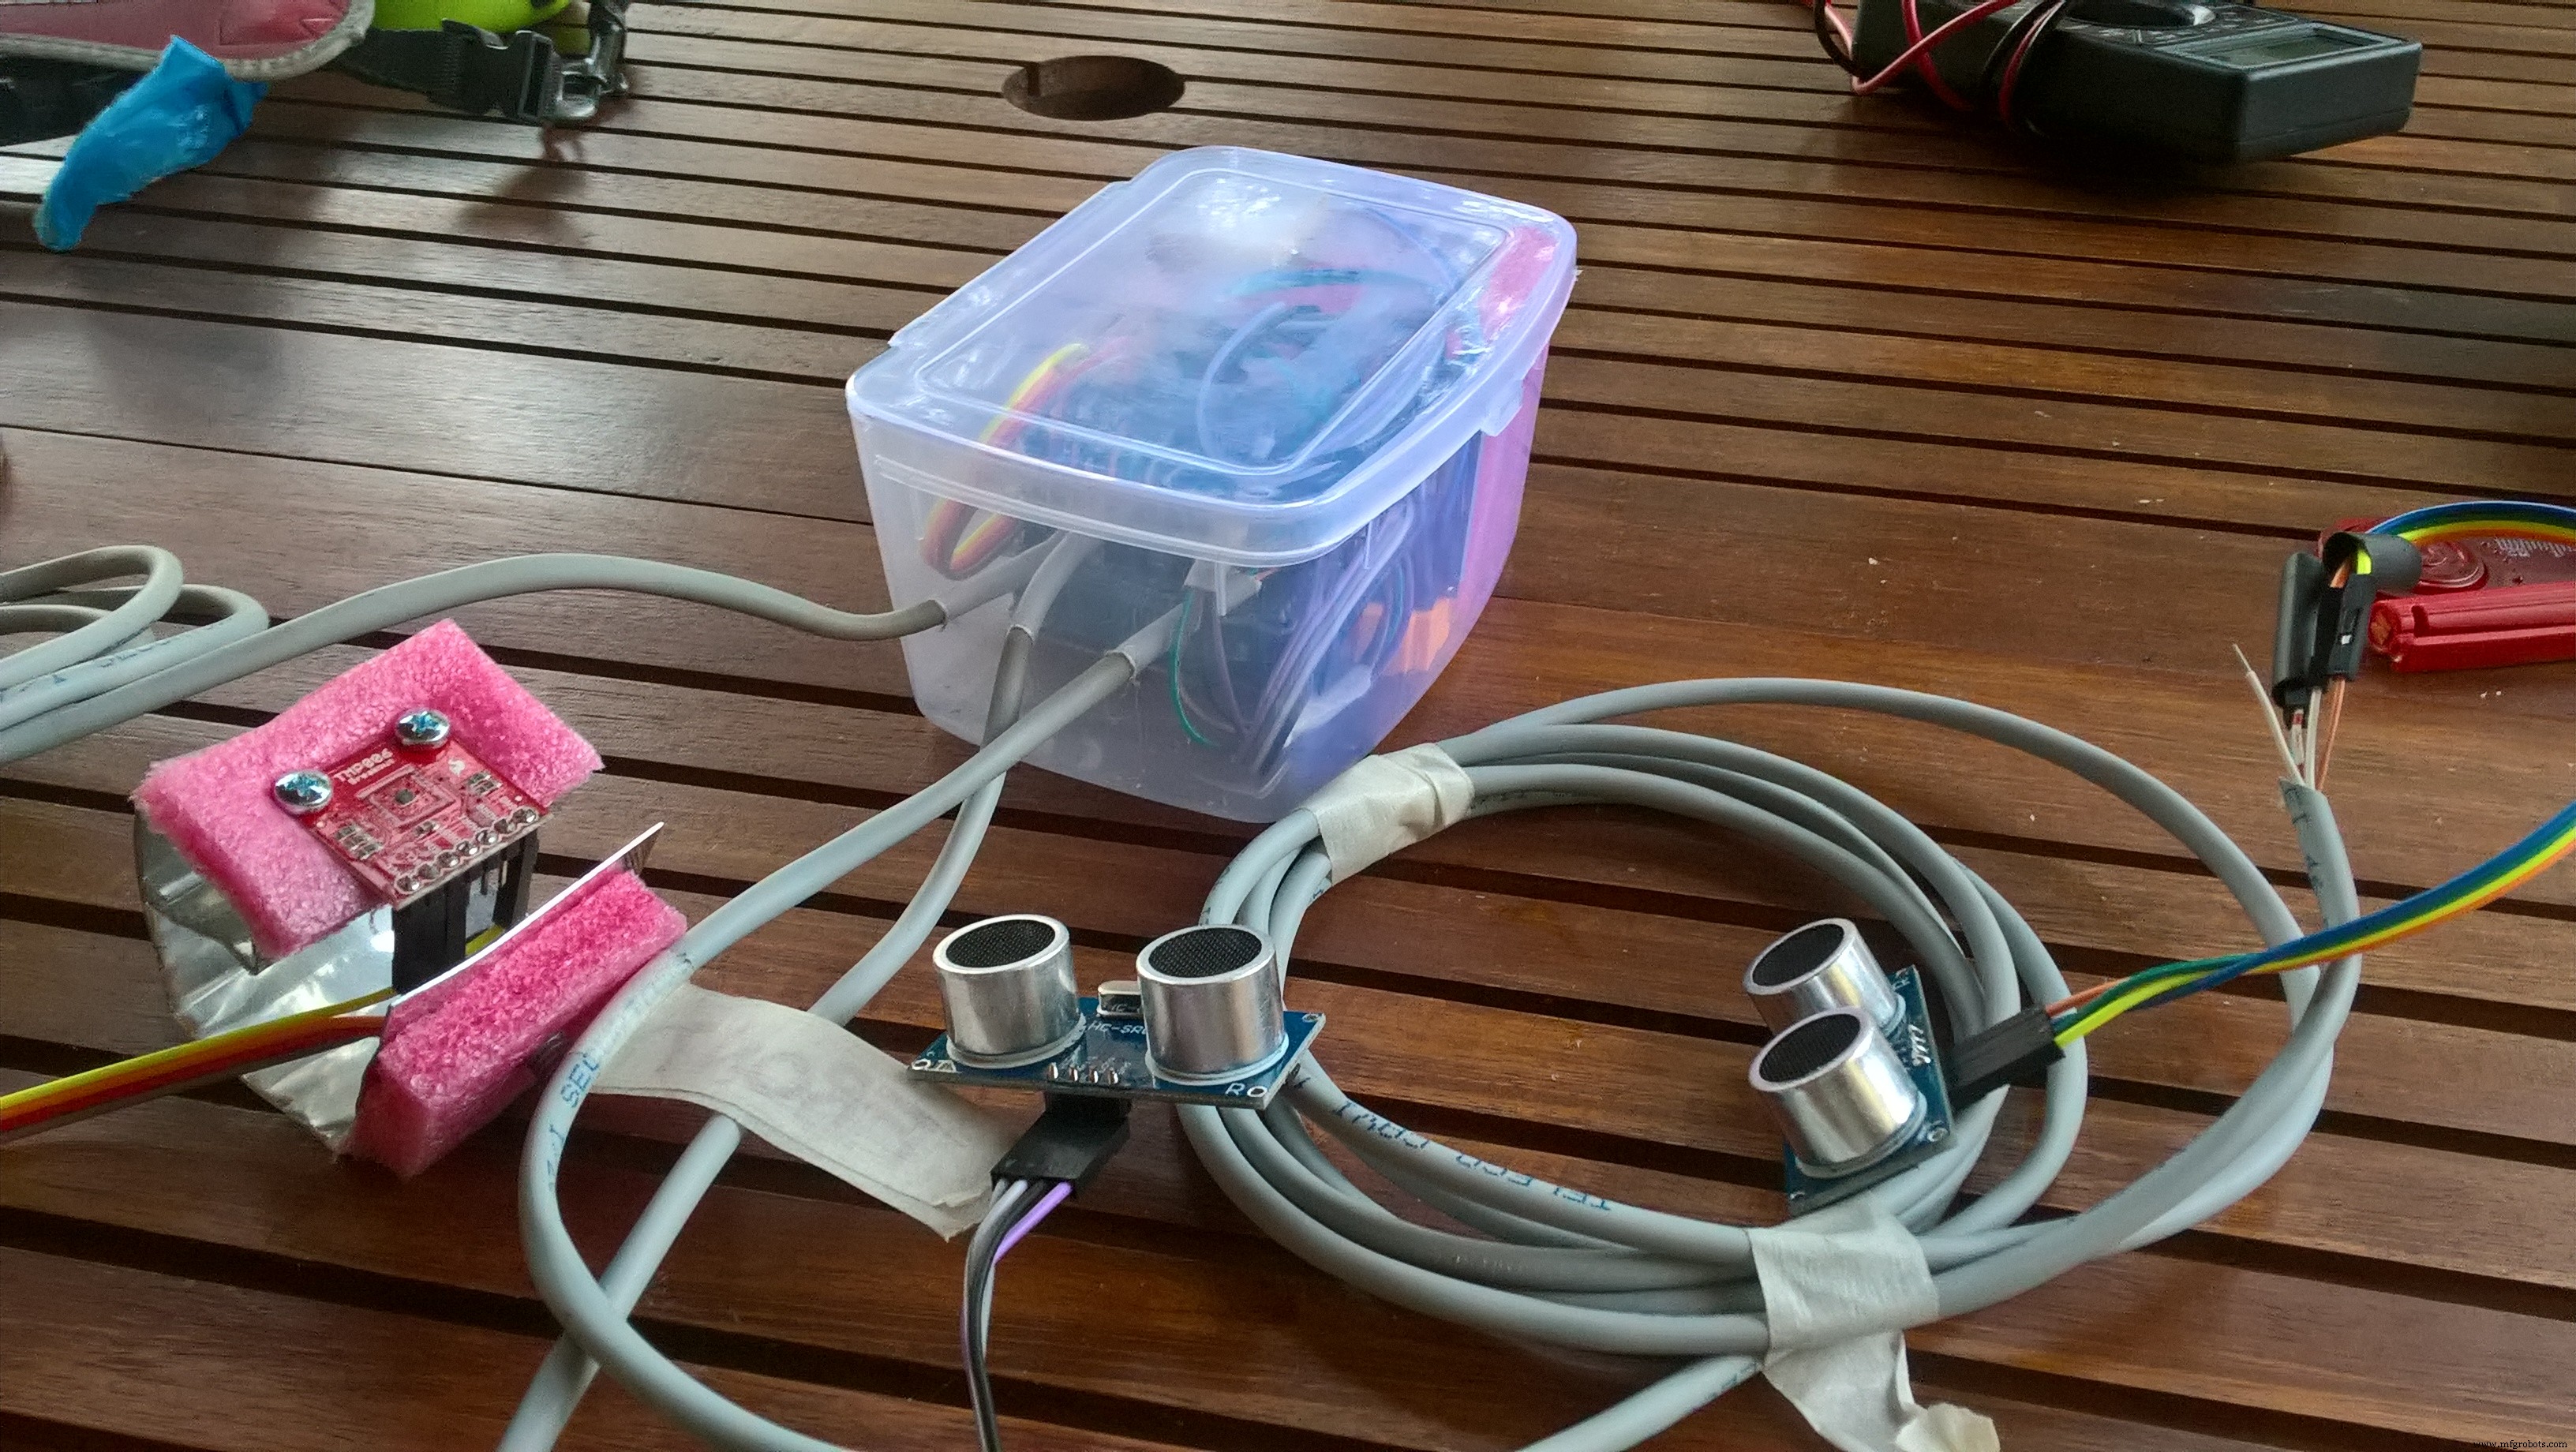
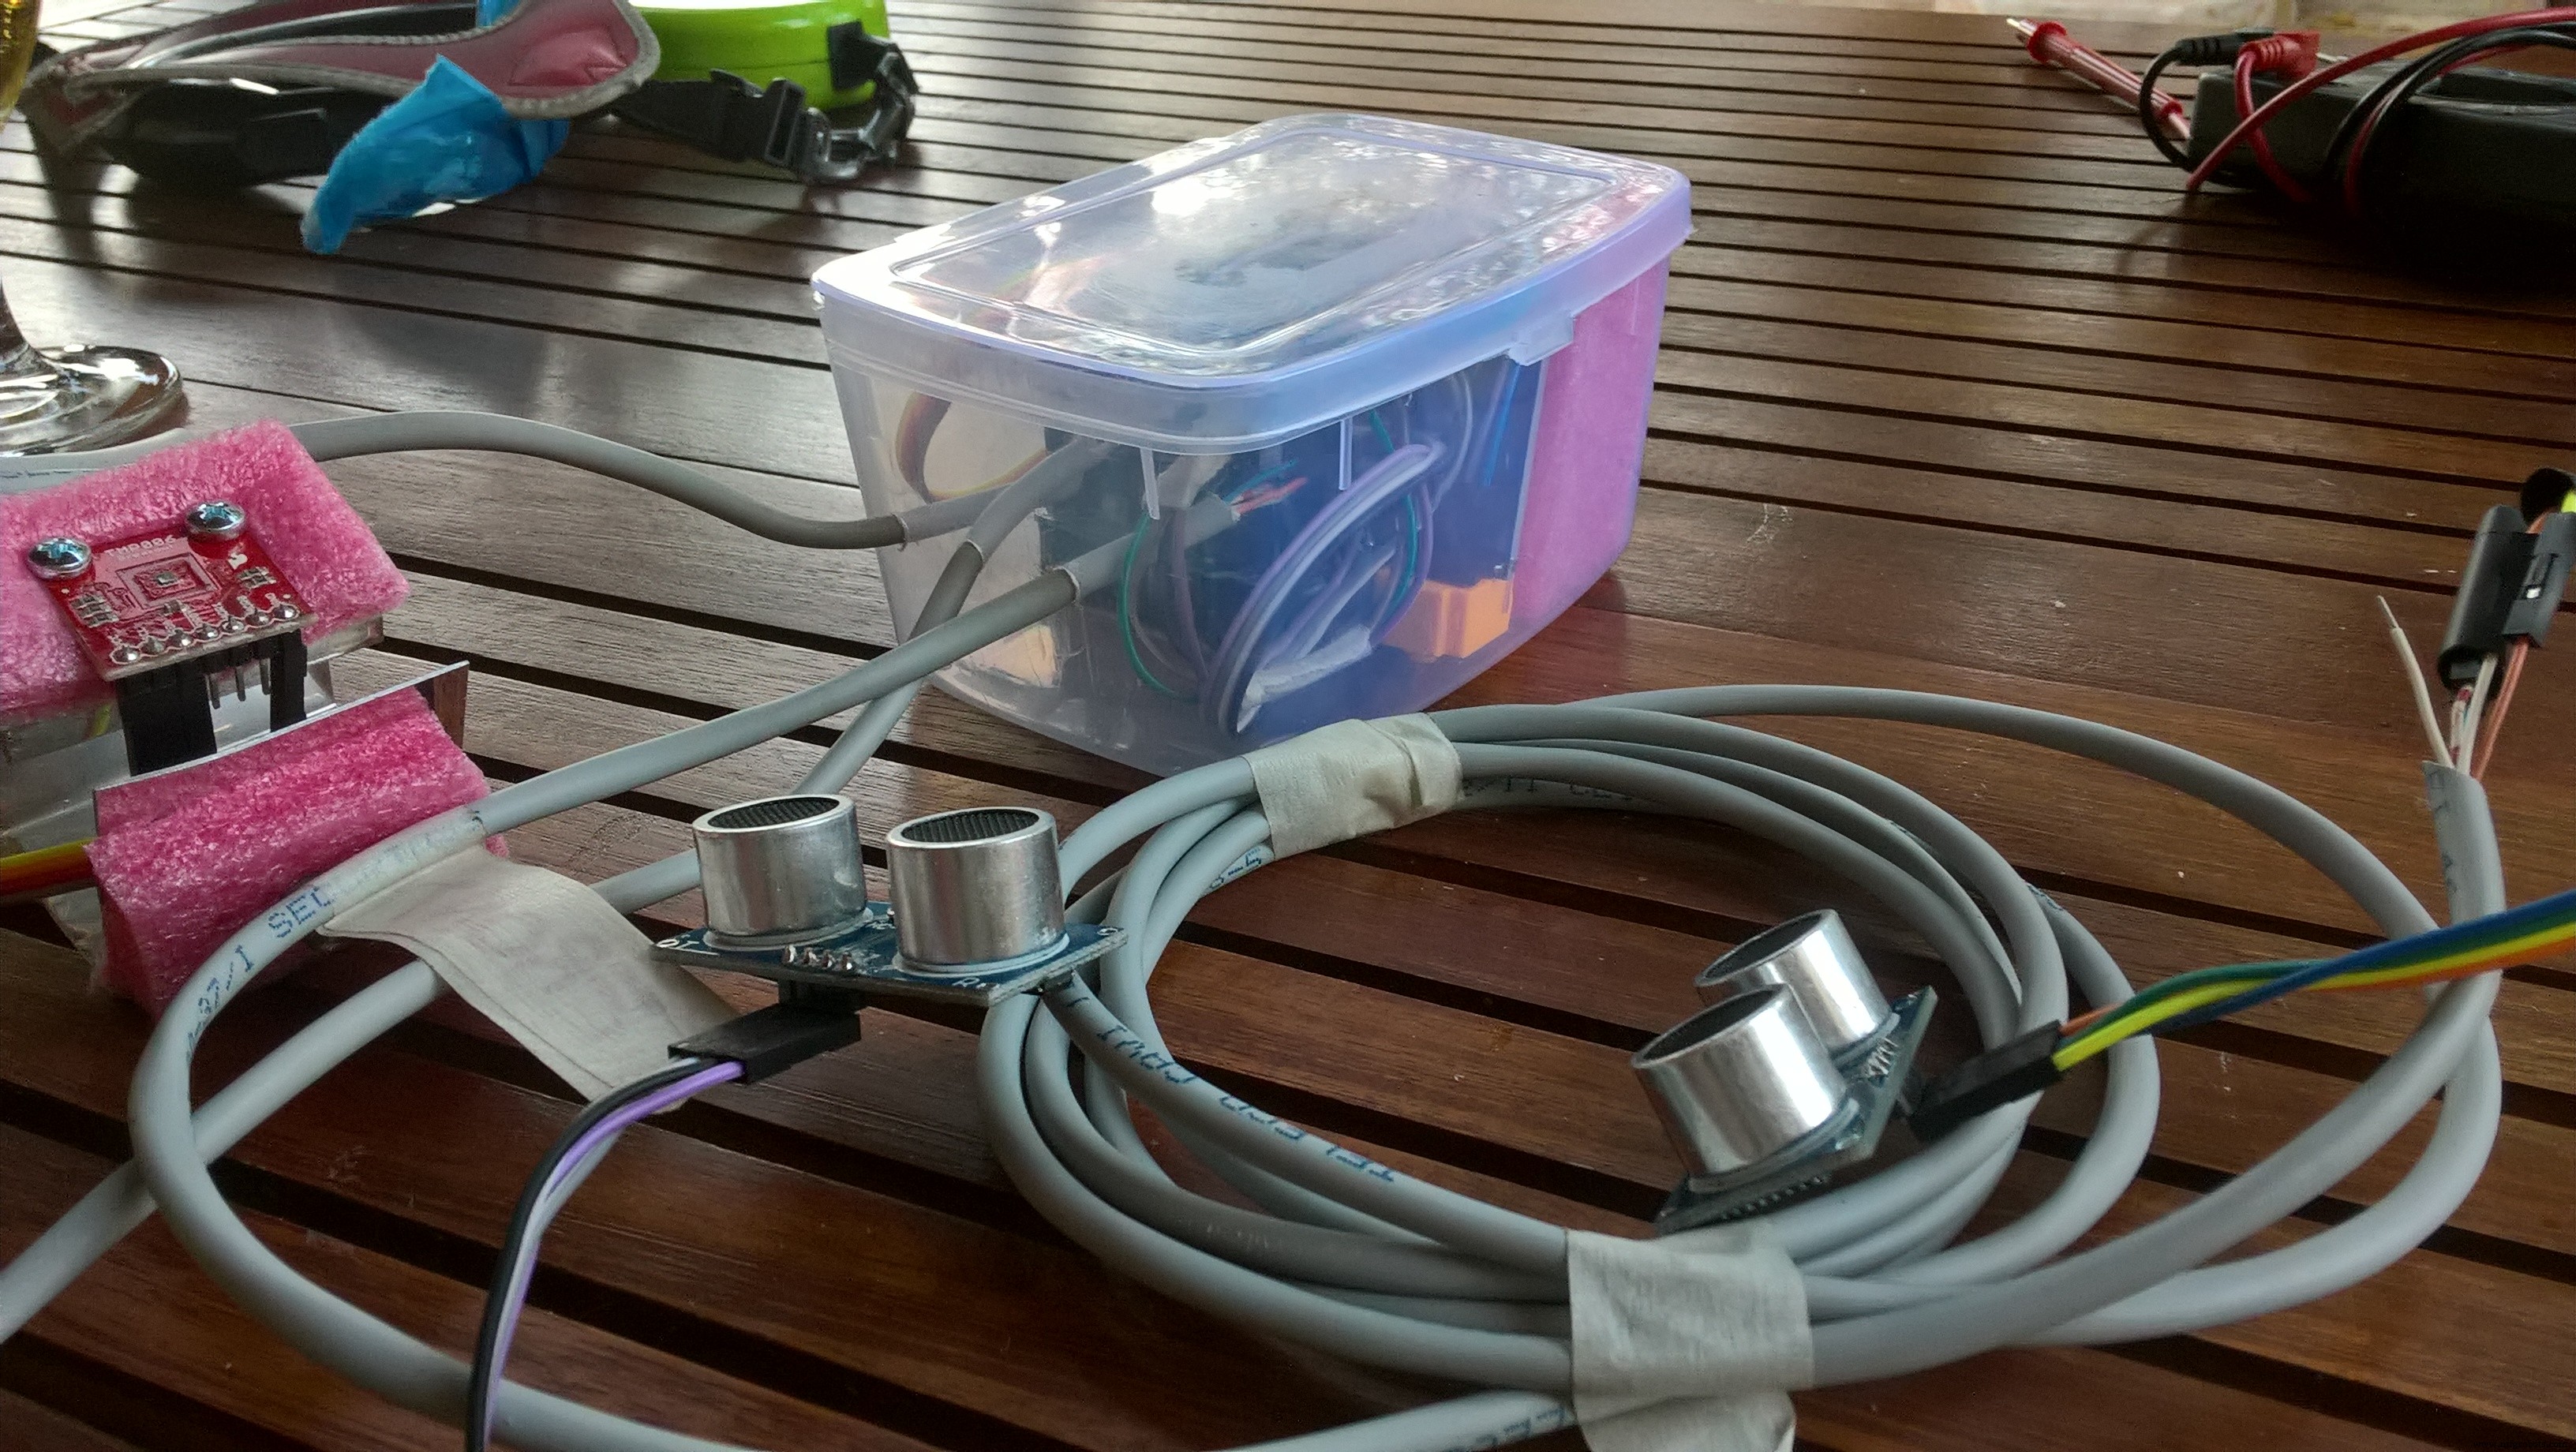
to measure the tyre temperature I created a bracket clamped behind the wheel.
One Ultrasonic ranging module HC-SR04 has been fixed under the front headlight. It misures the distance between headlight and front mudguard.
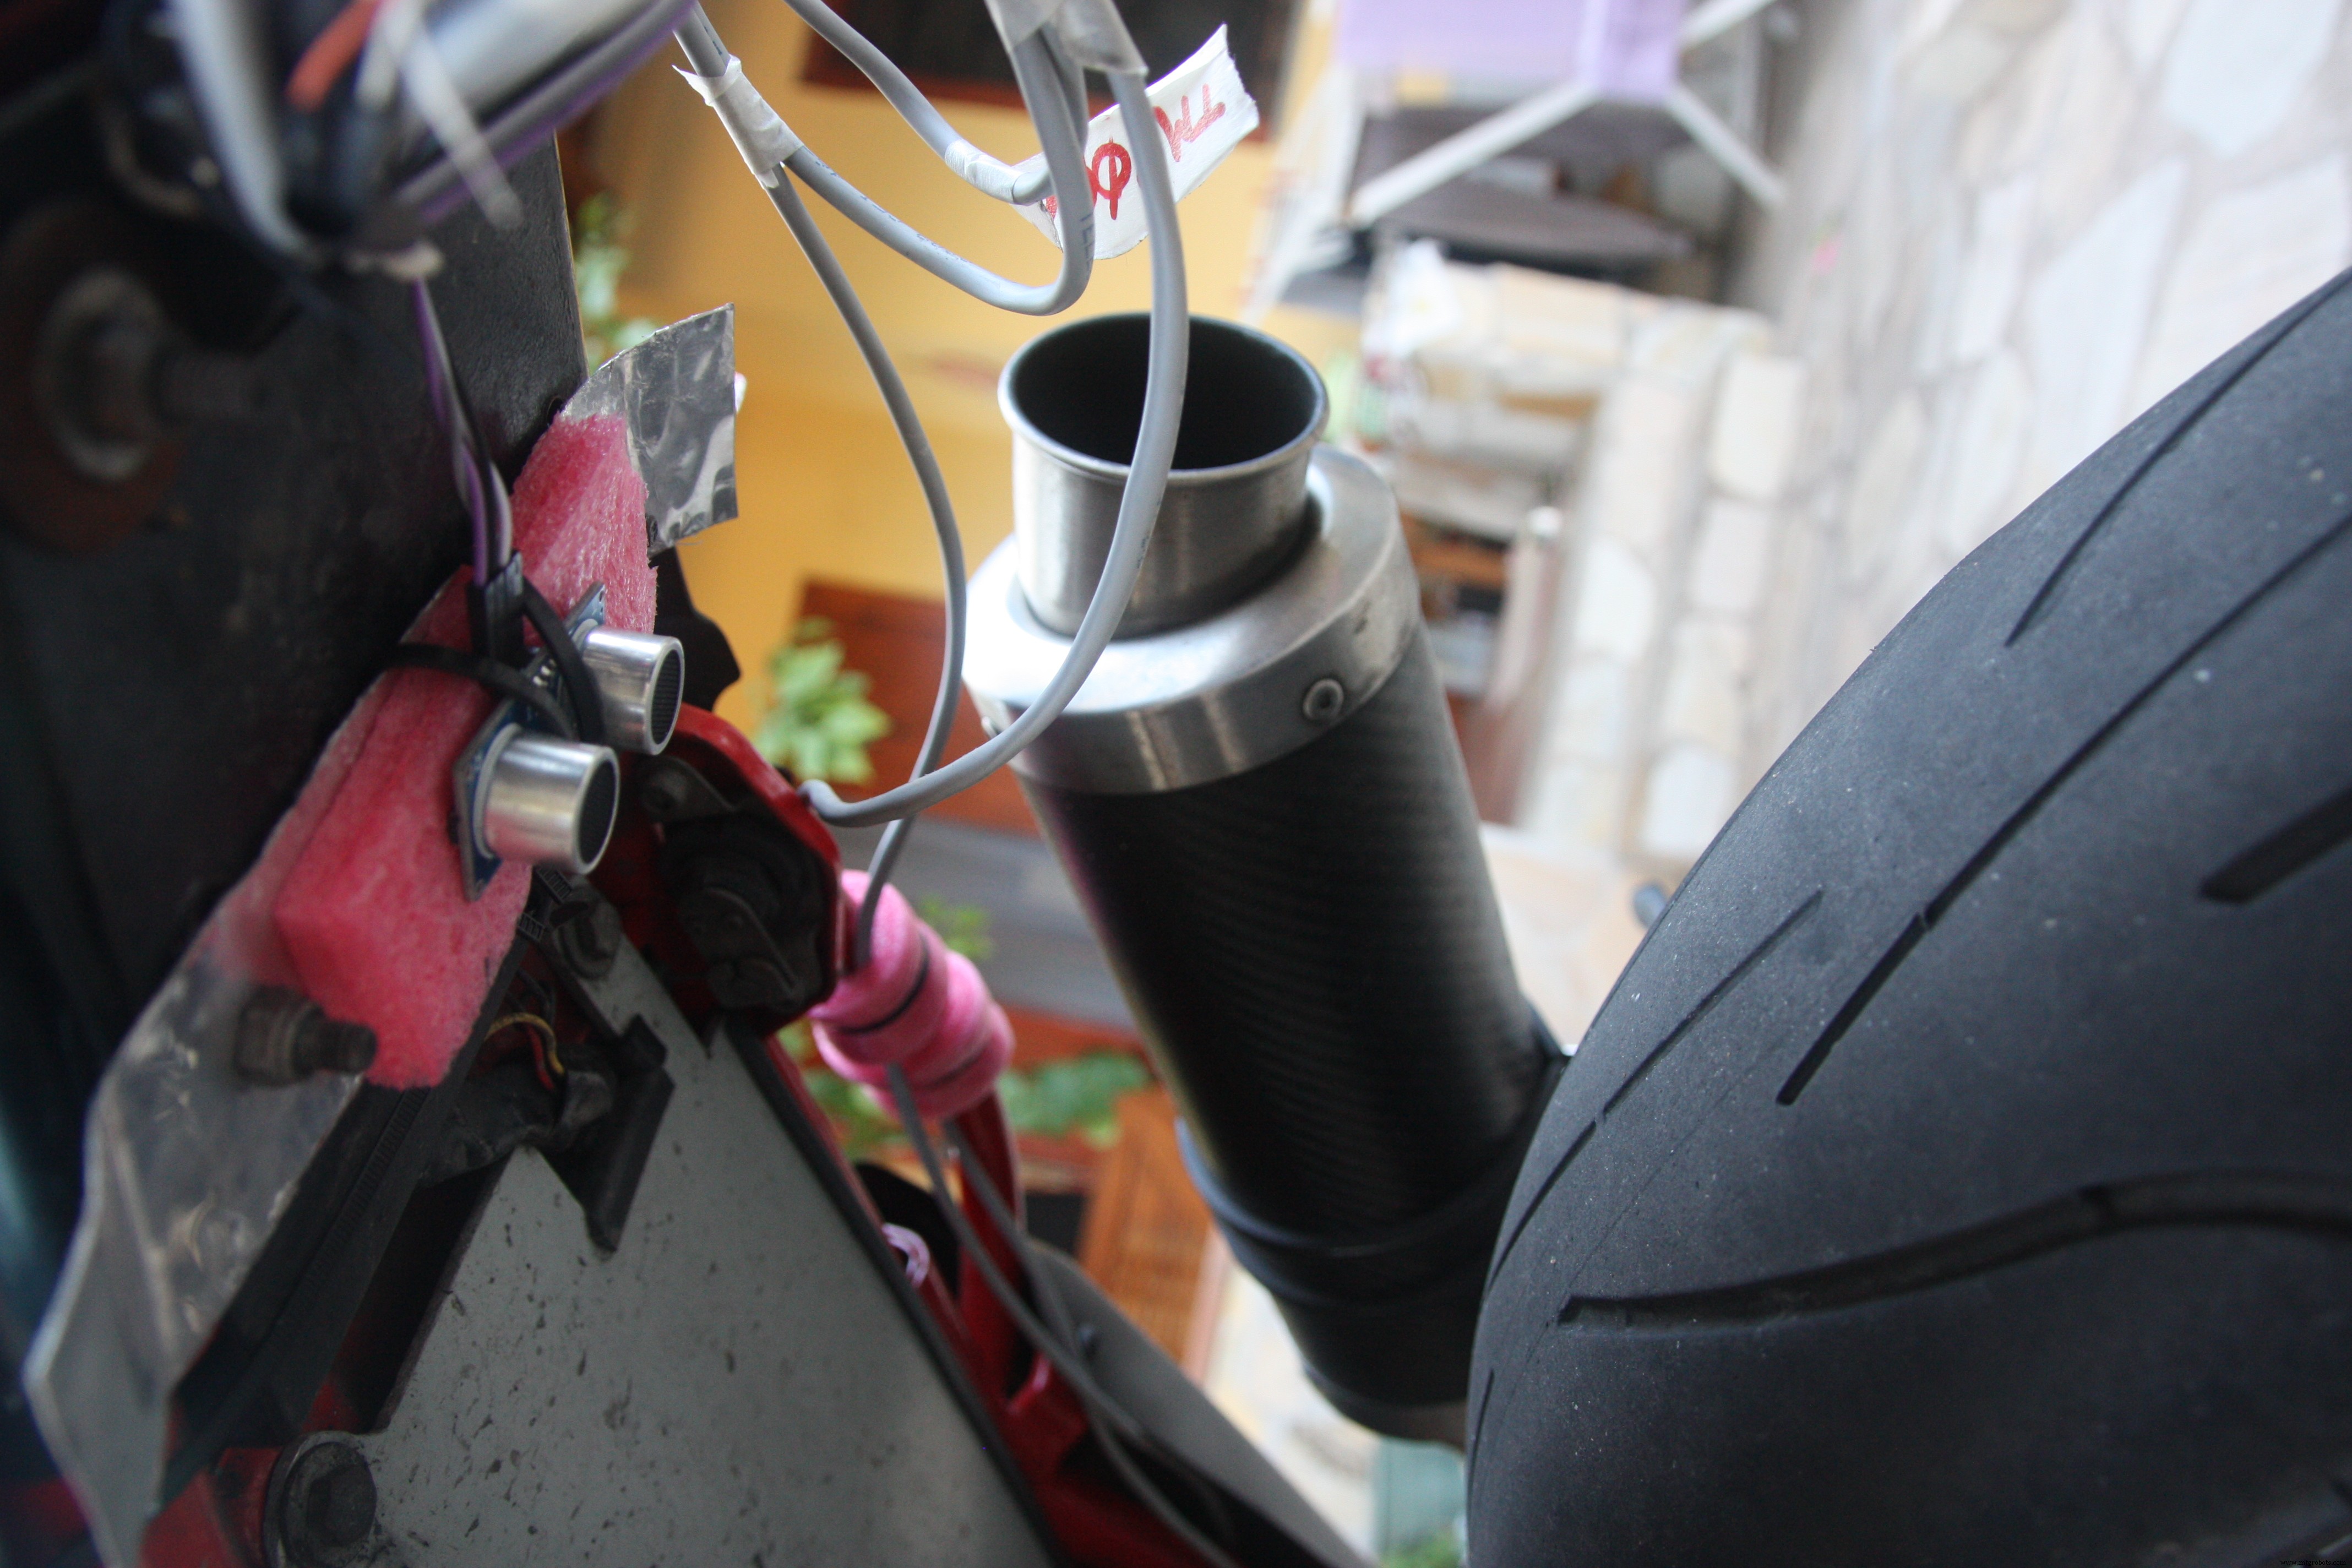
The other one Ultrasonic ranging module has been fixed under the bike seat in order to determined the back shock absorber measuring the distance between seat and rear tyre.
The central unit containing the Arduino, the GPS, the Accelerometer and the external temperature sensor has been fixed behind the seat.

And at the end, after the wiring, my motorbike is look like this

Machine Learning
The last idea of this project has been try to understand if exist a correlation between telemetries data in order to try to understand how to improve my driving style.
My data samples are not relatable because I make different routes every time and the traffic conditions are never the same. I think that a good condition should be use the system in a speedway. I Imagine that in a real race could be usefull to understand by telemetry if you can increase the speed or if you have to decrease the speed according to the output values.
The Machine Learning (ML) embodies the magic of software insights about the data, solves problems by giving information that represents a certain evolution. The ML understands how a given phenomenon will evolve according to the data in its knowledge.
The first approach using the ML is to do Experiments . Using the data, you can play and be able to do the analysis with the aim of investigating the phenomenon that interests us.
Ok let's go to discover the Azure Machine Learning
Go to https://studio.azureml.net and sign in using your Azure account.
On the left of the page click on "Studio"
You will be redirect to your personal Dashboard and now you will be ready to create experiments
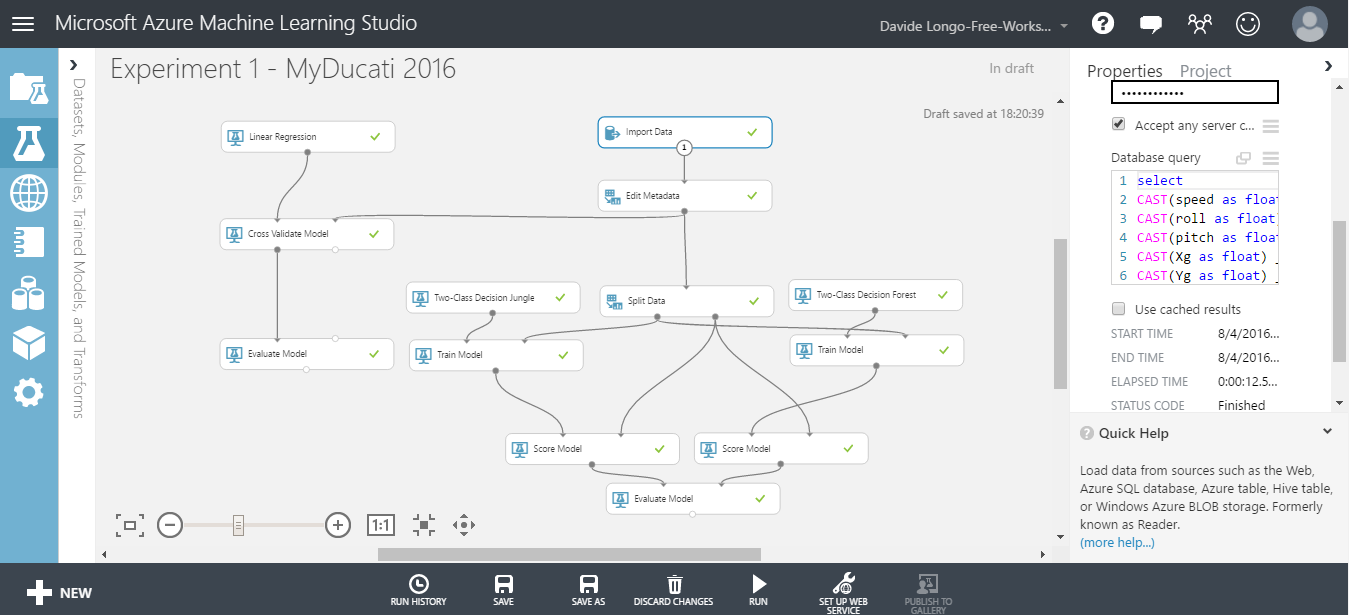
 <울>
<울> 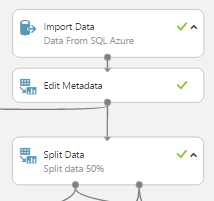
 <울>
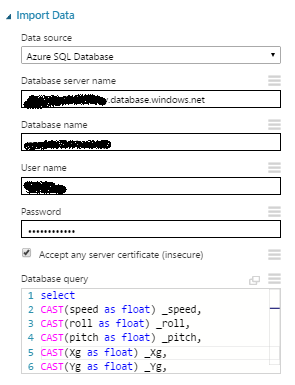
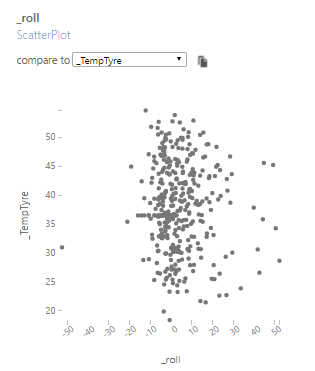
<울> select CAST(speed as float) _speed, CAST(roll as float) _roll, CAST(pitch as float) _pitch, CAST(Xg as float) _Xg, CAST(Yg as float) _Yg, CAST(Zg as float) _Zg, CAST(TempExt as float) _TempExt, CAST(TempTyre as float) _TempTyre, CAST(FrontAbsorber as float) _FrontAbsorber, CAST(BackAbsorber as float) _BackAbsorberfrom mytelemetrywhere CAST(speed as float)>3 and CAST(FrontAbsorber as float)>0 and CAST(BackAbsorber as float)>0 and CAST(roll as float)<60 and CAST(roll as float)>-60  <울>
<울>
Official Documentation about " Evaluate Model" can be found here
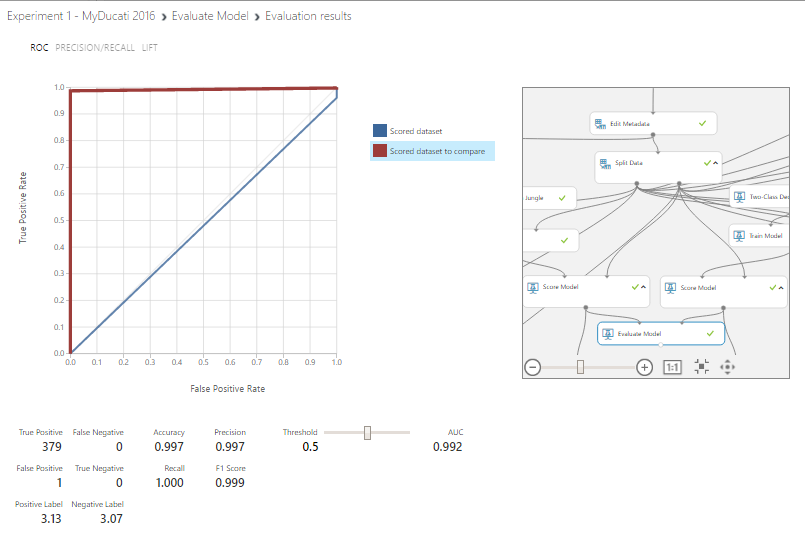
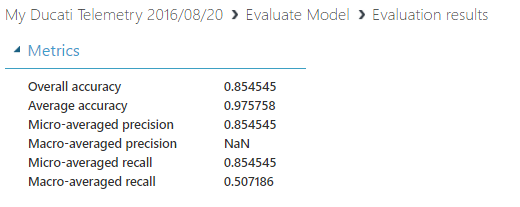
Below there is a sample experiment useful for comparing 2 algorithms using the Evaluation Model , the 2 algorithms are Two-class decision jungle and Two-class decision forest .
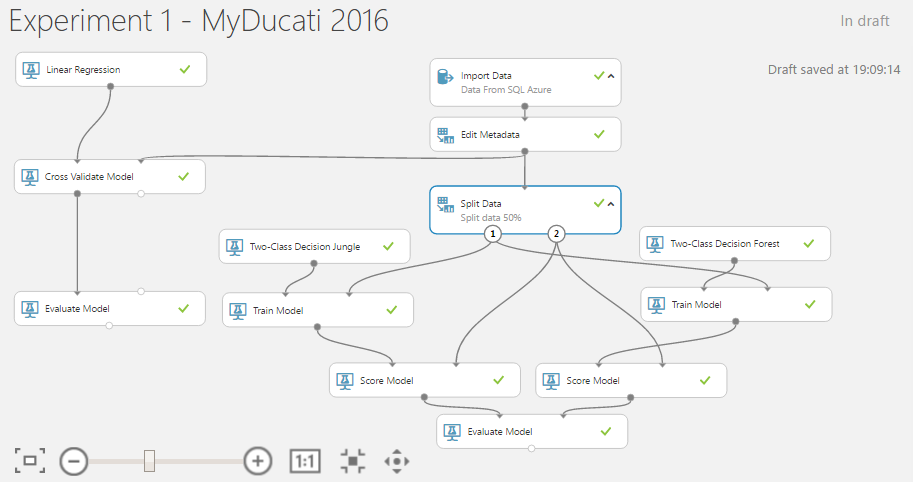
When you pass on a scored model for a "two classes" classification algorithm, the evaluation model generates metrics shown below:
Classification Models
The above metrics are reported for evaluating classification models.
(All metrics are reported but the models are ranked by the metric you select for evaluation)
<울>As you can see, the Two-class decision forest Algorithm have an Accuracy , Precision ,Recall and F1 Score near the value equal to 1, so i suppose that my model is good described, GREAT !!!
For more details about Evaluate Model please visit the following LINK
Predictive Experiment:
It's time to move our attention on the predictive functionality of the machine learning.
The Training experiment will be convert to a predictive experiment, this feature allows to integrate in others applications the opportunity to use your model and based on your model have a Prediction.
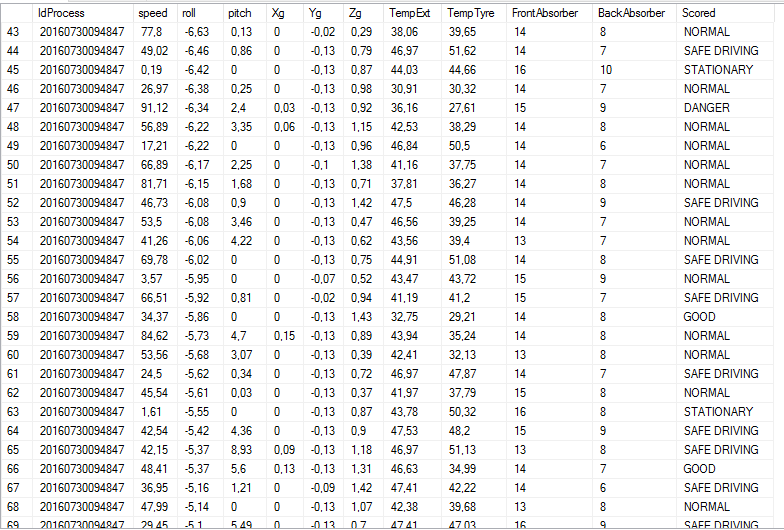
For do that, has been created a new one Experiment, the data source has been the SQL Azure but this time the table used has been a new one. I tried to classify data based on telemetry values.
Now my data look like this and as you can see there is a new column named Scored that represents my classification:
Create the experiment like below, select the Train Model and add a Multiclass algorithm:
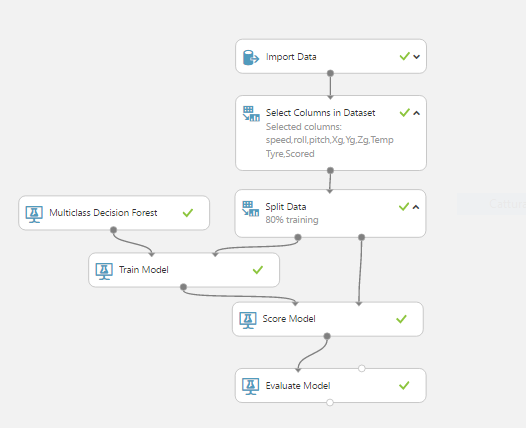 <울>
<울> 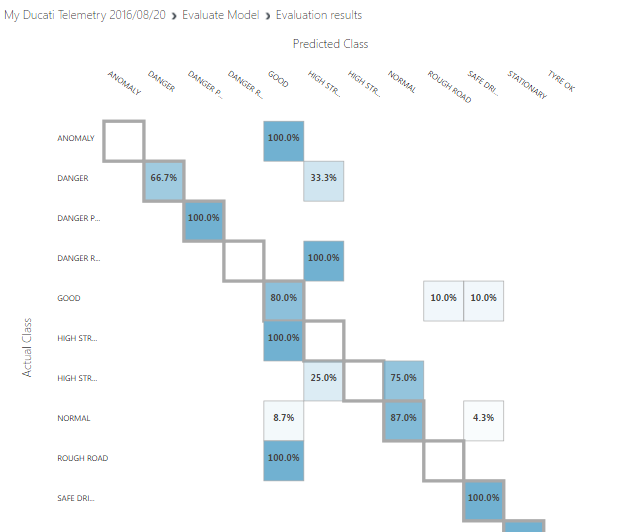
 <울>
<울> 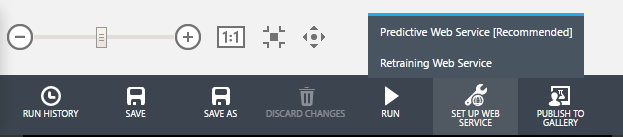 <울>
<울> 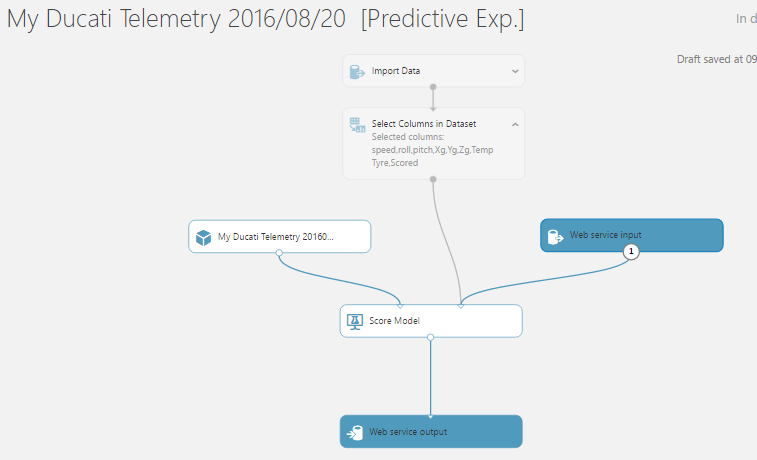 <울>
<울>  <울>
<울> 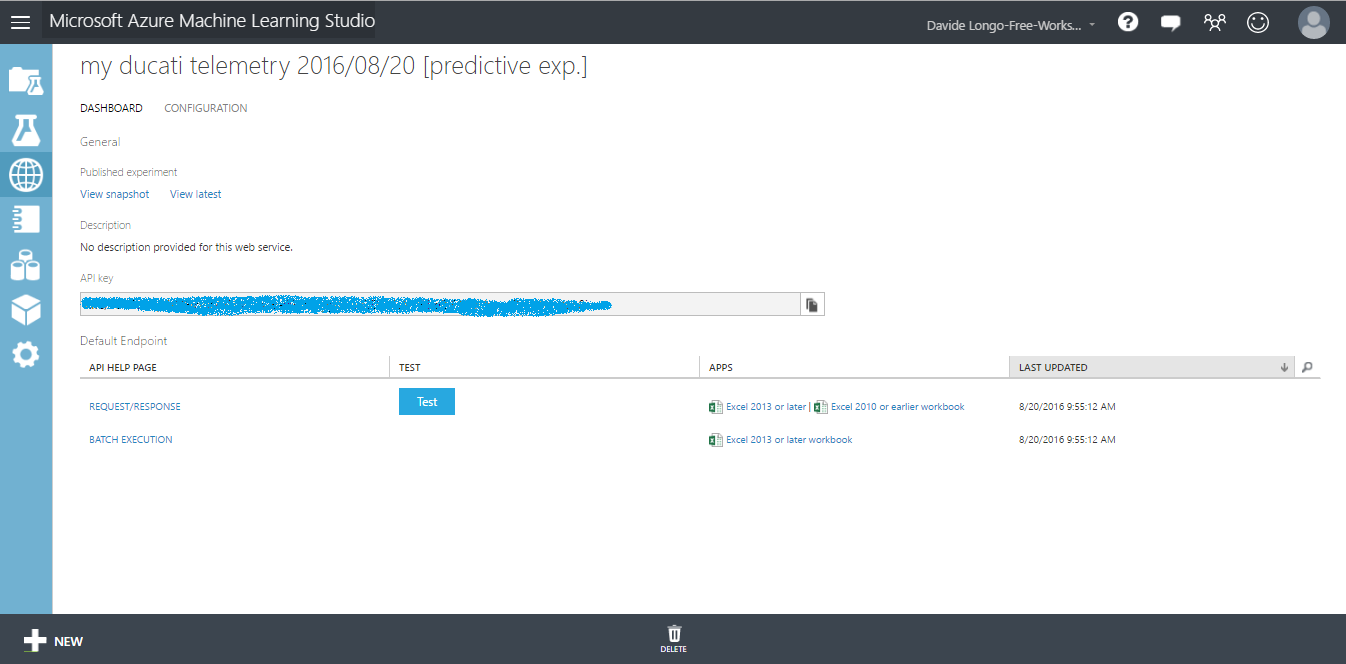 <울>
<울> 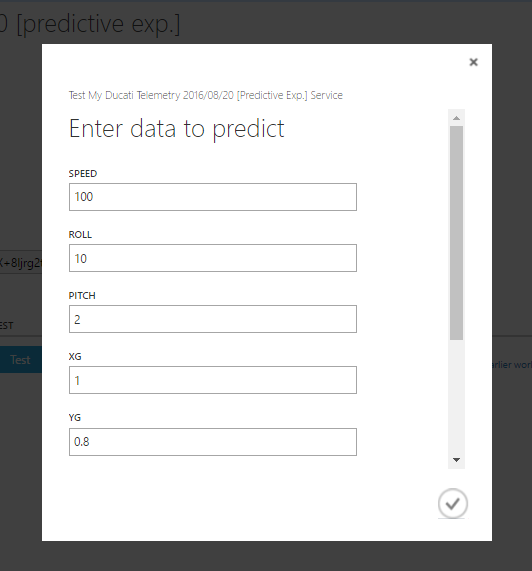

As you can see the result is equal to "SAFE DRIVING ", this mean that my Predictive service has predicted that my driving style is Safe and no action is needed.
If the Result has been for example "HIGH STRESS HIGH SPEED " that means that I have to reduce speed!
Conclusions about ML:
in this section we understand some things.
<울>
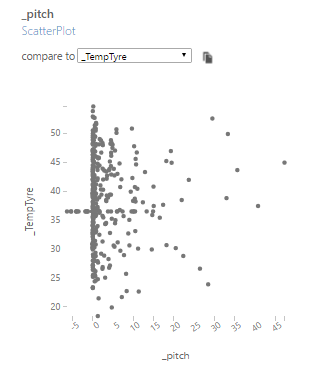
I prefer lean on the right and my lean angle doesn't depend for tyre temperature and from the speed. That mean that my tyres are high quality and in add I undestood that my motorbike prefers Wheelie when the tyre temperature is more than 35°C
Final Conclusions
In this project we covered many technological areas.
We discovered How is possible to create a funny Hardware using an Arduino and some sensor spending less then 60$ and using many services provided by microsoft.
We learned how is easy use Azure and how is interesting use Machine Learning Studio suite.
Has been realized a prototype that certainly needs improvements but i think is a good starting point for future developments from each people enthusiast about C#, Azure, Arduino and MotorBike.
Possible future Developments
To Improve this prototype i think will be usefull implements some things:
<울>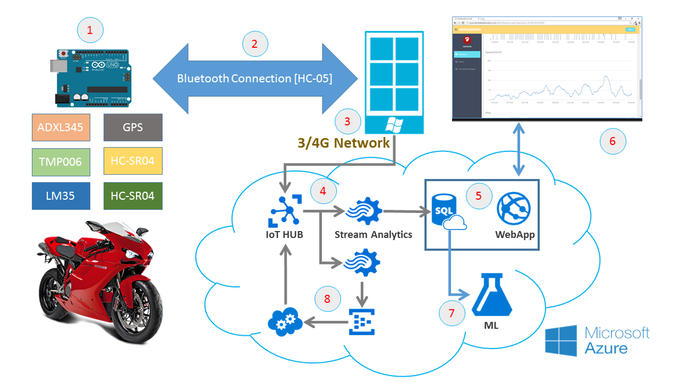
New branch work flow:
<울>... and now ENJOY !! :-) feel free to contact me for any questions and tips.
<섹션 클래스="섹션 컨테이너 섹션 축소 가능" id="코드">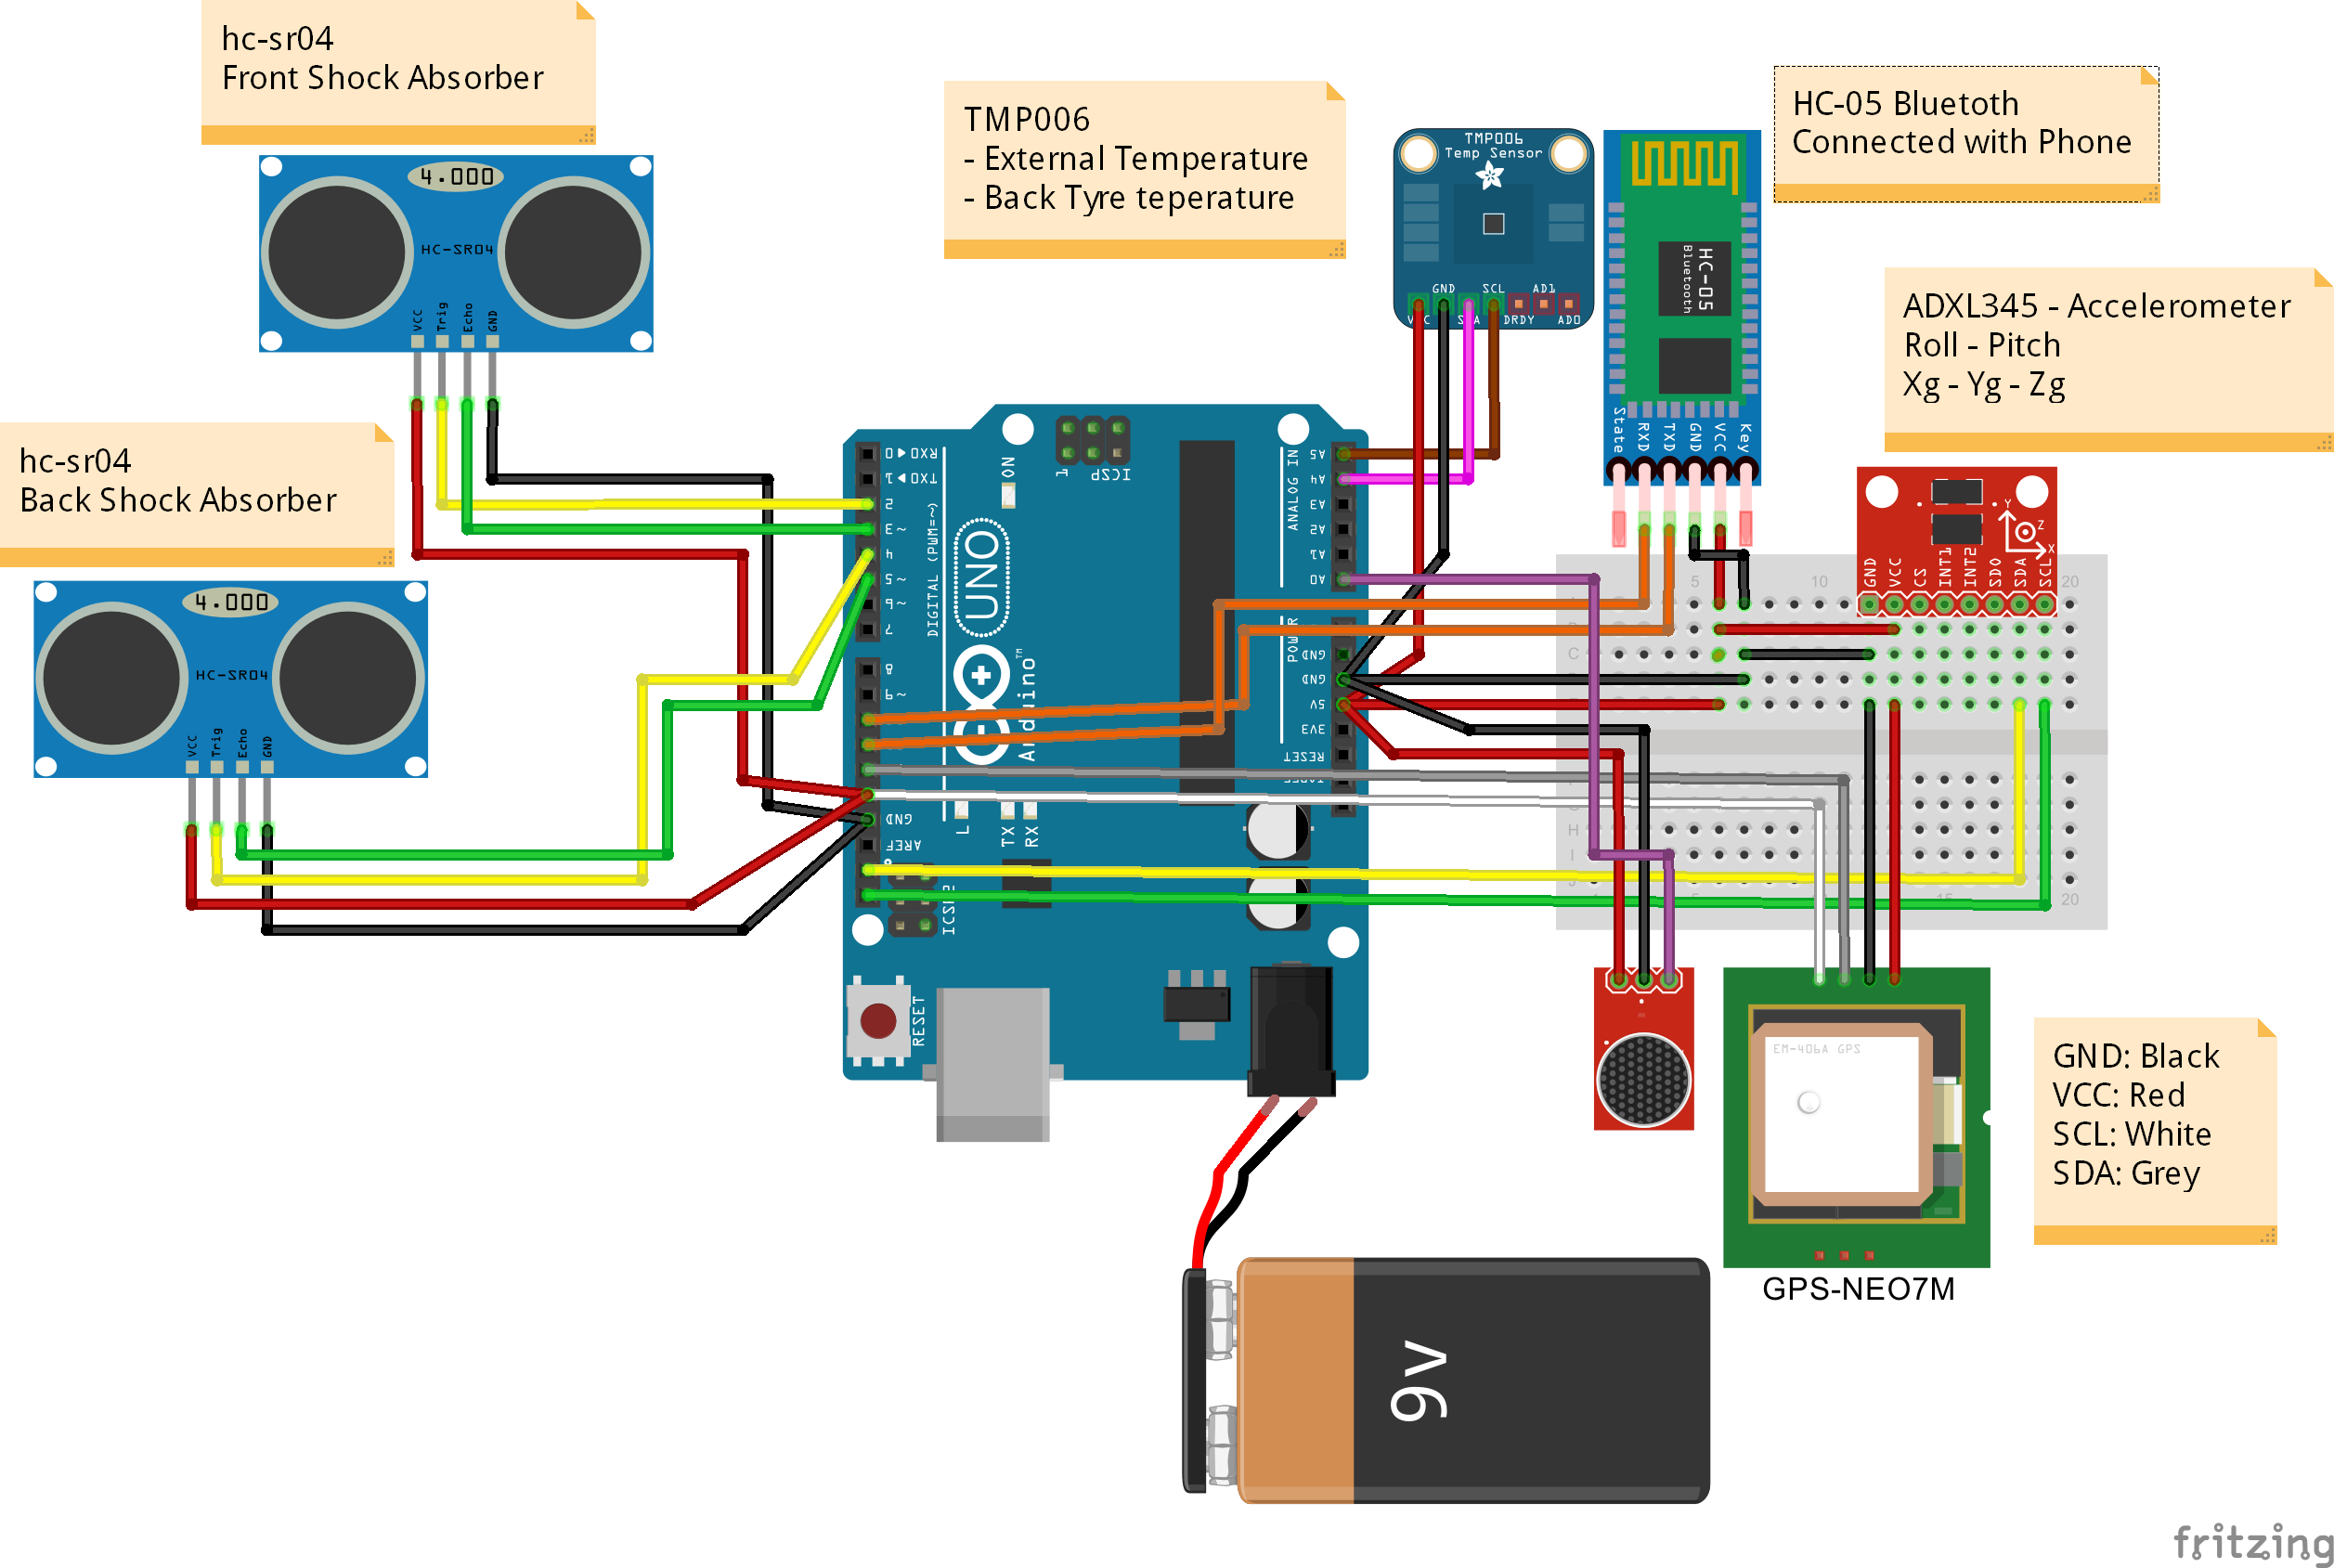 MotorbikeProject.fzz
제조공정
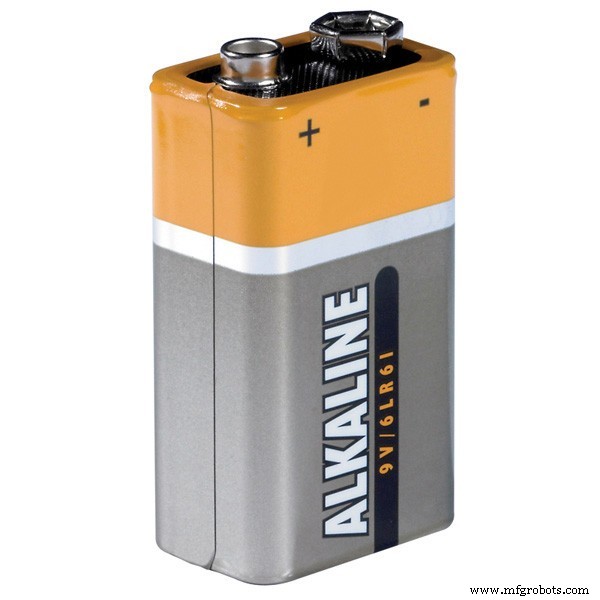
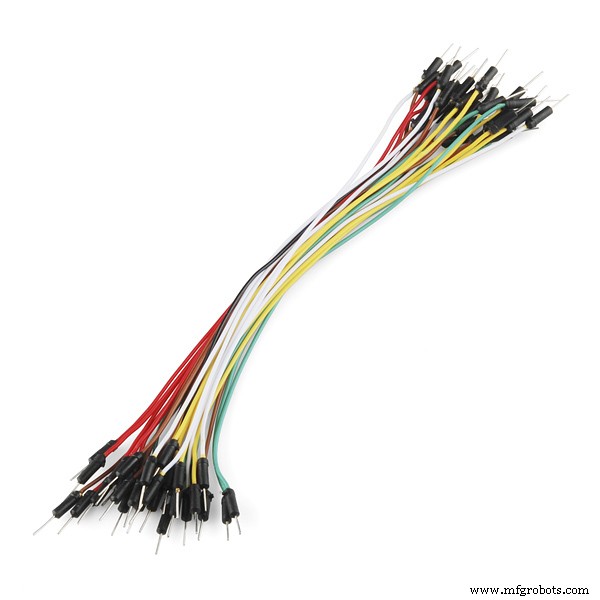
구성품 및 소모품 Arduino UNO × 1 SparkFun 330옴 저항기 4개만 필요합니다 × 1 SparkFun 10k 옴 저항기 4개만 필요합니다 × 1 SparkFun 모듬 LED 다른 색상의 LED 4개가 필요합니다. × 1 SparkFun Mini 스피커 사운드에 신경 쓰지 않는다면 이것 없이도 할 수 있습니다. × 1 SparkFun BreadBoard(전체 크기) × 1 점퍼 와이어(일반) × 1
구성품 및 소모품 Arduino UNO × 1 SparkFun 3축 가속도계 브레이크아웃 - ADXL335 × 1 RF 모듈 434MHz × 1 HT12D × 1 HT12E × 1 SparkFun 듀얼 H-Bridge 모터 드라이버 L298 × 1 PCB 프로토타이핑(일반) × 1 선형 조정기(7805) × 2 DC 모터(일반) × 1 앱 및 온라인 서비스