

제조공정

산업 제조
 |
| × | 1 | |||
 |
| × | 1 | |||
 |
| × | 1 | |||
| × | 1 | ||||
| × | 1 | ||||
| × | 1 |
 |
|
 |
| |||
 |
| |||
 |
| |||
| ||||
 |
|
프로젝트 개요
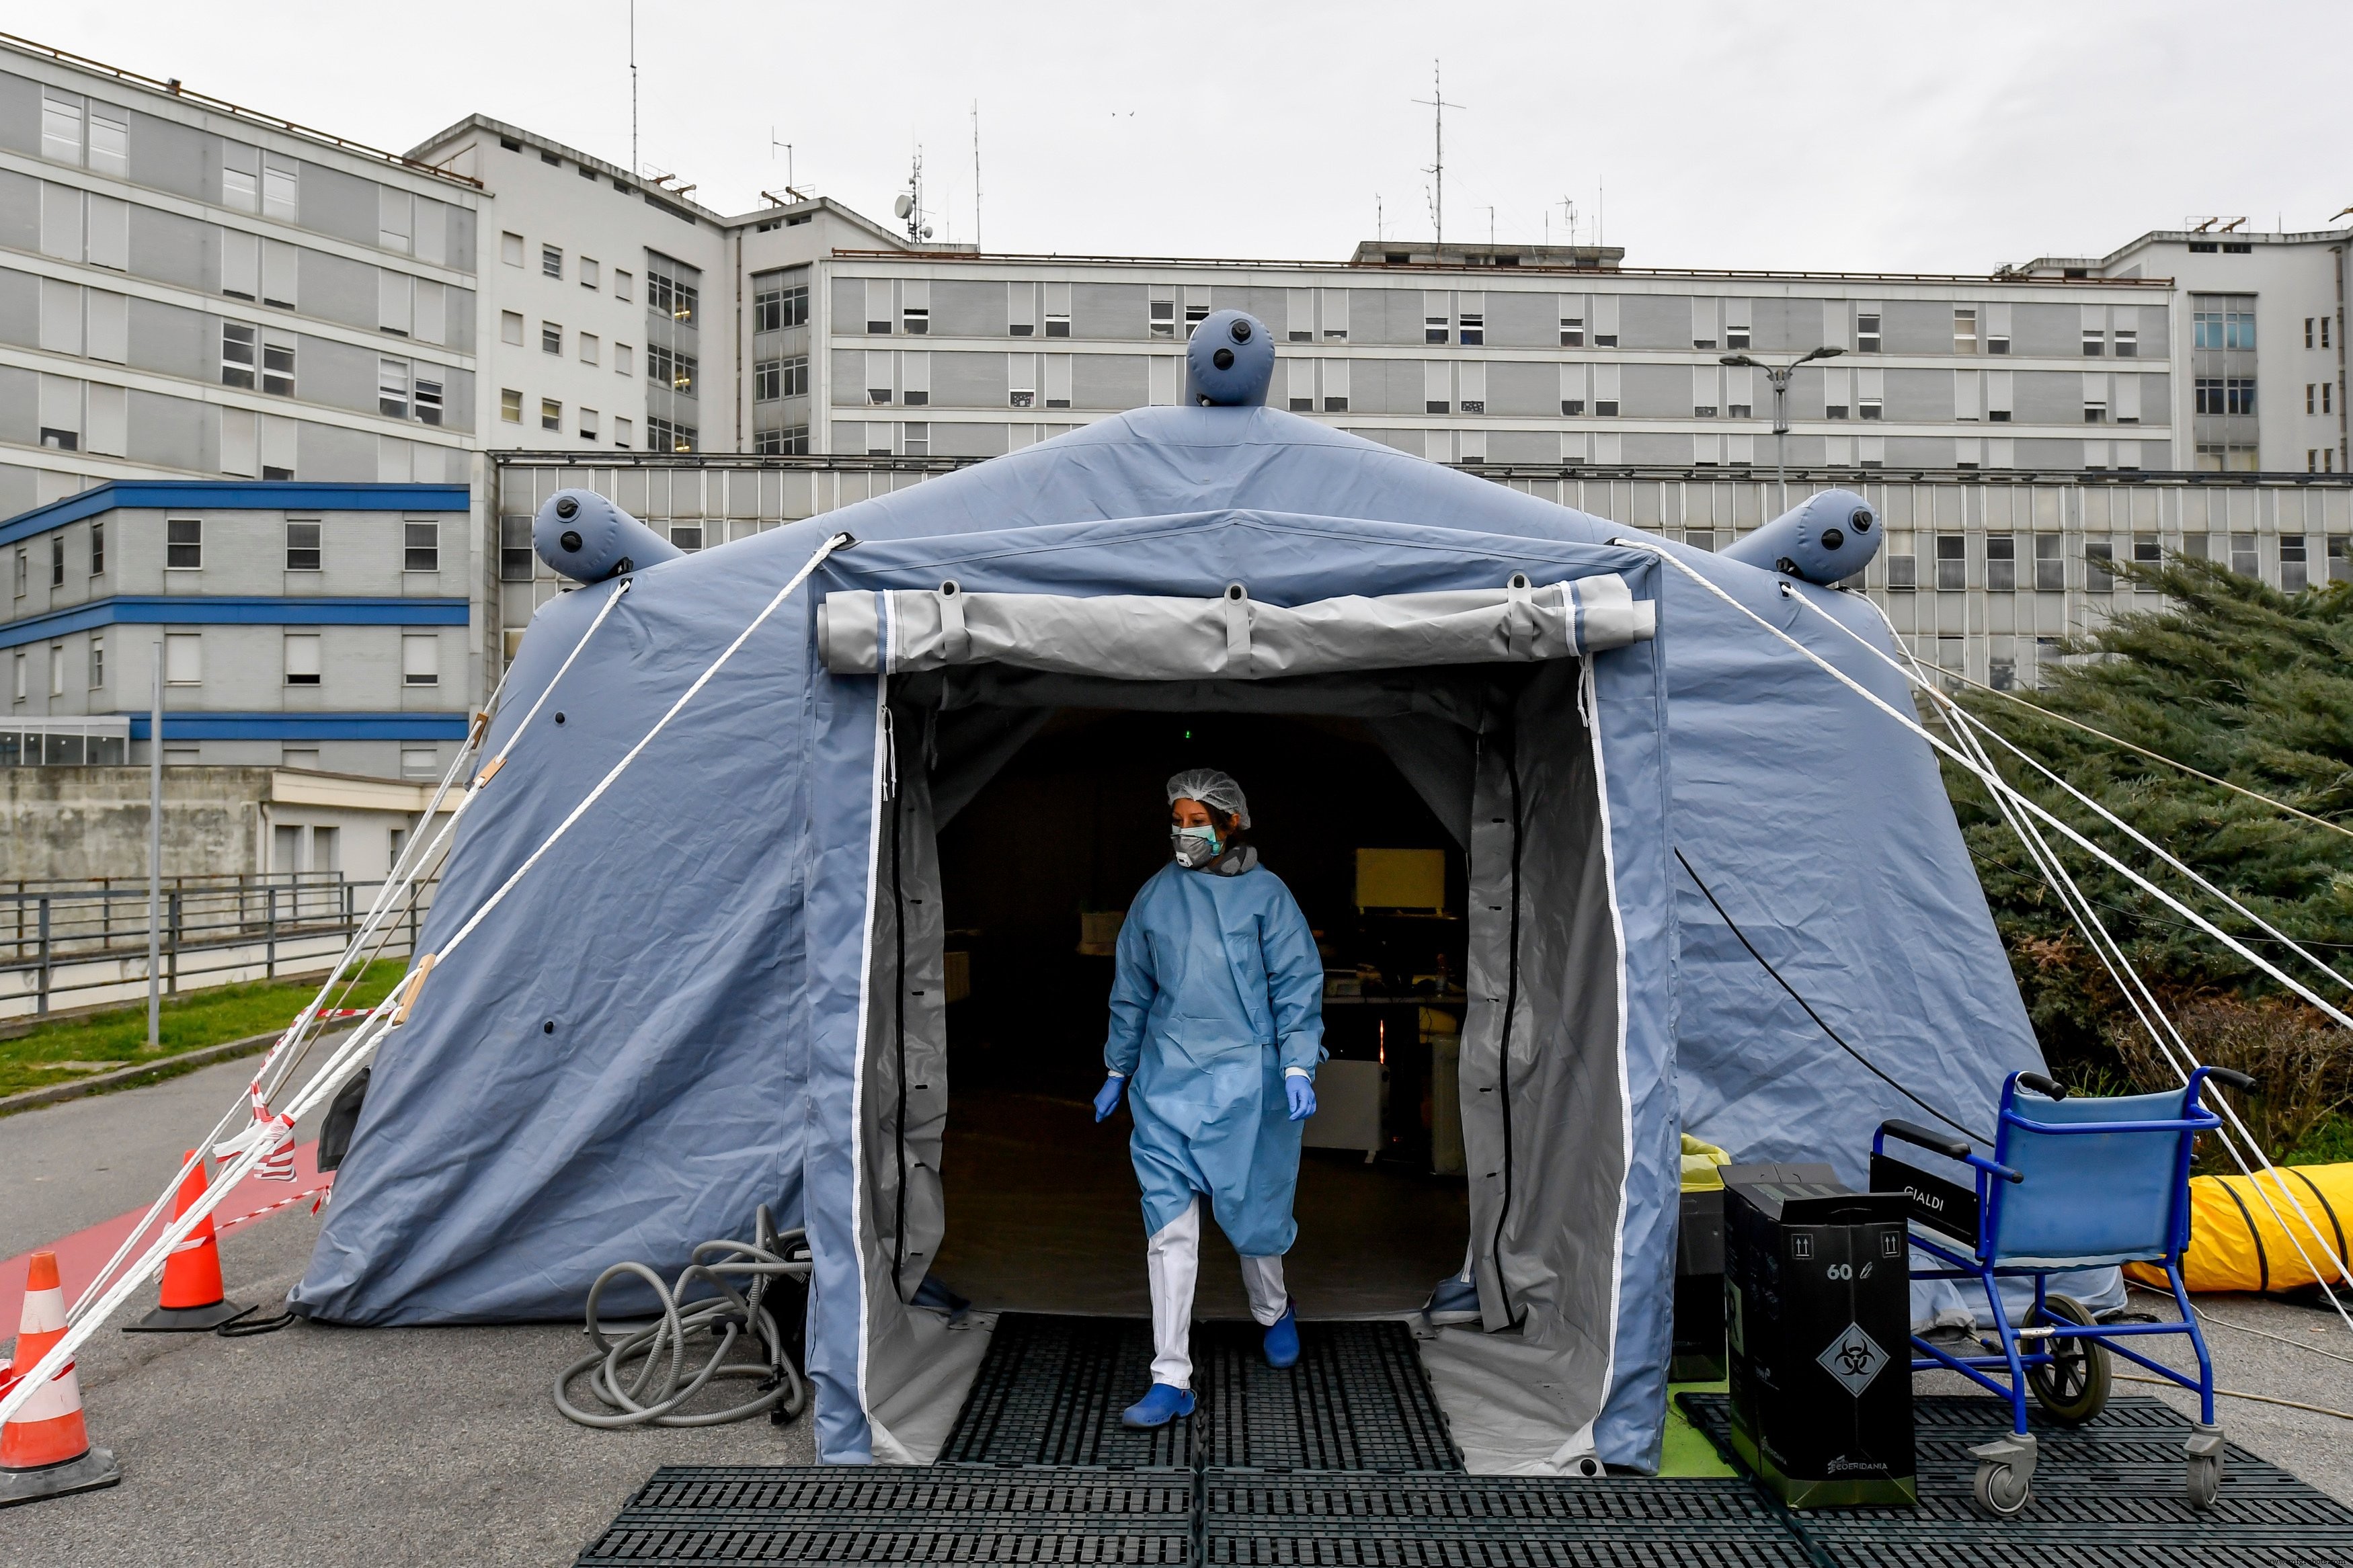
나는 과거에 이 주제를 과도하게 읽고 있는 자신을 발견했고, 나는 이 연약한 순간에 세상을 도울 솔루션, 변화를 만들고 우리 발밑에서 변화하는 세상에서 우리가 번성하도록 도울 솔루션을 생각하는 데 몇 시간을 소비하게 되었습니다. .
약한 형태의 바이러스를 돌보는 방법을 살펴보았습니다. . 종종 간과되는 사람들의 범주. 이들은 불행하게도 바이러스에 감염되었지만 약한 증상만 있는 운이 좋은 사람들입니다. . 그러나 이 환자의 건강은 극도로 불안정합니다. 몇 시간 안에 악화 . 그들의 건강을 자세히 모니터링해야 합니다.
결과적으로 국가는 이러한 환자를 돌보는 데 다양한 접근 방식을 사용합니다. 일부는 입원합니다. (사람이 많은 병원 교외에서 모니터링할 수 있는 환자의 경우), 다른 사람들은 집에서 자가 격리하도록 보냅니다 . 그러나 두 번째 옵션에는 문제가 있습니다. 이 환자의 건강은 급속히 악화될 수 있습니다. 따라서 모니터링해야 합니다.
이 작업을 수행하는 무겁고 부피가 큰 장비가 분명히 존재합니다. 그러나 문제는 분명합니다. 대다수의 아픈 인구가 약한 형태의 바이러스를 나타내므로 이 비싸고 불편한 장치는 확장할 수 없고 전체에 배포할 수 없습니다. 인구(가격과 부피 때문에). 이것은 말할 필요도 없이 일부 환자는 집을 "기피"하고 바이러스에 대해 별로 신경 쓰지 않습니다. 이러한 사람들은 사회와 자신에게 위험하므로 집을 떠나지 않도록 모니터링해야 합니다.
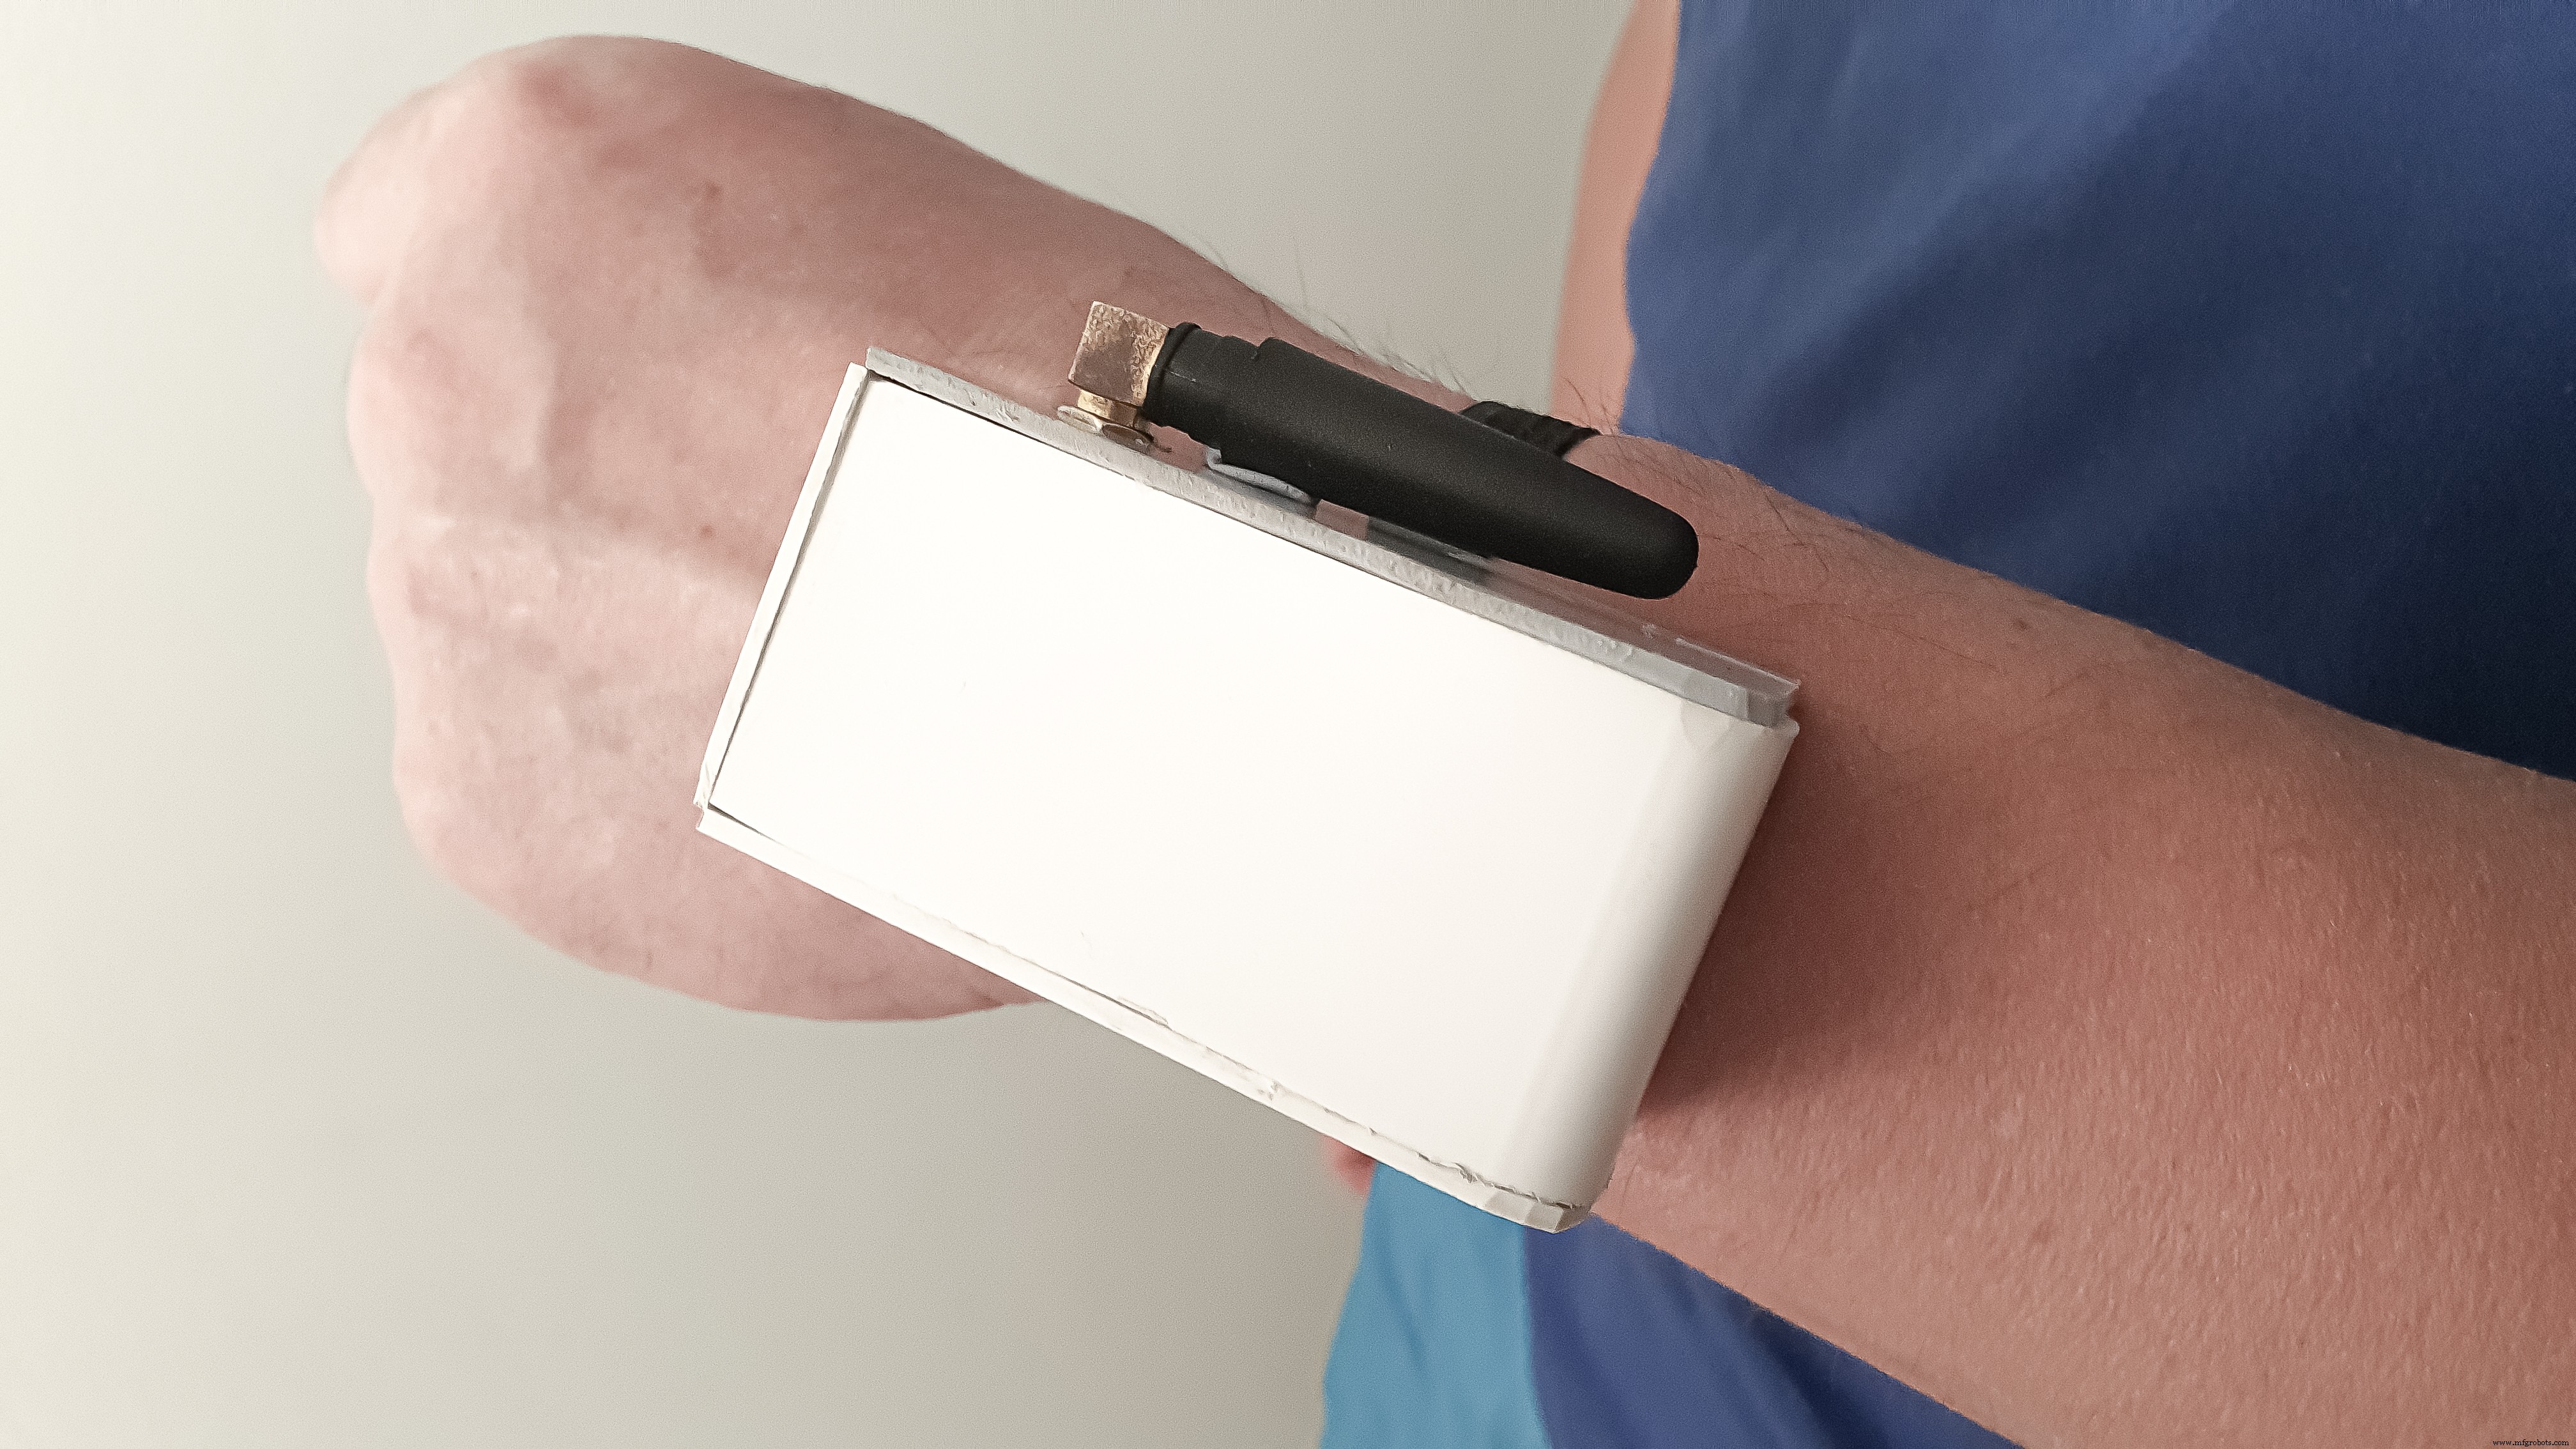
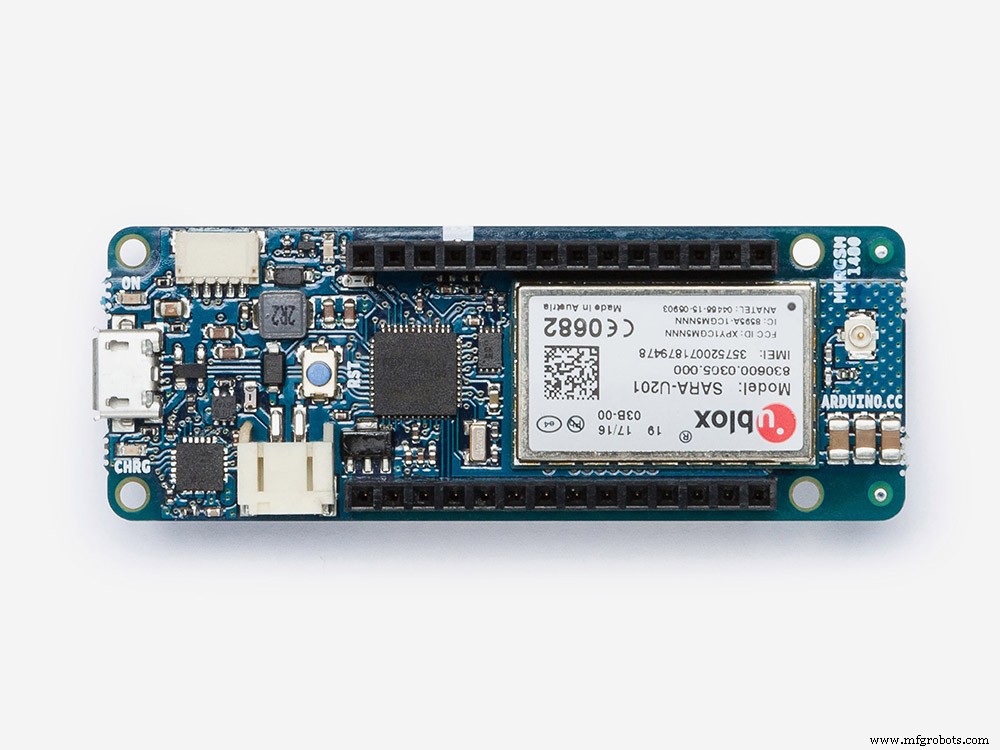
SmartWristband는 손목 밴드로 고정되는 장치입니다. 환자의 활력 및 지리적 위치 모니터링 그들이 집의 제약 내에서 바이러스와 싸우는 동안 그들의 안전을 돌보는 것. 기기는 Arduino MKR GSM 1400으로 구동됩니다. IR 온도 및 심박수 센서가 모두 장착되어 있습니다. 환자의 건강에 대한 중요한 정보를 수집합니다. 높은 온도와 불규칙한 심박수는 바이러스 진행의 징후입니다. 환자는 이러한 변경 사항을 즉시 알아차리지 못합니다. SmartWristband는 이를 수행하고 데이터를 실시간으로 안전하게 스트리밍하는 것을 목표로 합니다. 환자를 모니터링하는 병원으로 이동합니다.
또한 기기는 사용자의 위치를 추적합니다. 항상 집에 있는지 확인 . 이 모든 데이터는 확장 가능한 데이터베이스에 중앙 집중화됩니다. 수천 개의 이러한 장치를 국제적으로 배포할 수 있습니다.
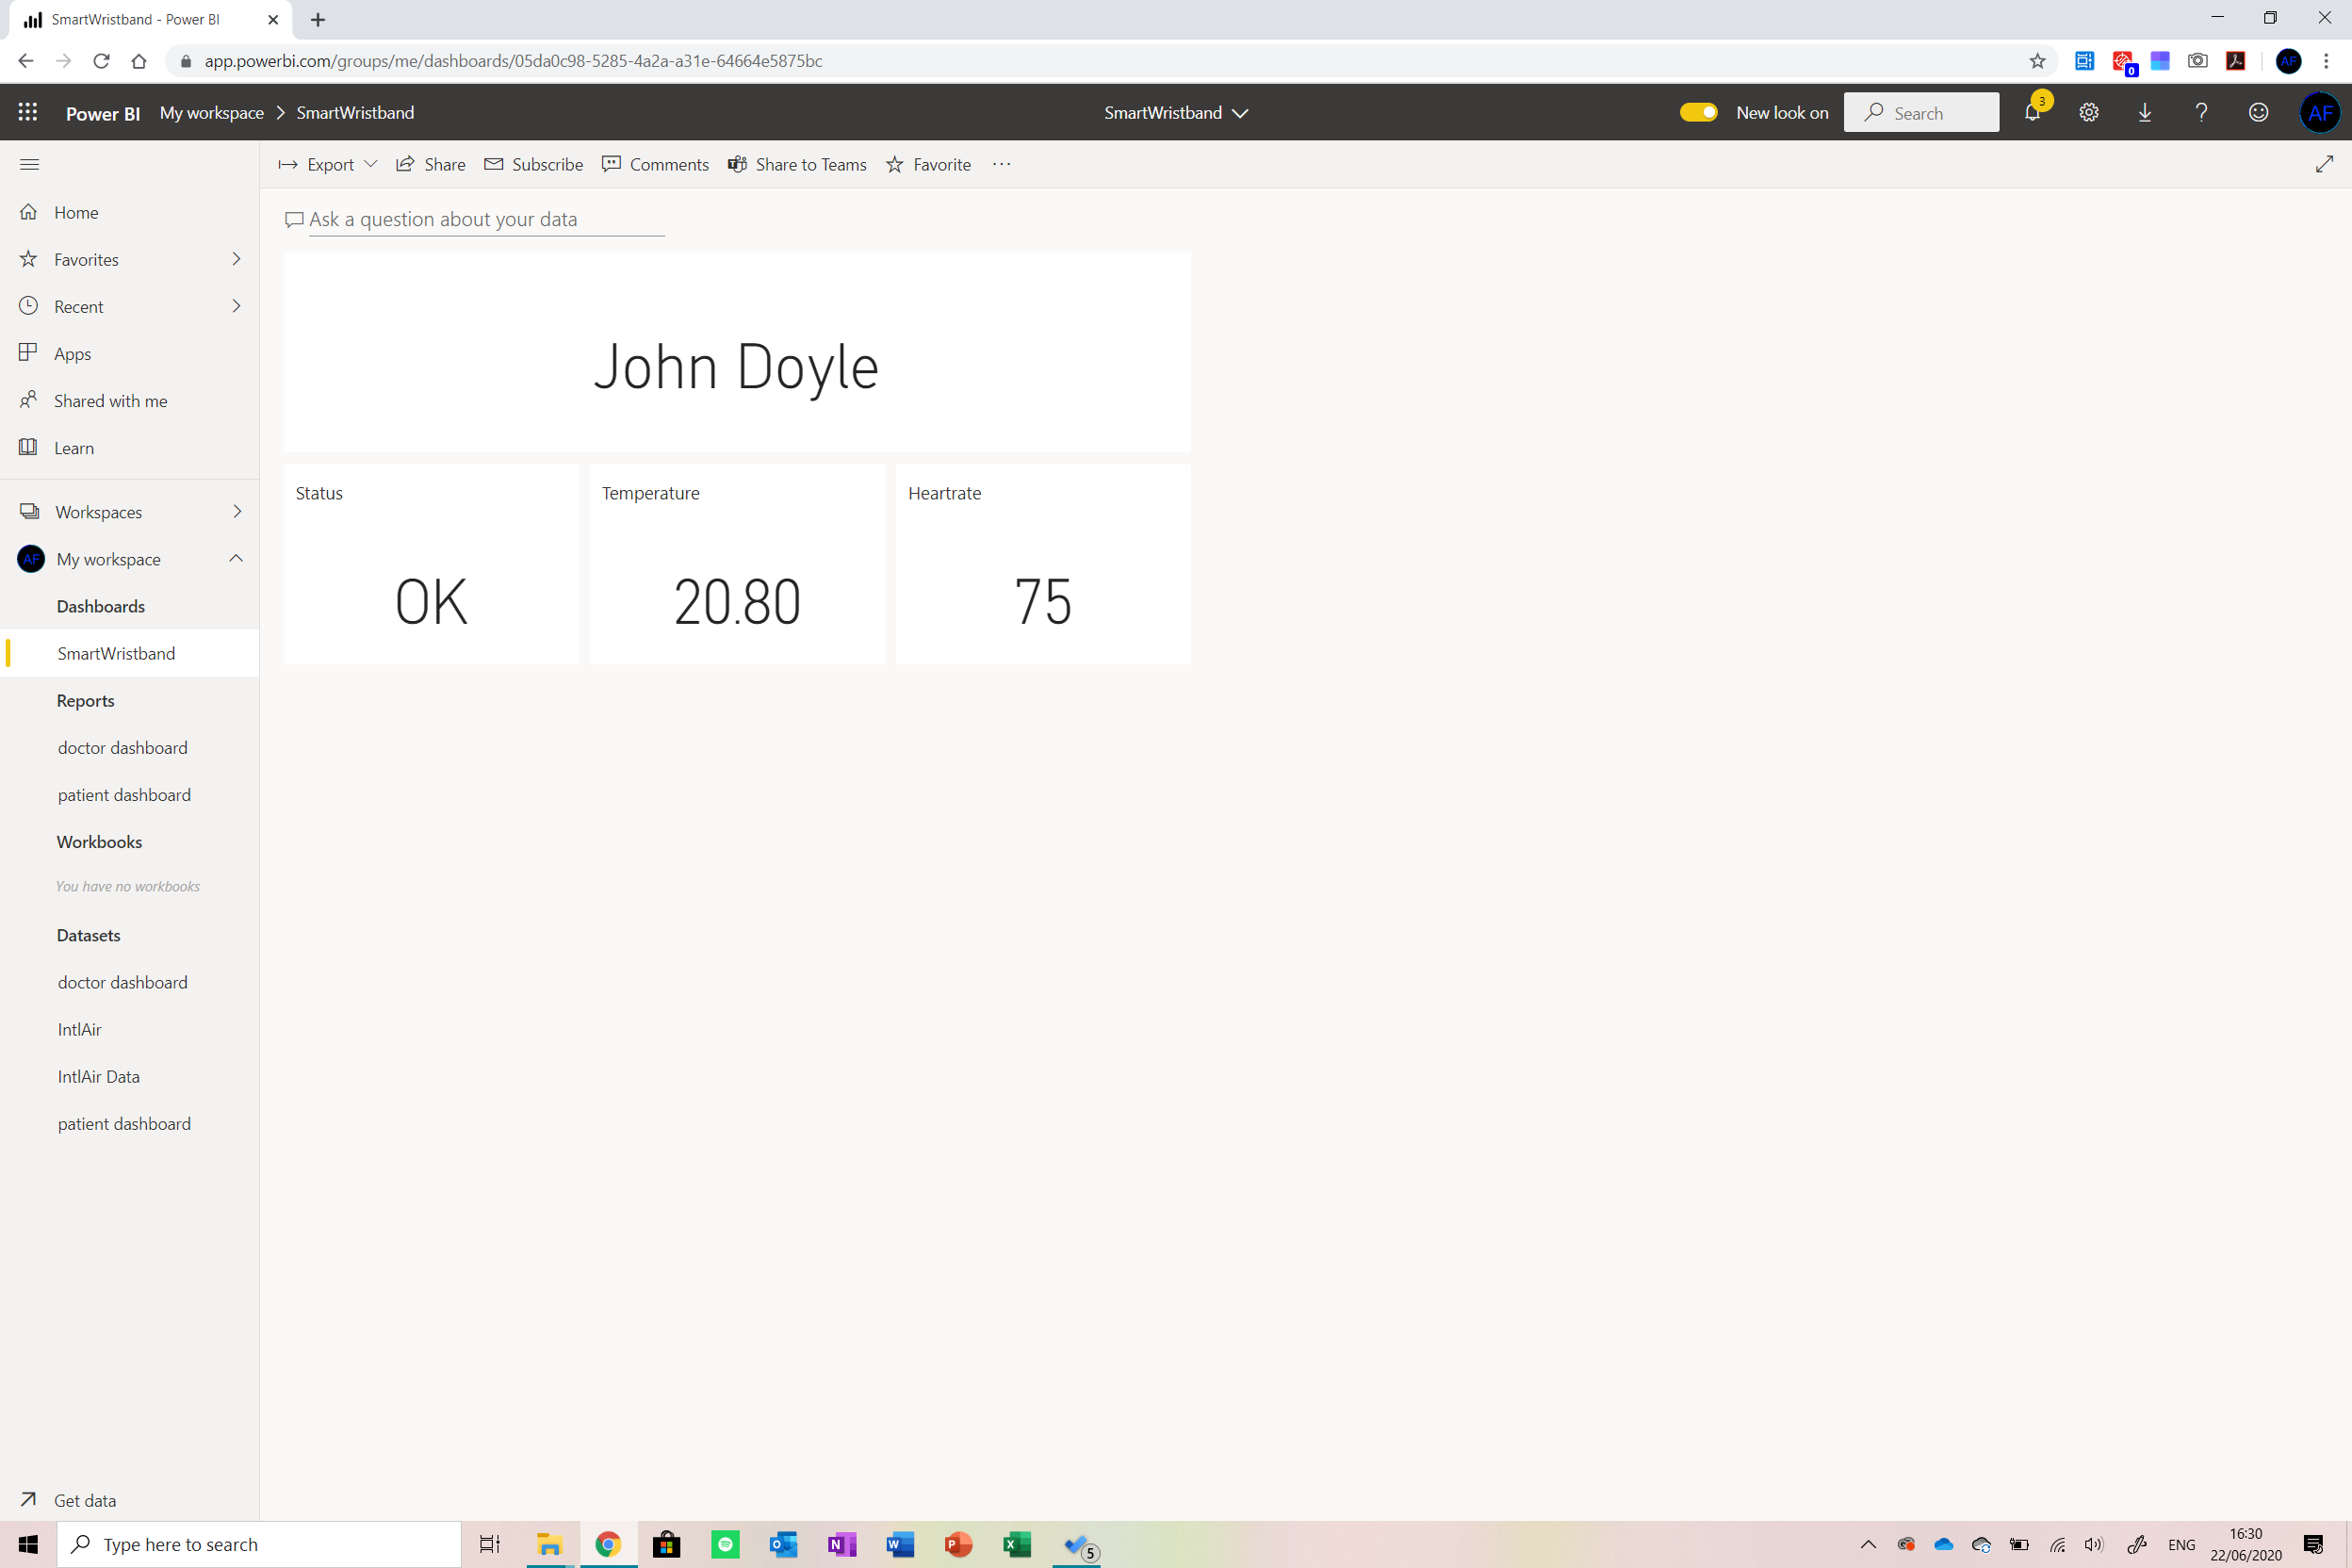
병원은 대시보드에 액세스할 수 있습니다. 모니터링 중인 모든 환자의 건강 상태를 확인할 수 있는 곳 각 환자의 자세한 상태에 대한 특정 보고서와 함께 엿볼 수 있습니다.
기계 학습 알고리즘 또한 환자의 체온과 심박수를 예측하는 애플리케이션에서도 구현됩니다. 가까운 장래에 병원에서 환자를 언제 입원시켜야 하는지 알 수 있도록 합니다.
환자는 모바일 대시보드에도 액세스할 수 있습니다. 손목 밴드를 충전해야 하는 시간과 함께 심박수와 온도를 보여줍니다.
환자가 밤낮으로 착용할 수 있을 만큼 기기가 편안합니다. 눈치채지 못한 채. SmartWristband는 또한 사용자가 기기를 꺼냈는지 확인합니다. , 이 경우 병원에 알립니다.
SmartWristband는 저비용의 확장 가능한 오픈 소스 솔루션입니다. 약한 형태의 바이러스 모니터링으로 자가 격리된 환자를 돌보기 위해 상태의 발전 및 경고 기계 학습 및 사용하기 쉬운 대시보드 경험을 통해 의료진 환자의 주의가 필요한 경우.
프로젝트 요약
이 섹션에서는 애플리케이션의 기능을 살펴보고 애플리케이션이 수행하는 작업에 대한 높은 수준의 이해를 제공합니다.
수집된 데이터
데이터는 5분 간격으로 장치에 의해 수집됩니다. 이것은 가능한 가장 낮은 배터리 소모를 사용하면서 환자의 상태를 비교적 실시간으로 보기 위해 수행됩니다. 기기는 두 가지 유형의 데이터를 수집합니다. 즉, 중요 데이터와 위치입니다.
중요한 데이터는 심박수와 체온을 나타냅니다. 위치 데이터가 환자의 지리적 위치를 참조하는 동안 . 기기가 이 데이터를 로컬로 처리하지 않습니다. 처리가 수행되는 Azure에 전달하기만 하면 됩니다.
이 데이터가 수집되는 이유는 무엇입니까?
온도 및 심박수 데이터는 추세를 분석하여 환자의 현재 상태가 퇴화하고 있는지 여부를 나타낼 수 있습니다. 연구에 따르면 불규칙한 심박수와 높은 온도는 바이러스가 존재한다는 신호입니다. 이러한 활력 징후가 시간이 지남에 따라 퇴화되면(즉, 온도가 점진적으로 상승) 이는 환자의 상태가 악화될 수 있다는 신호입니다. 환자는 나중에 이를 깨닫지 못할 수 있지만 장치는 이러한 징후가 나타날 때 이를 감지합니다.
지리적 위치 데이터도 기기에서 수집되며, 이는 환자가 집에 머물고 있는지 확인하기 위해 수행됩니다. 자가격리 중이며 격리수칙을 준수하고 있습니다. Azure는 사용자가 집에 있는지 확인하고 이를 의사 대시보드에 보고합니다.
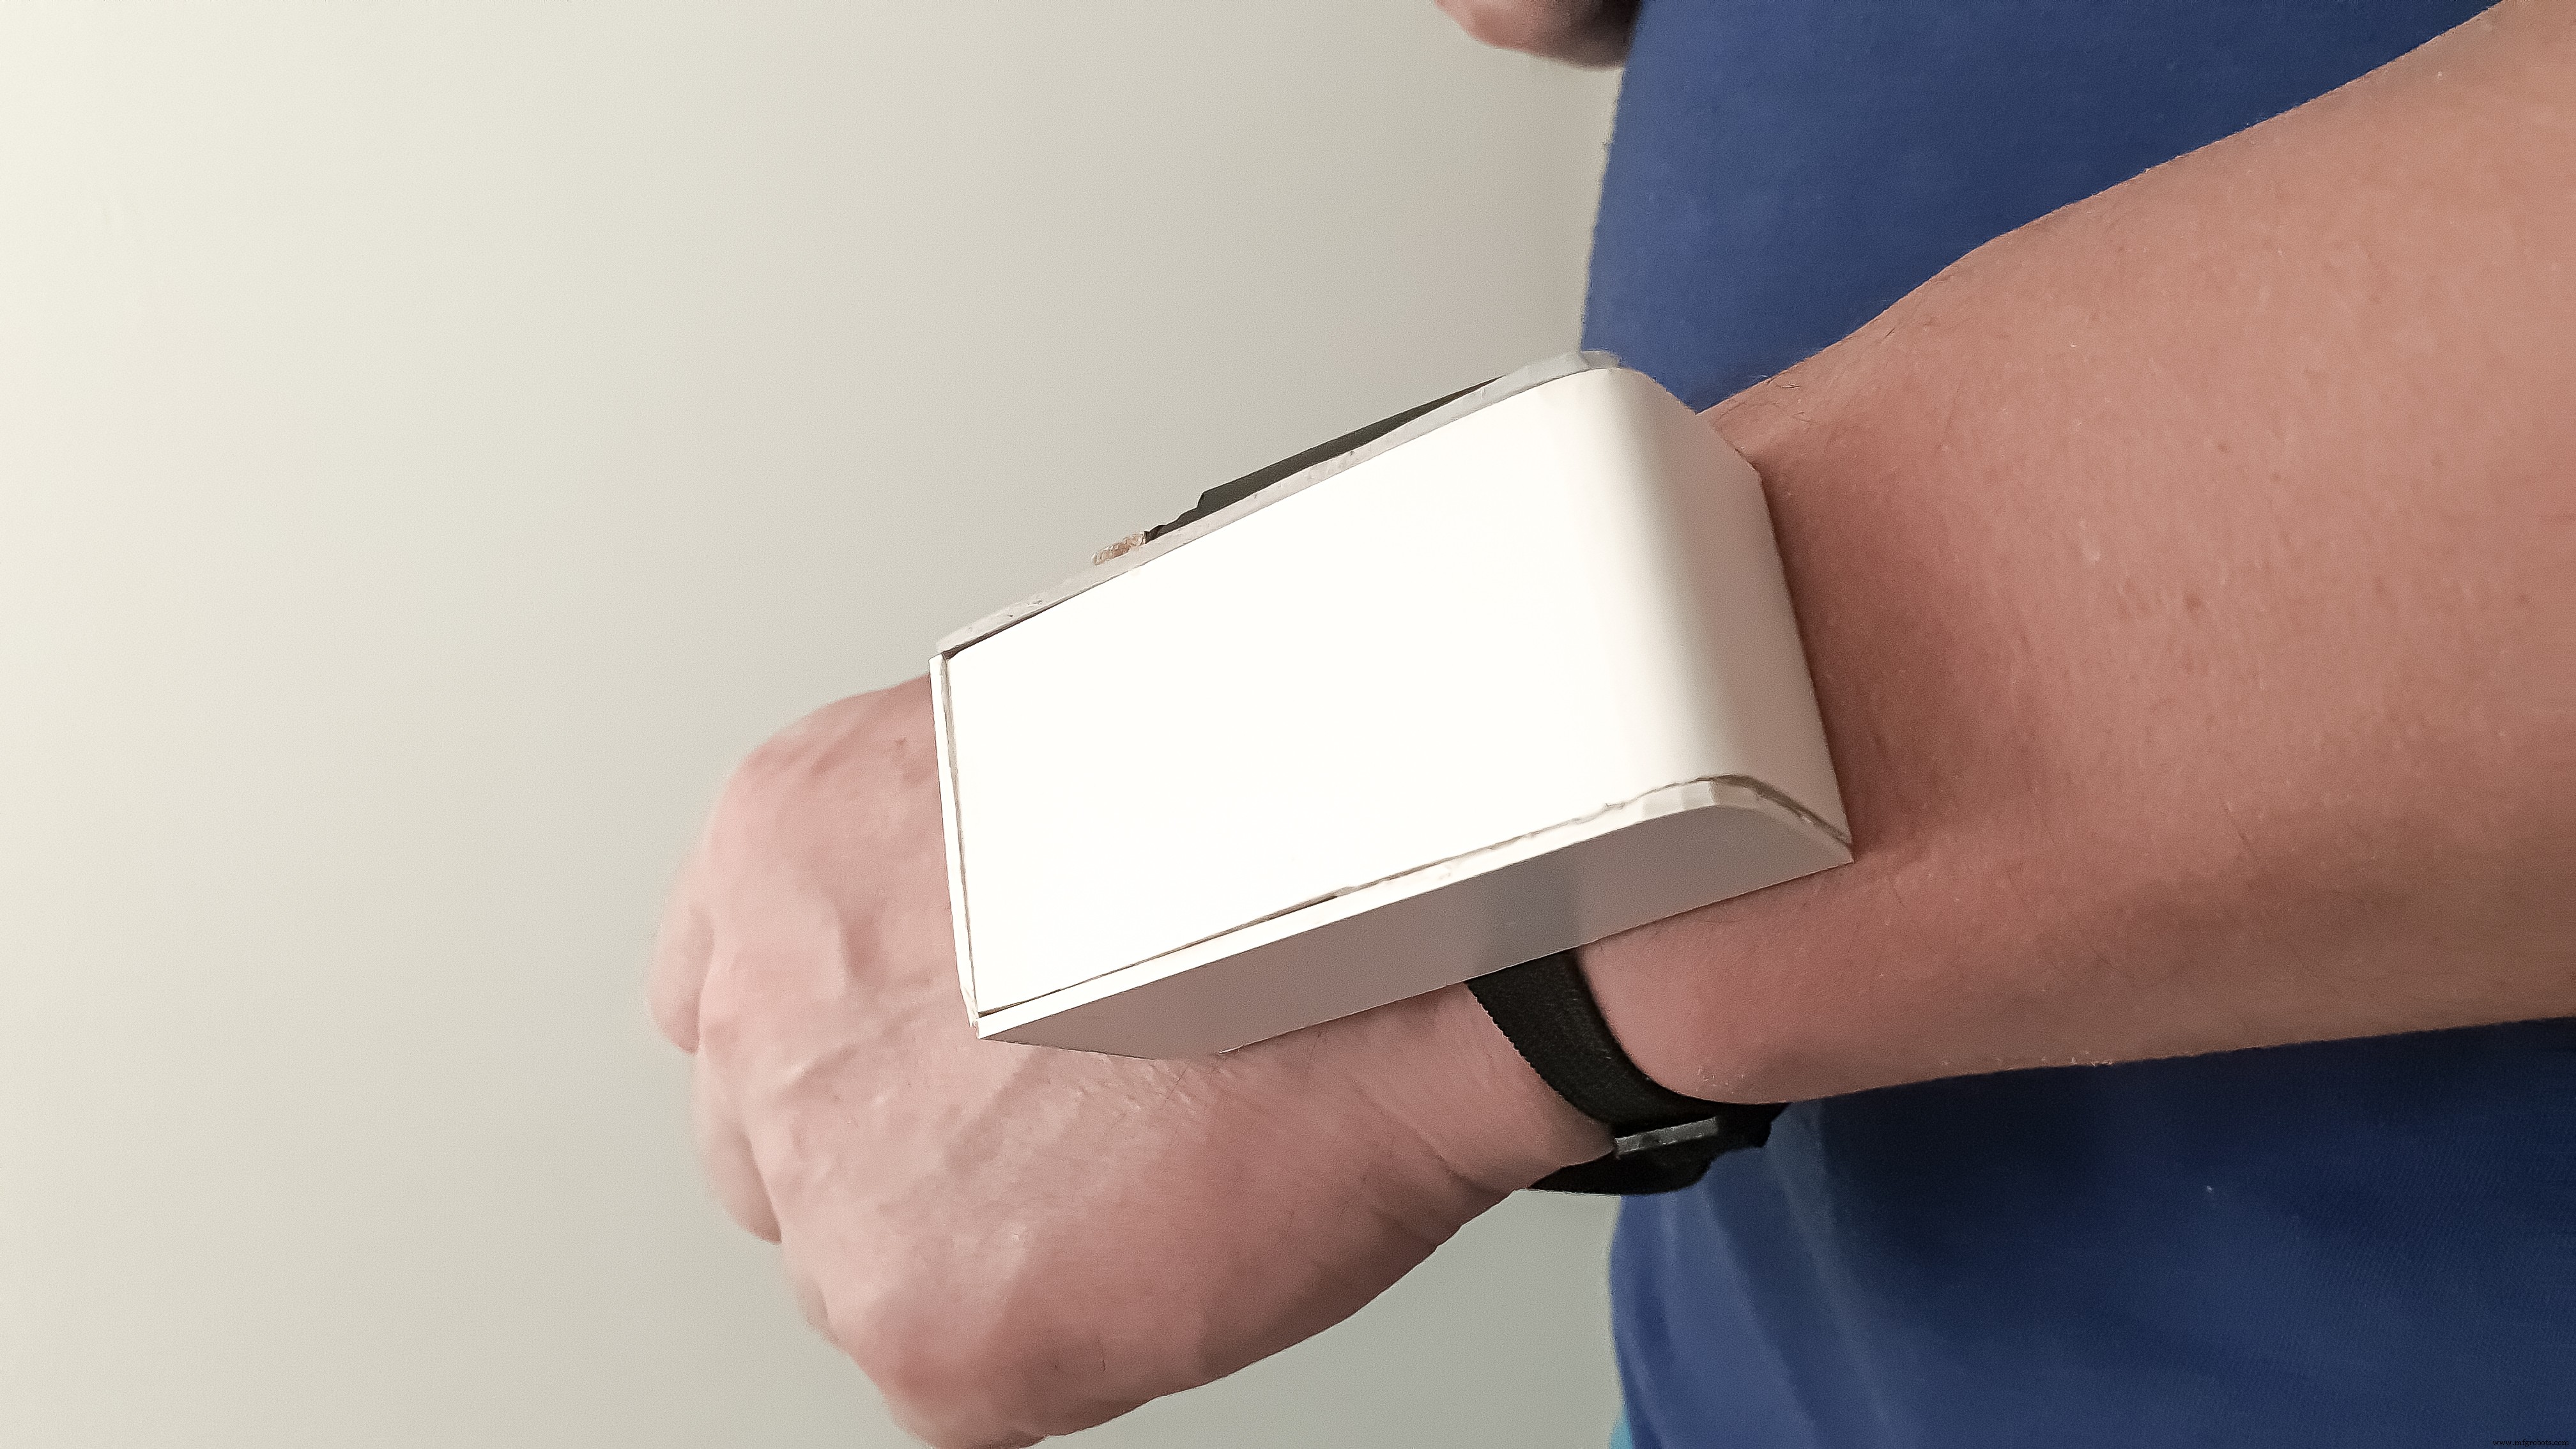
기기 살펴보기
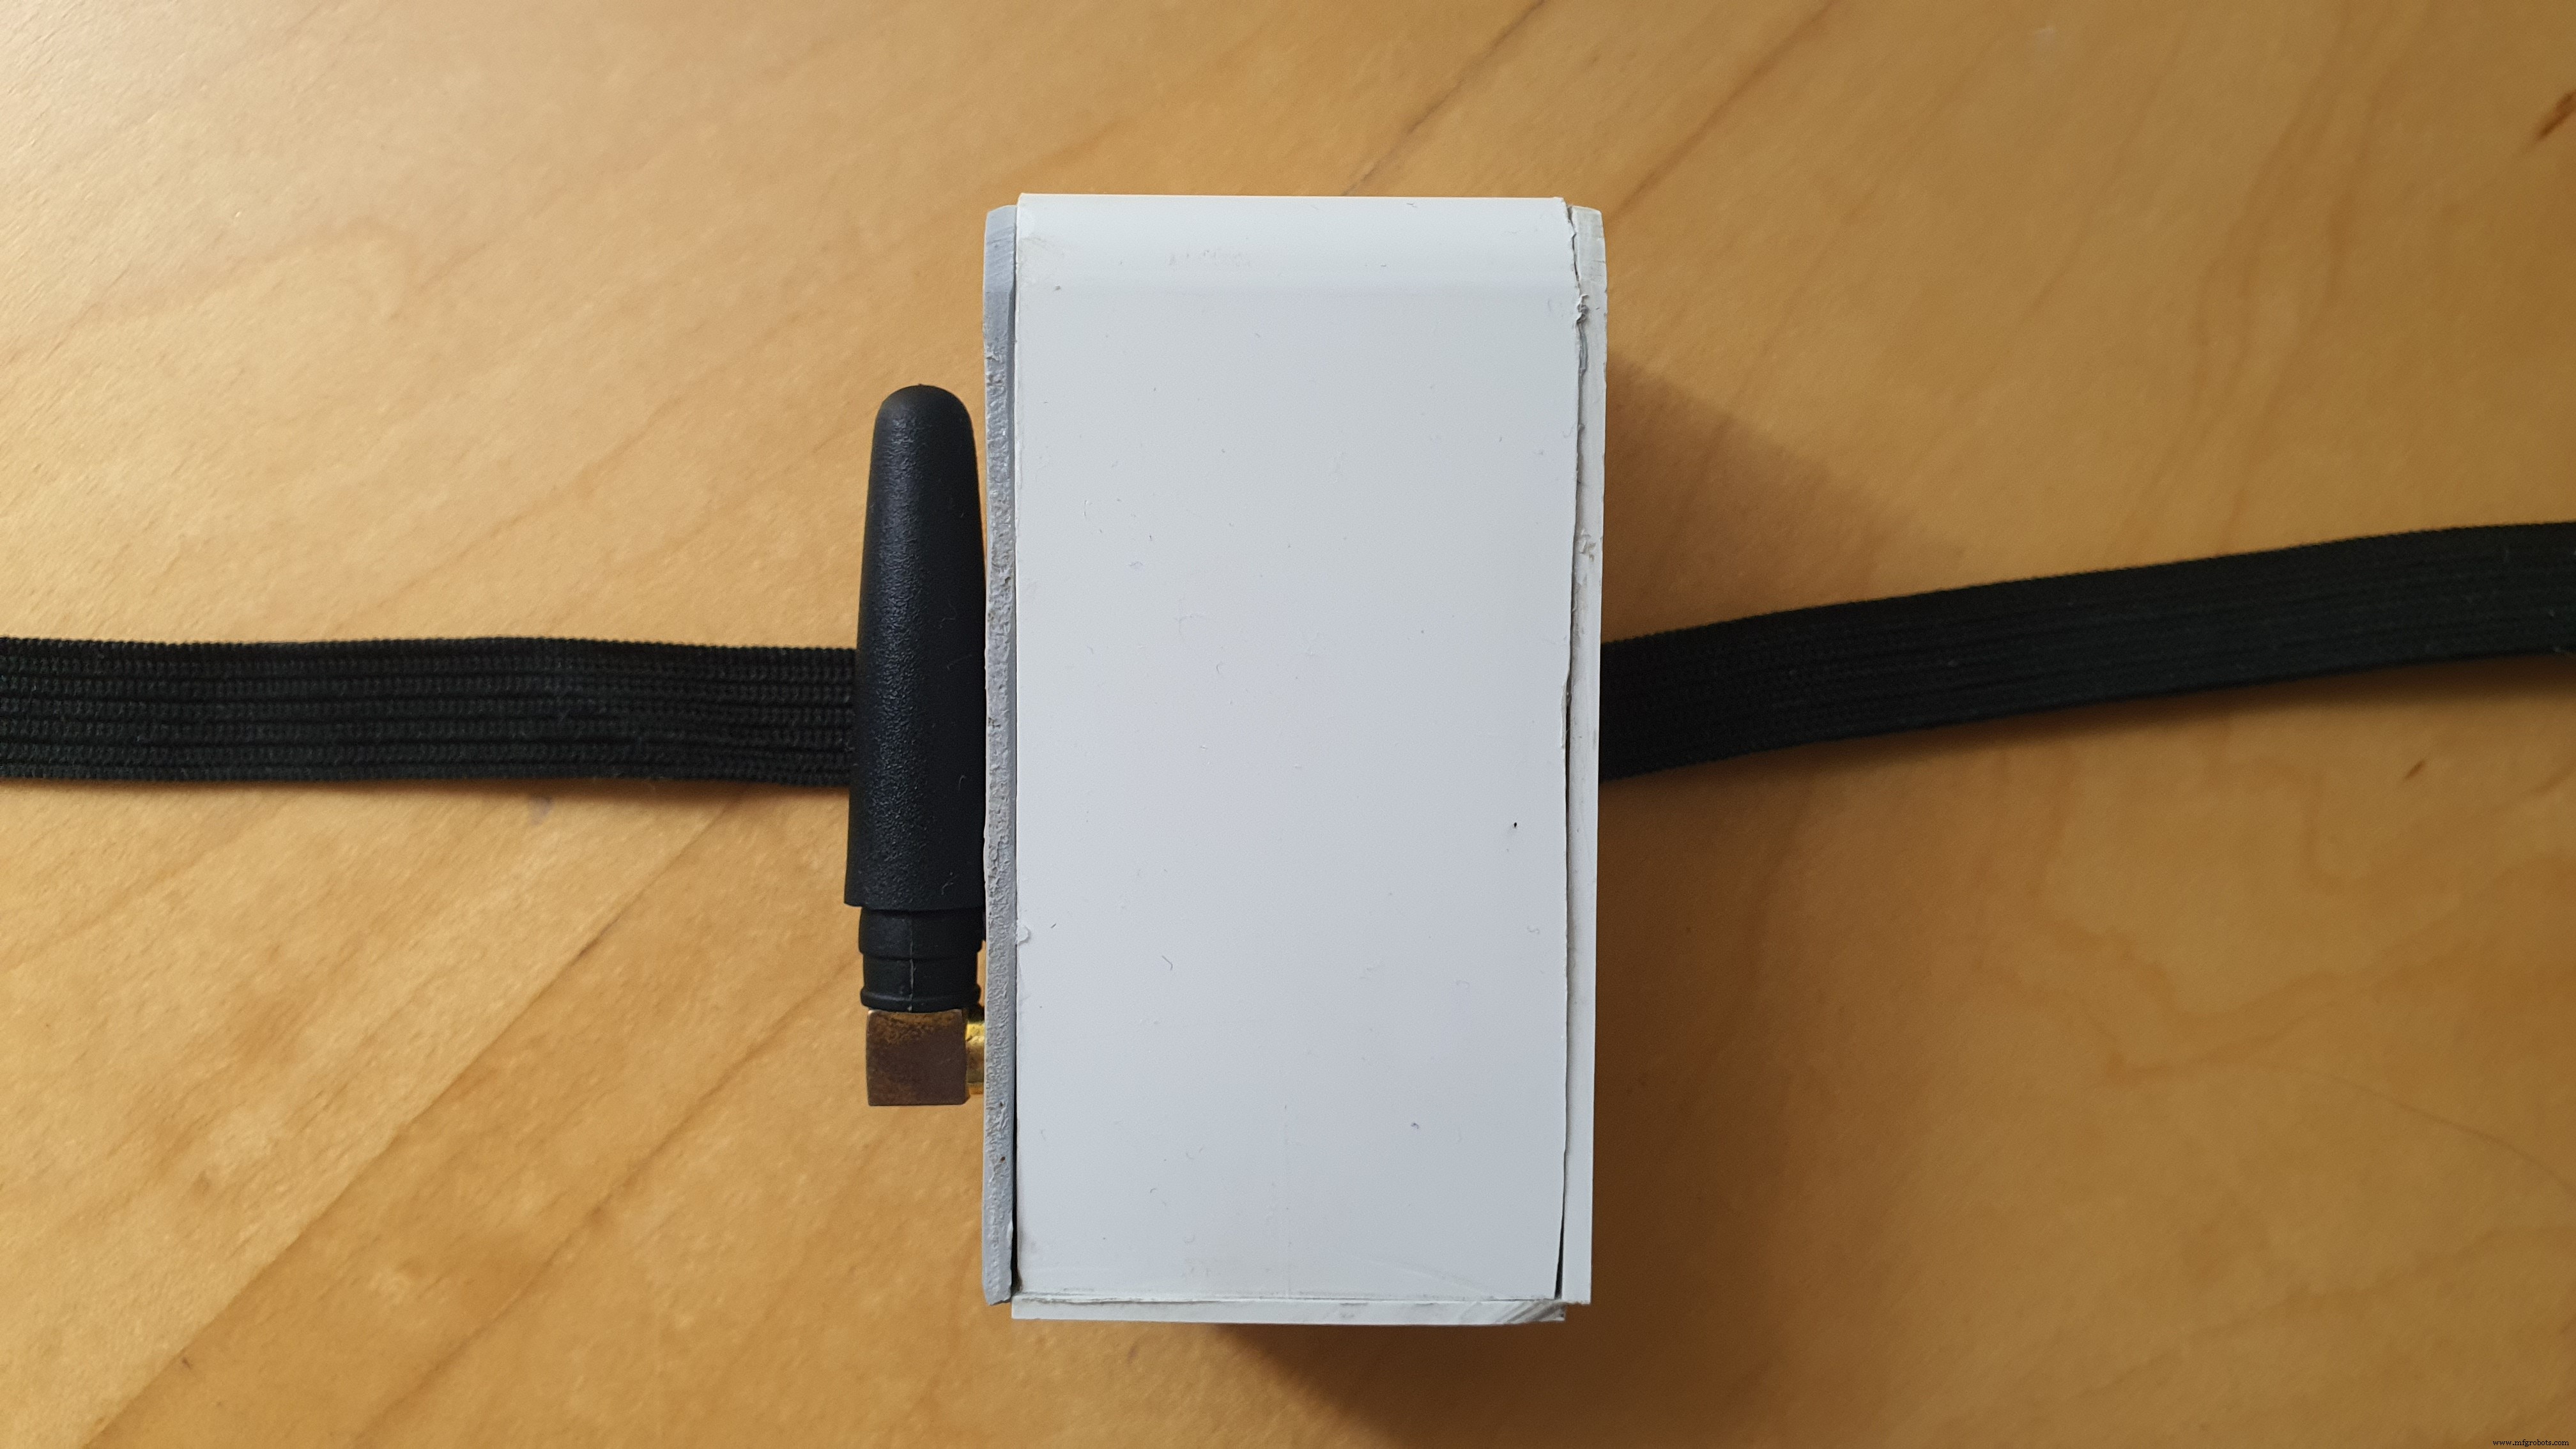
편안함을 염두에 두고 프로토타입을 만들었습니다. 장치는 환자의 왼쪽 또는 오른쪽 손목에 쉽게 놓을 수 있습니다. 심박수 센서와 IR 온도 센서가 기기 바닥에 튀어나와 있어 환자의 피부에 닿는다.
이러한 센서는 불편함 없이 정확한 측정을 제공합니다. 온도 정밀도를 높이려면 패드의 팔 아래와 같은 위치에 센서를 배치해야 합니다.
장치는 심박수 센서에서 출력된 원시 데이터를 사용하여 환자가 장치를 착용하고 있는지 확인합니다. 센서는 피부에 접촉할 때 매우 구체적인 데이터 패턴을 출력하므로 이 패턴이 없으면 장치를 착용하지 않았음을 나타냅니다.
배터리 수명
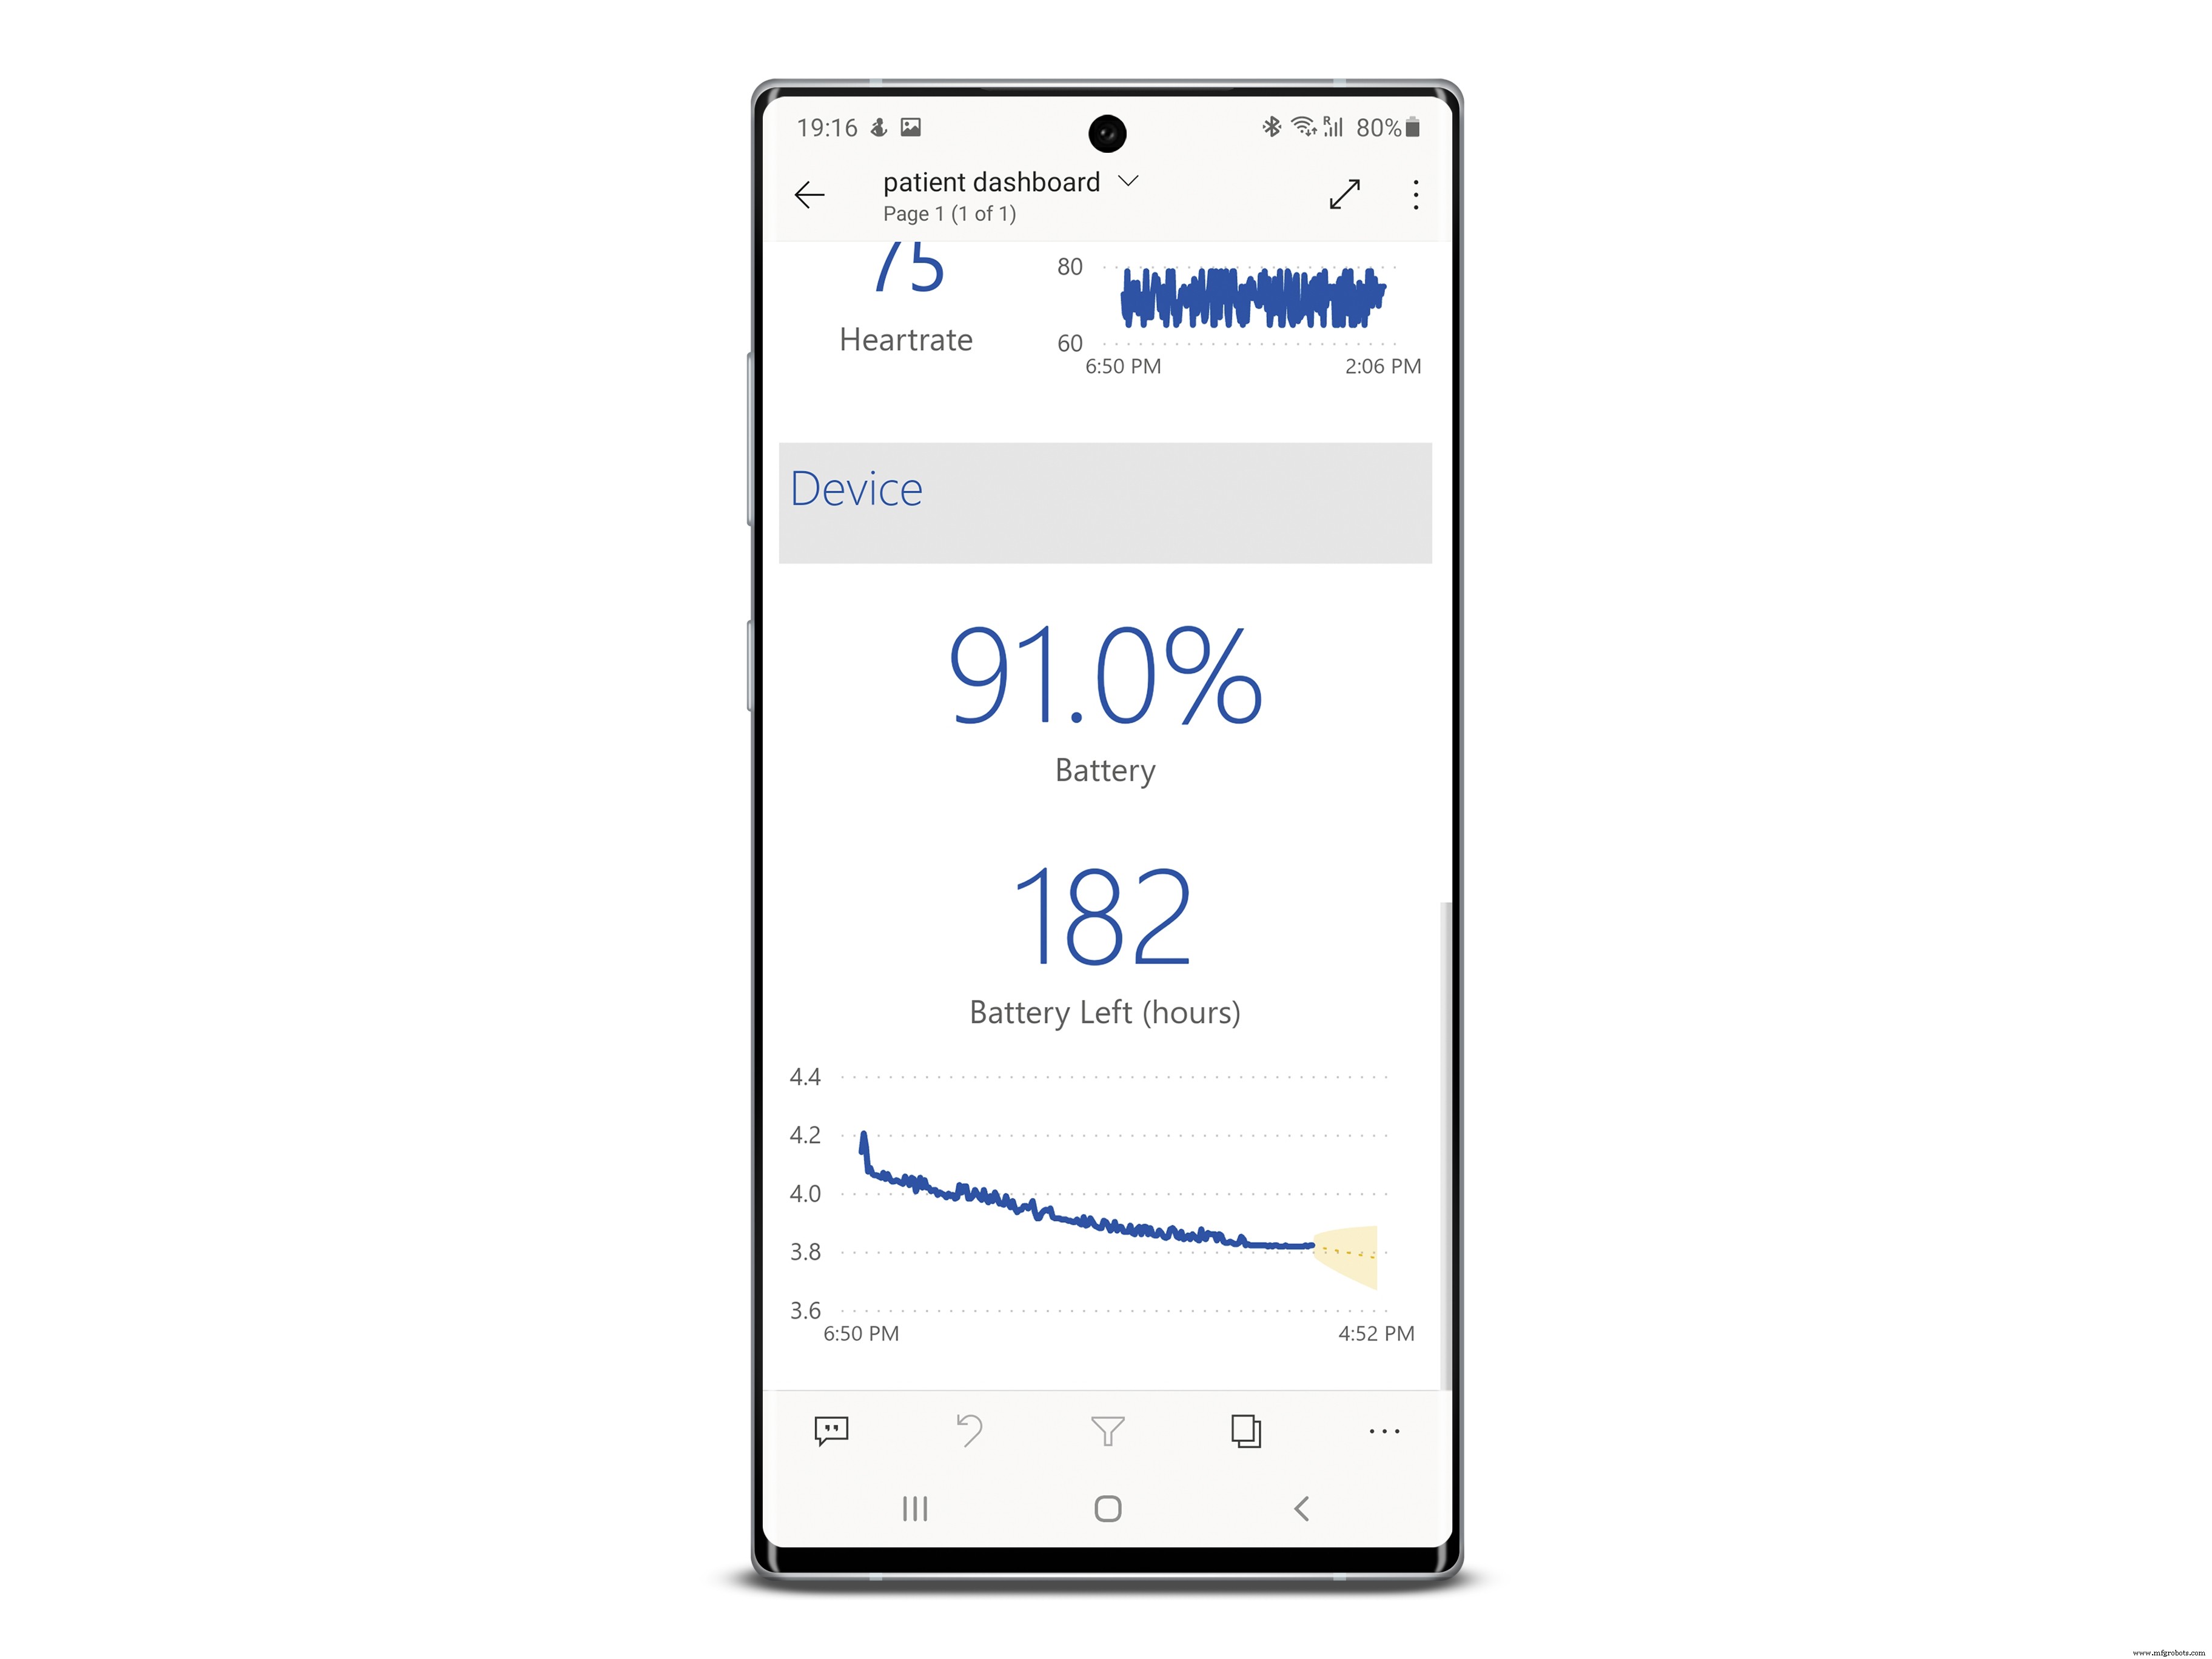
장치의 배터리 수명을 정확하게 측정하기 위해 엄격한 테스트가 수행되었습니다. 이 장치의 총 배터리 수명은 한 번 충전으로 8일입니다. 즉, 2주 동안 환자를 조사해야 하는 경우 배터리를 한 번 충전해야 합니다. 기기를 착용한 상태에서 배터리를 충전할 수 있습니다.
또는 데이터를 10분 간격으로 수집할 수 있습니다. , 본질적으로 기기의 배터리 수명을 두 배로 늘리는 읽기 사이에 잠자기 때문에 배터리가 거의 소모되지 않습니다. 남은 배터리 수명과 남은 배터리 수명 시간이 환자 및 의사 대시보드에 표시됩니다.
개발 비용
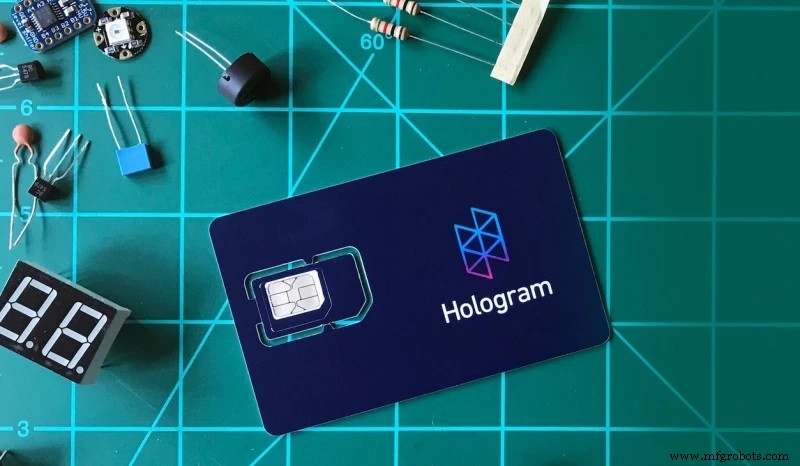
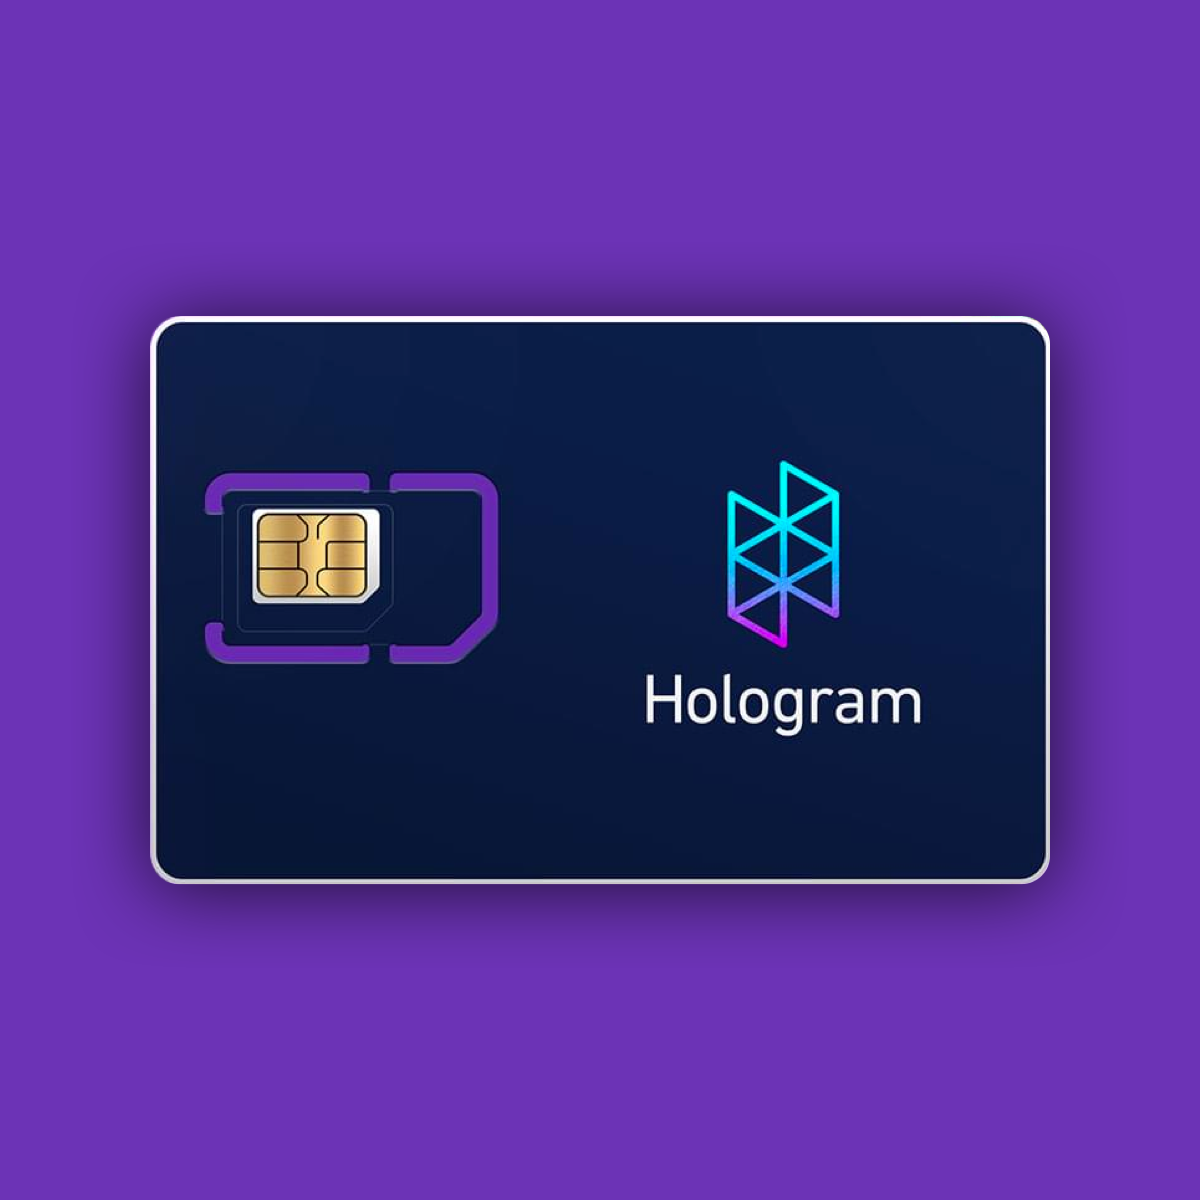
프로젝트의 경우 개발 비용은 일회성 비용과 반복 비용으로 구성됩니다. 하나의 장치에 대한 개발 비용은 인클로저를 포함하여 70유로입니다. 반복 비용은 백엔드에서 발생합니다. 장치당 2주 동안 데이터를 보내는 데 €5의 비용이 드는 서비스 공급자로 홀로그램을 사용하고 있습니다. 데이터 스트리밍 및 데이터베이스를 포함한 백엔드 비용은 2주 동안 €30입니다.
100개의 기기에 대한 총 비용은 약 €7,035입니다. 이러한 기기는 재사용할 수 있습니다.
백엔드 비용은 확장 가능하며 배포된 장치 수에 관계없이 동일합니다. 부품을 대량으로 구매하고 맞춤형 회로를 사용하면 비용을 크게 줄일 수 있습니다.
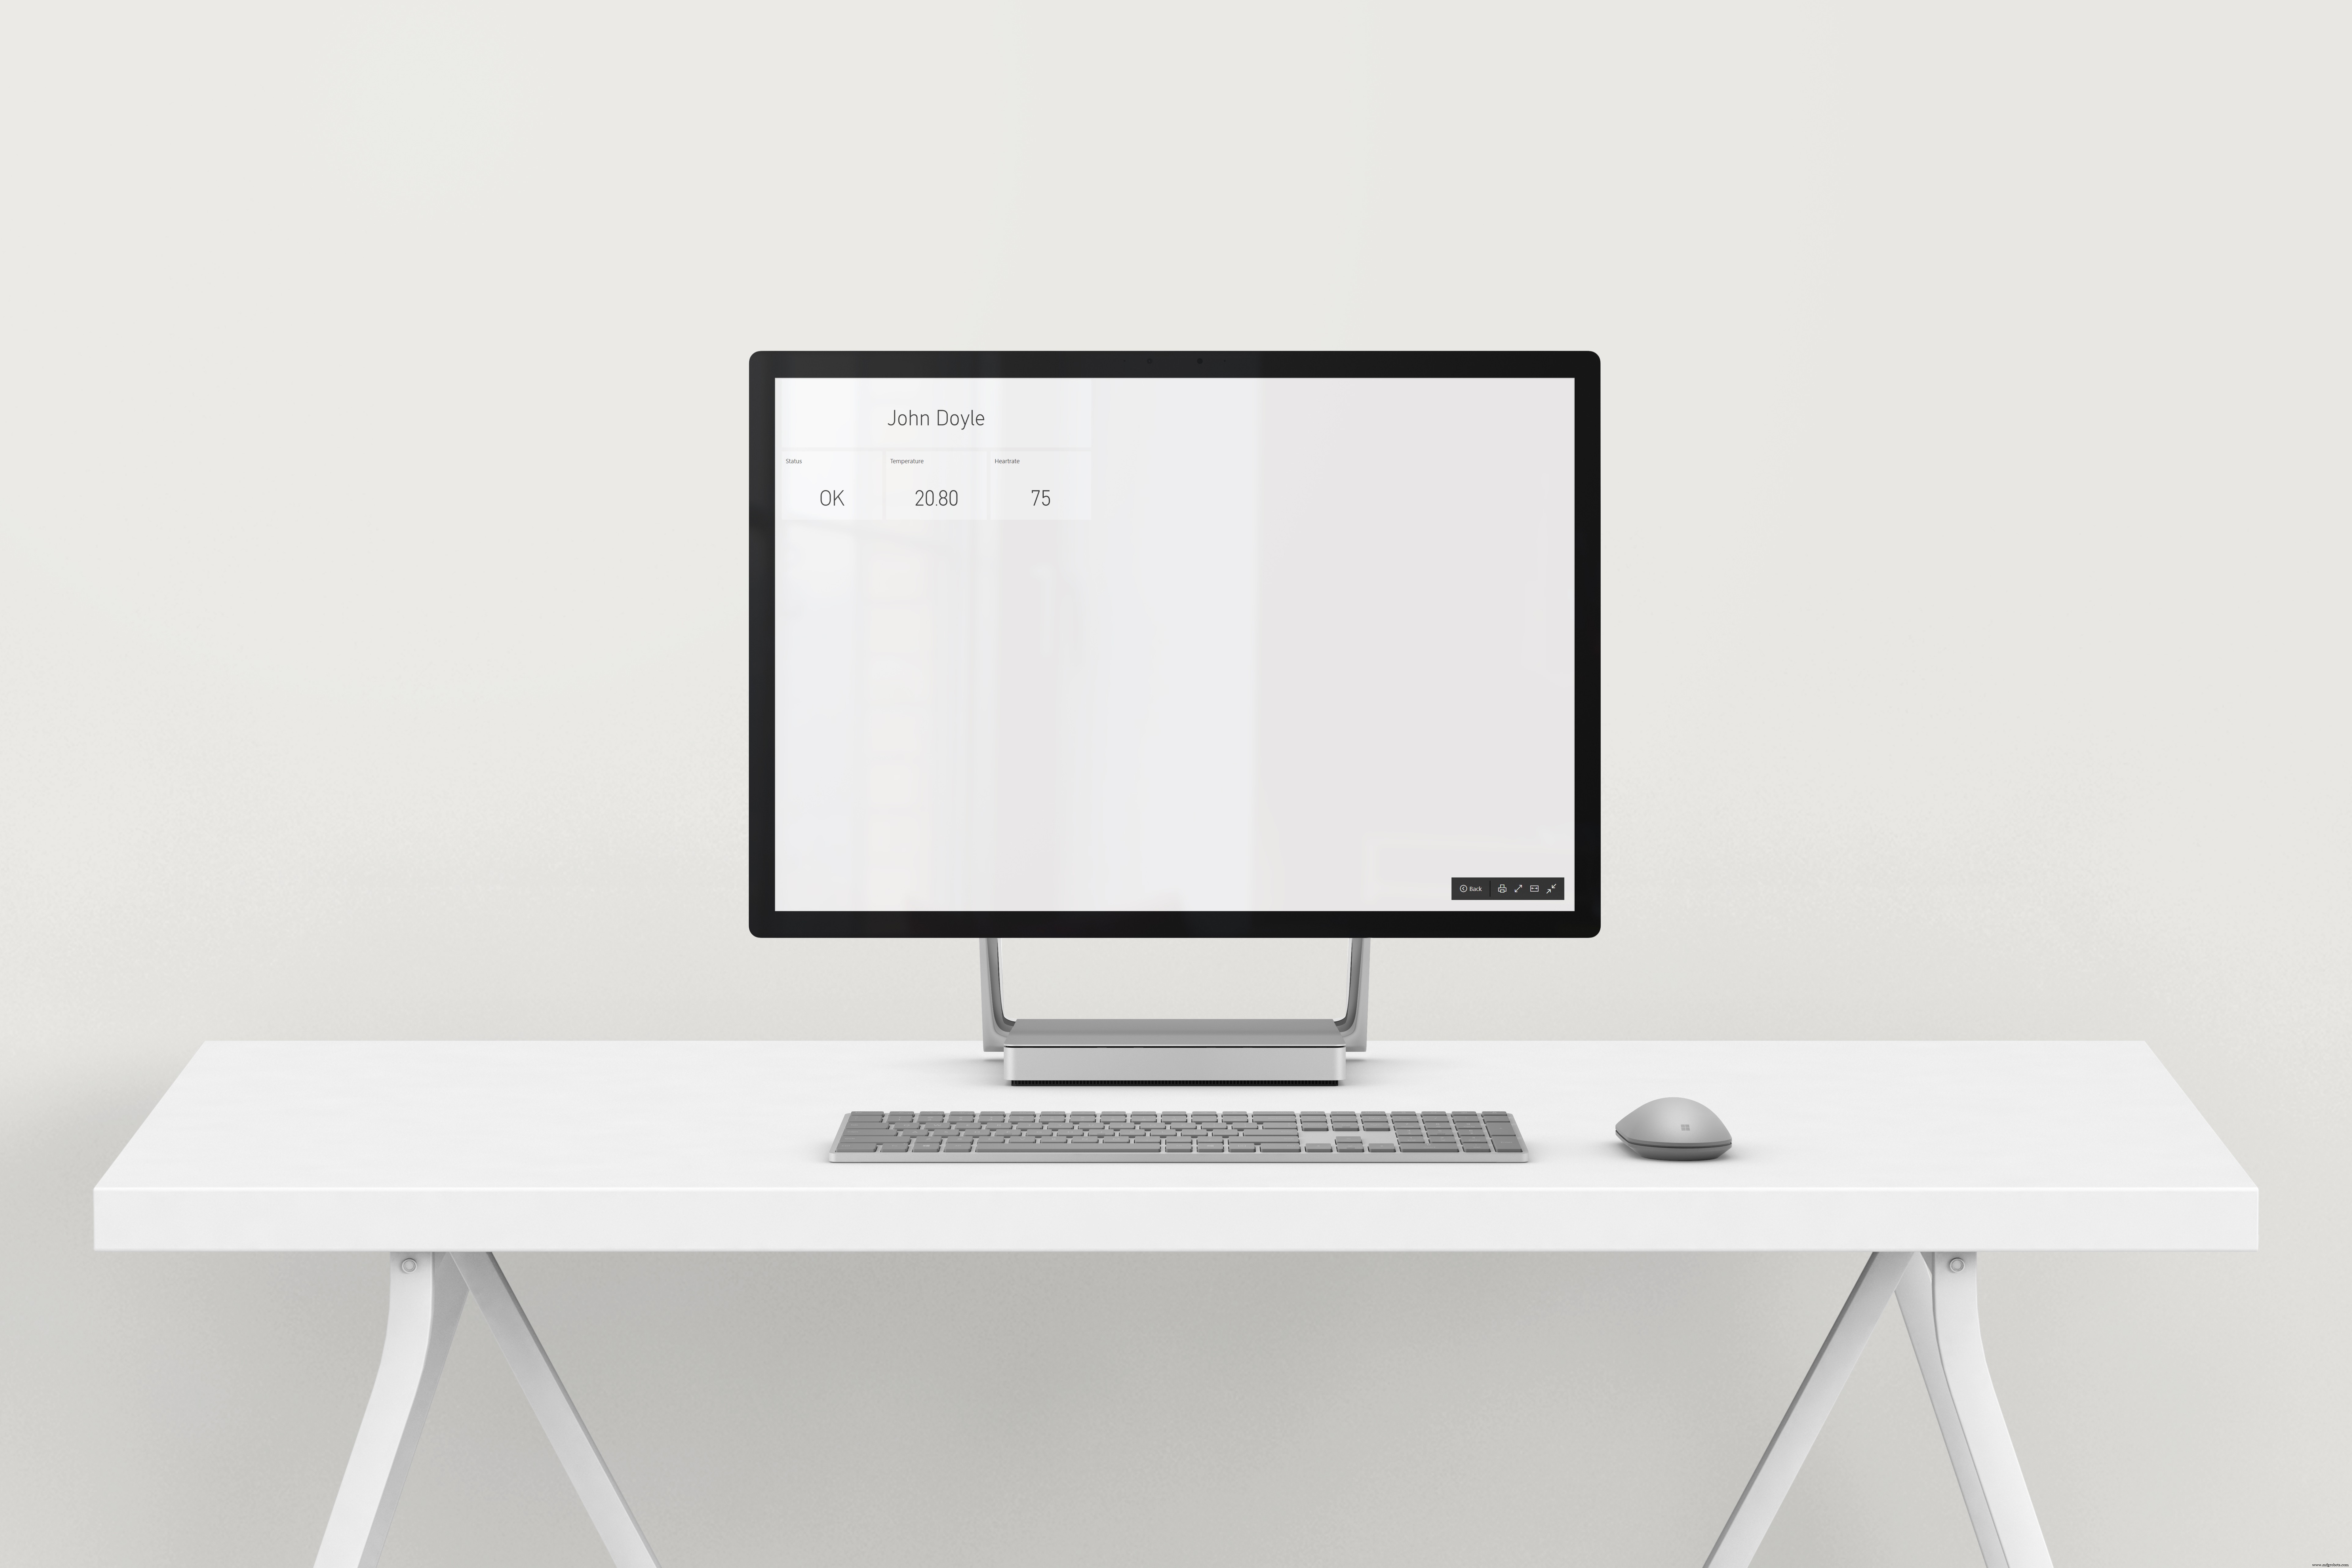
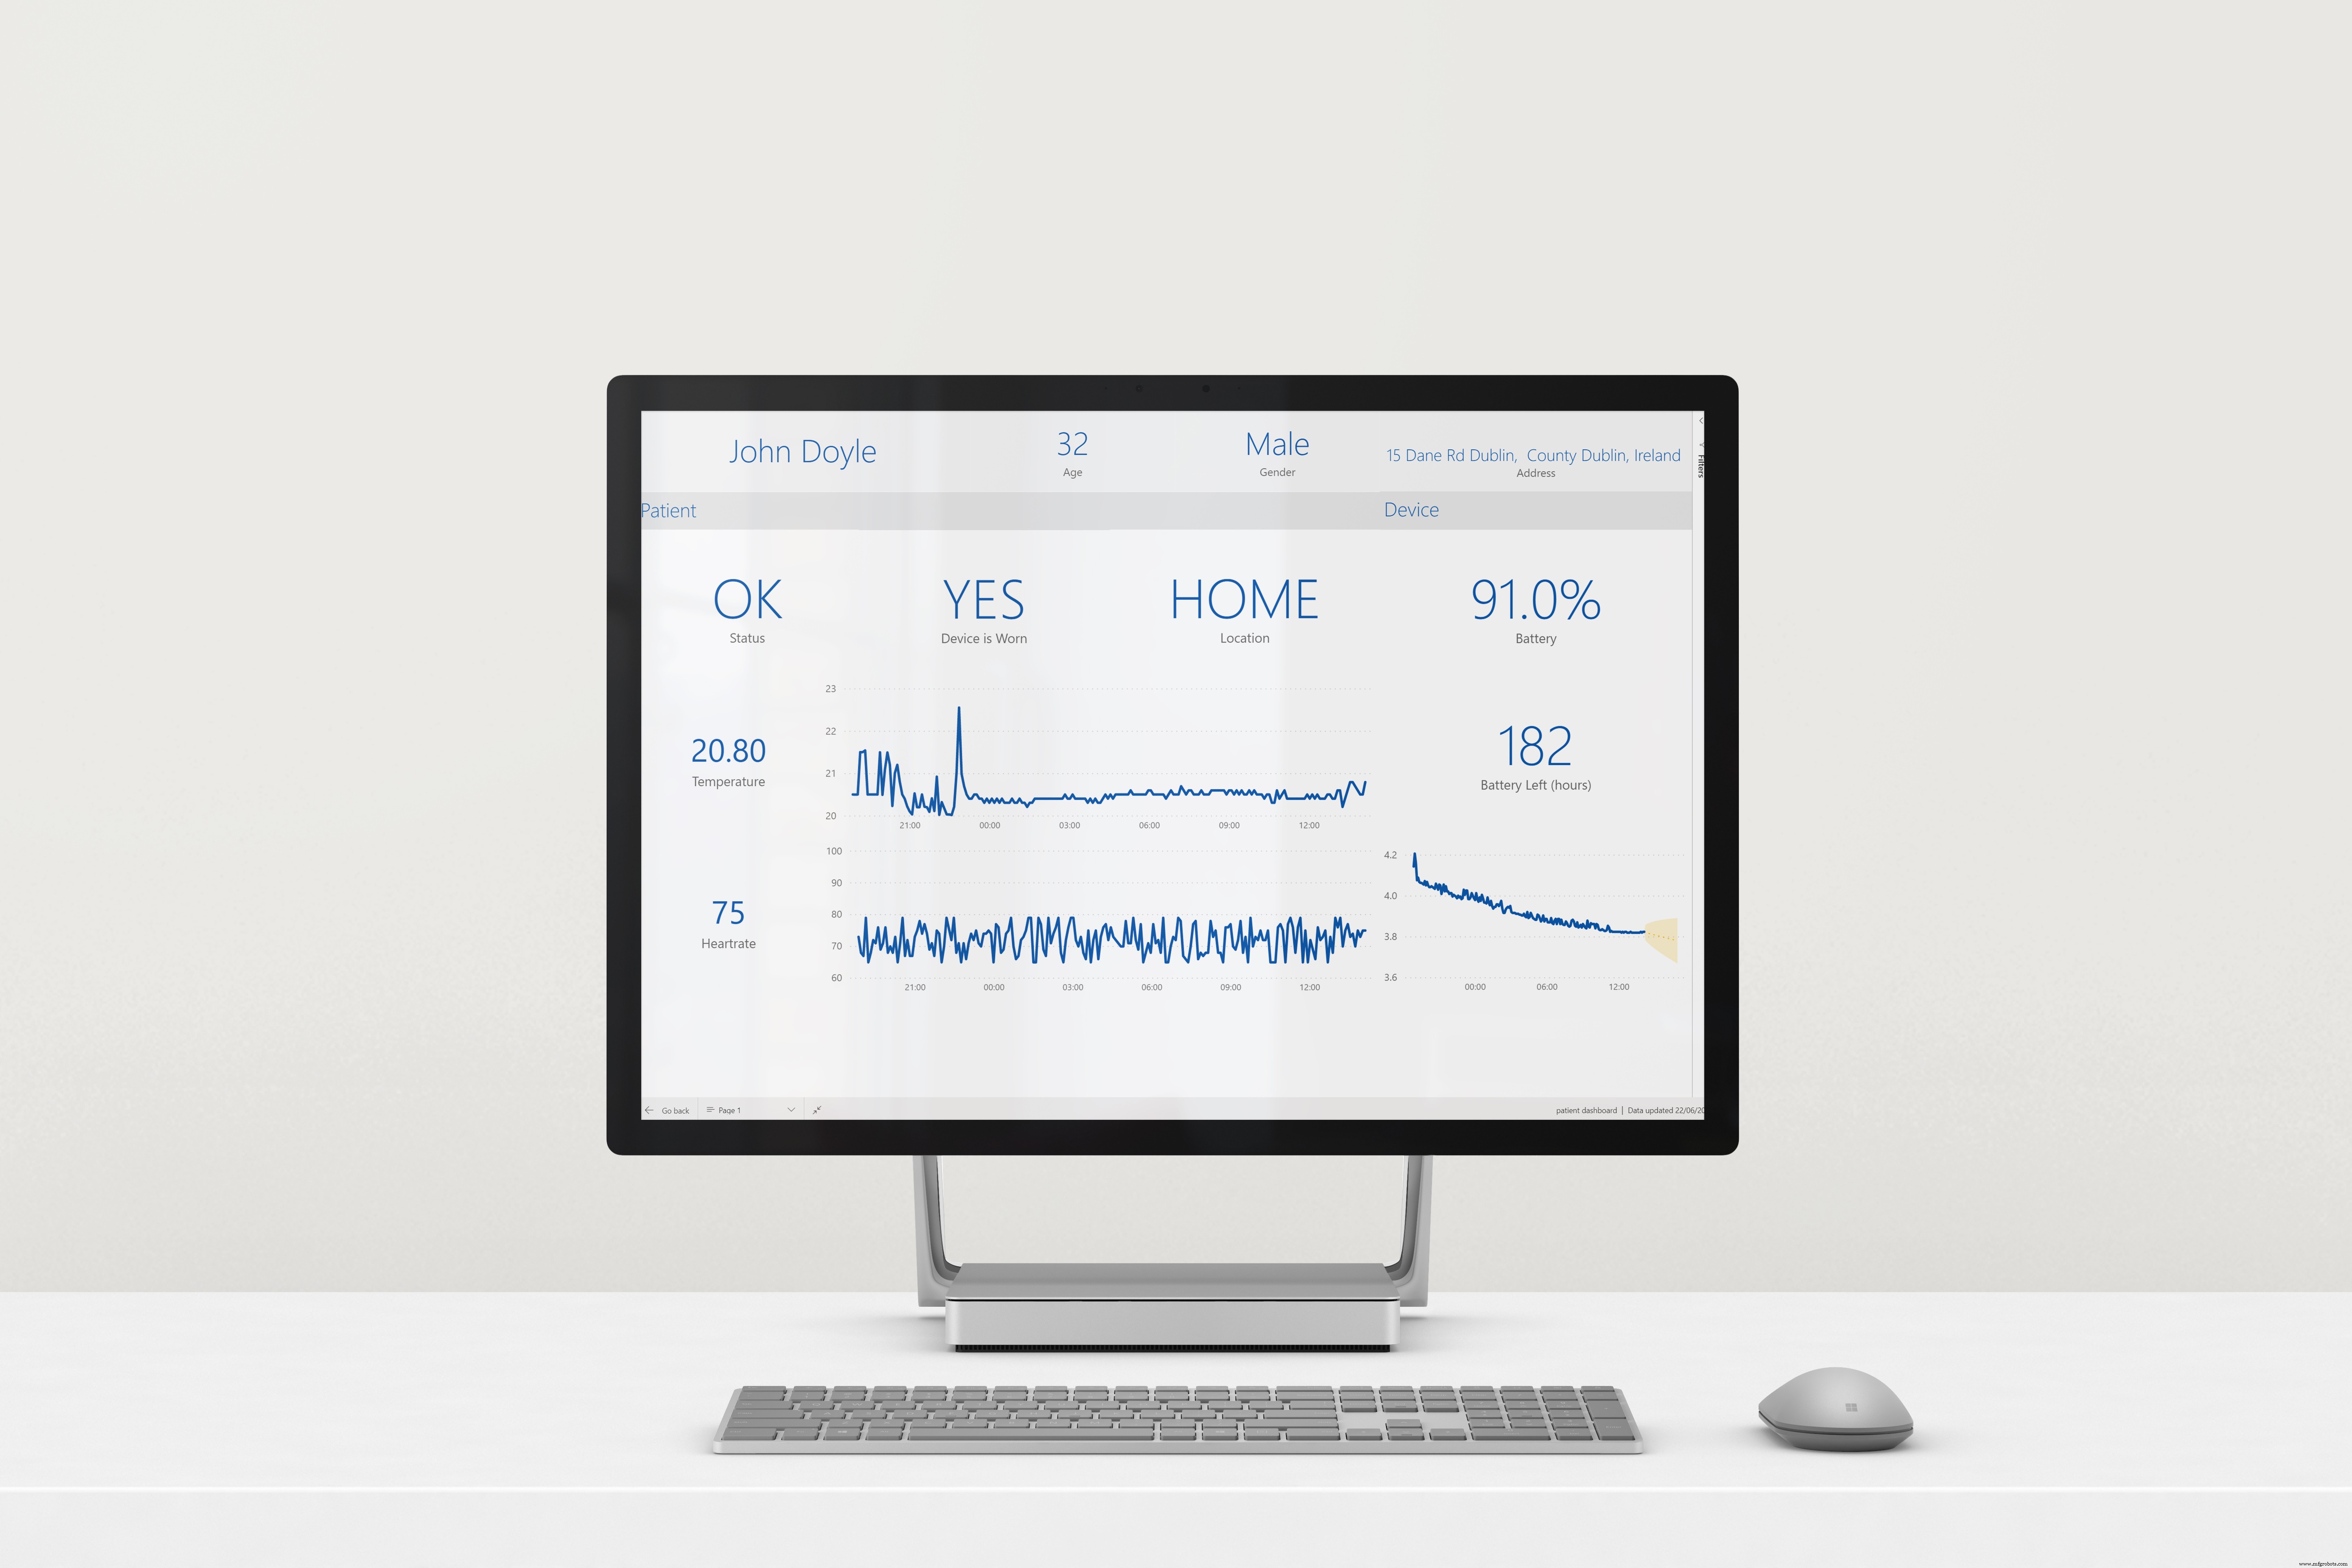
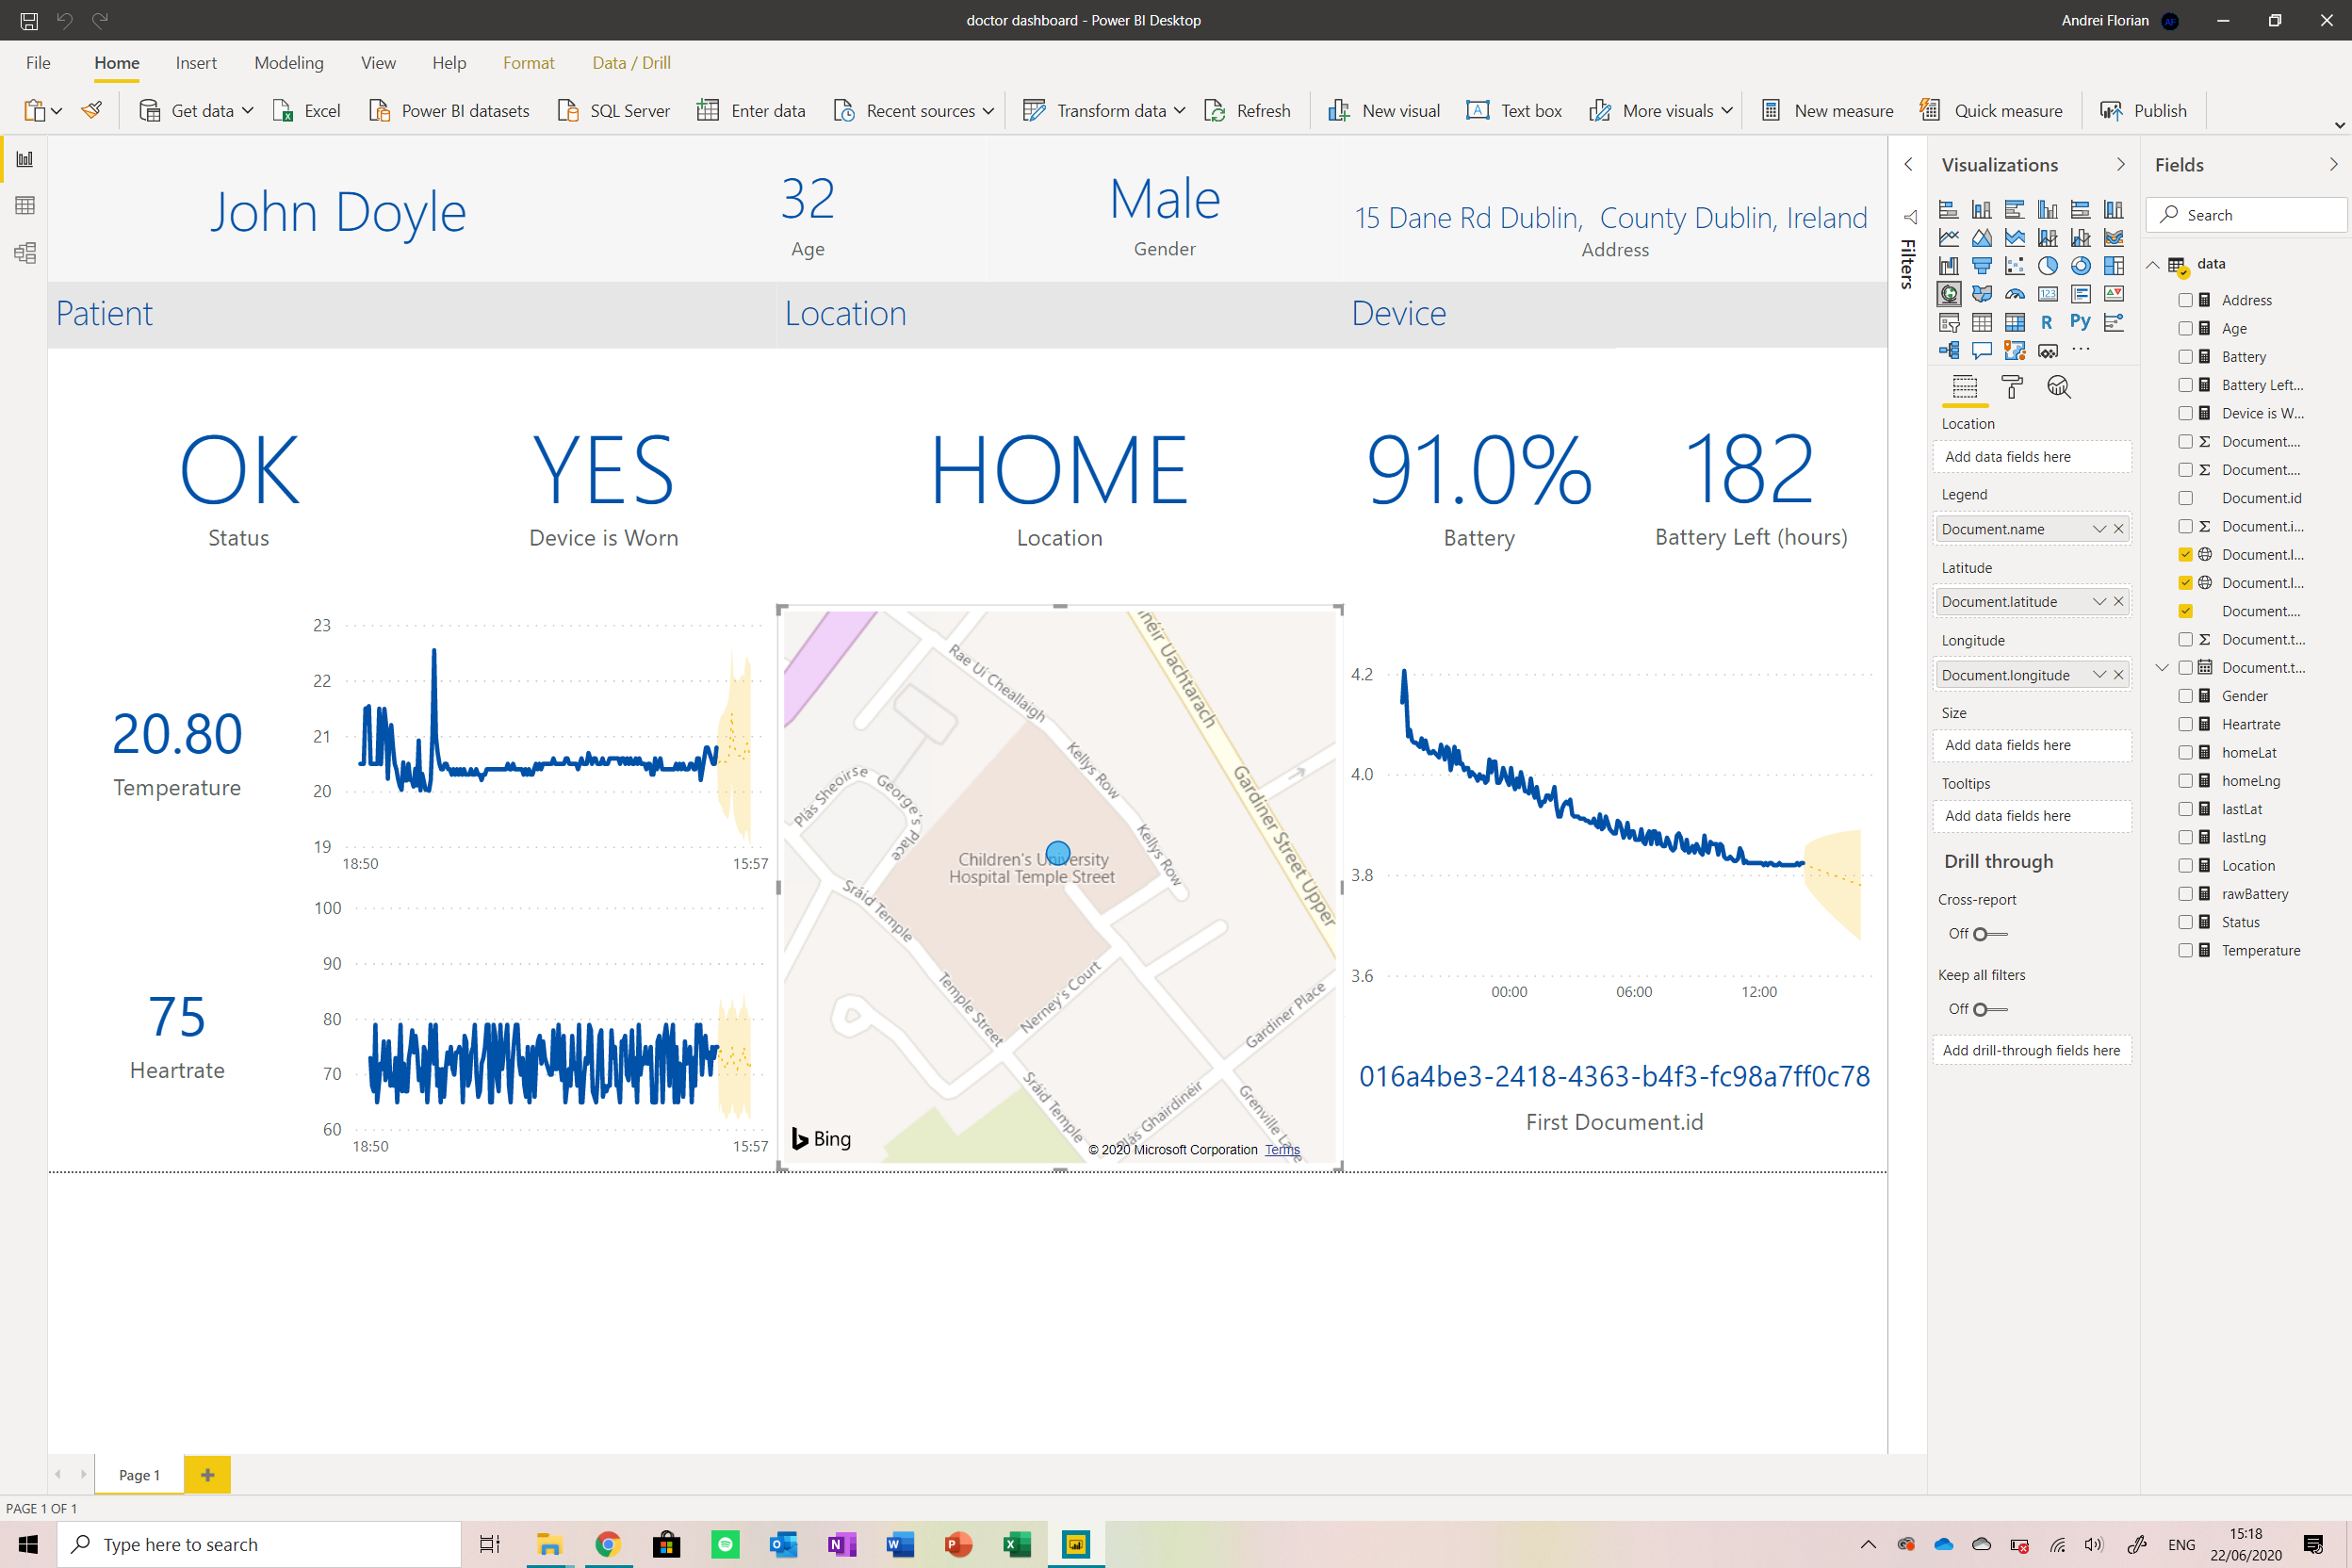
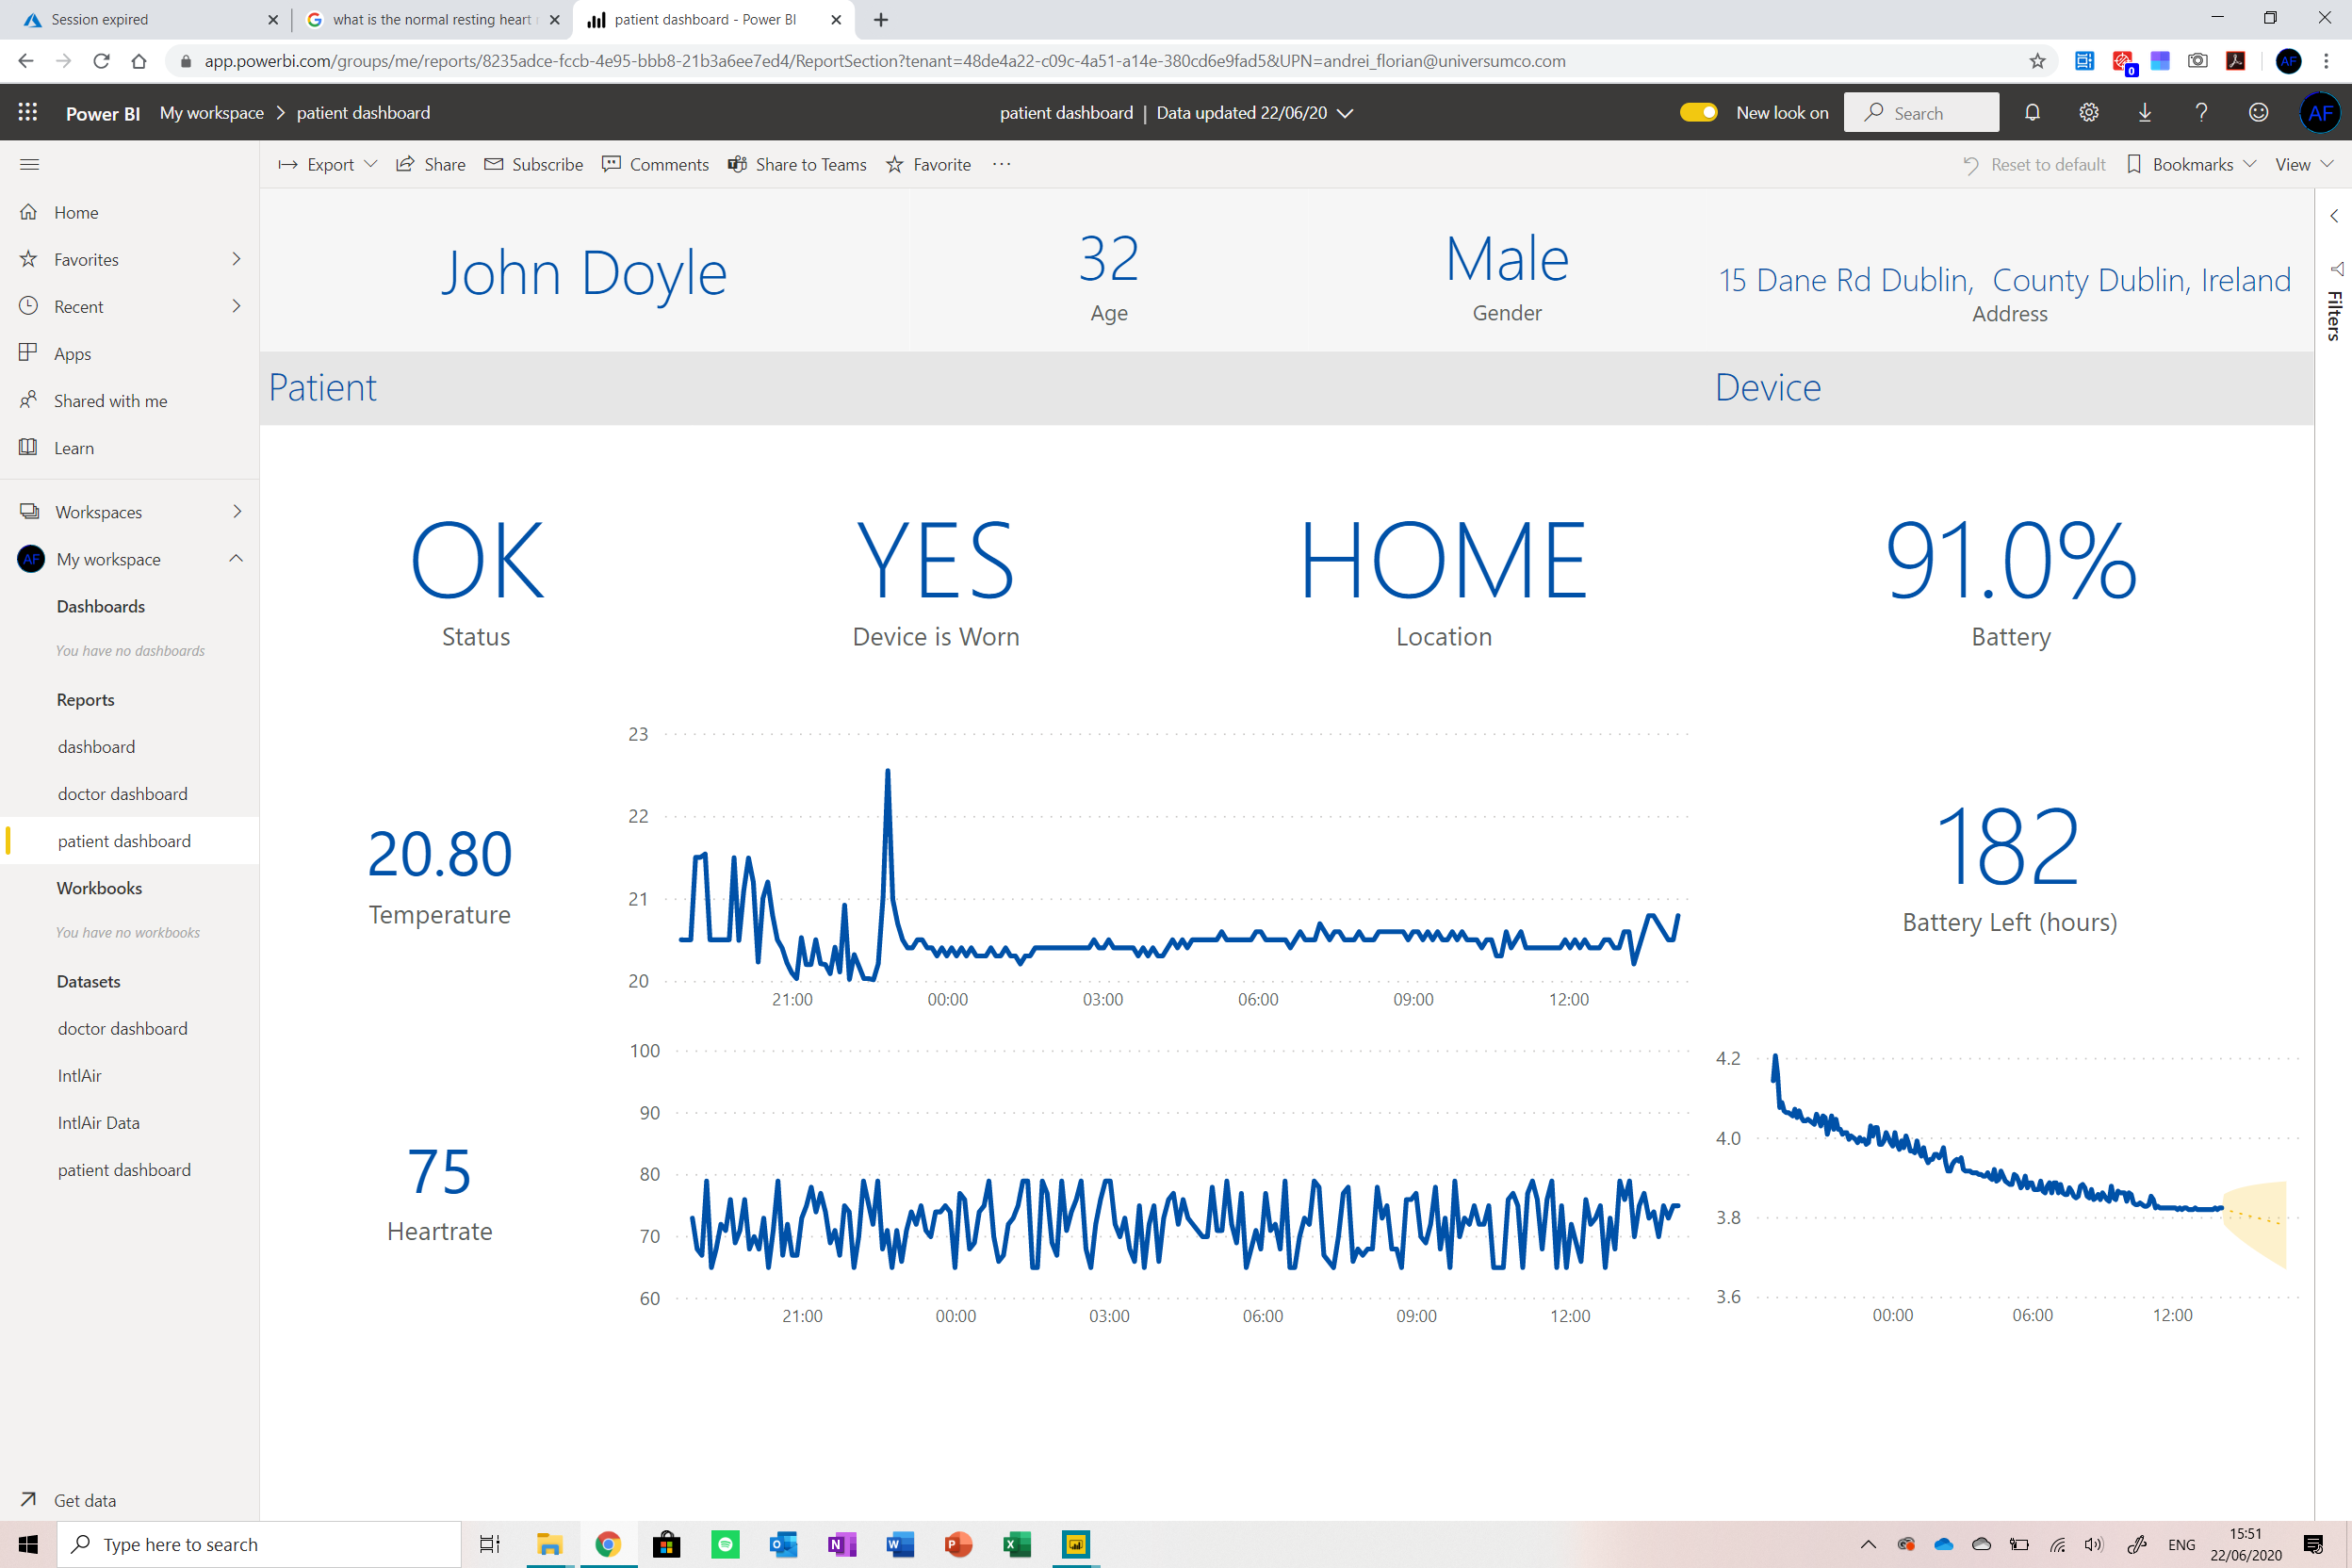
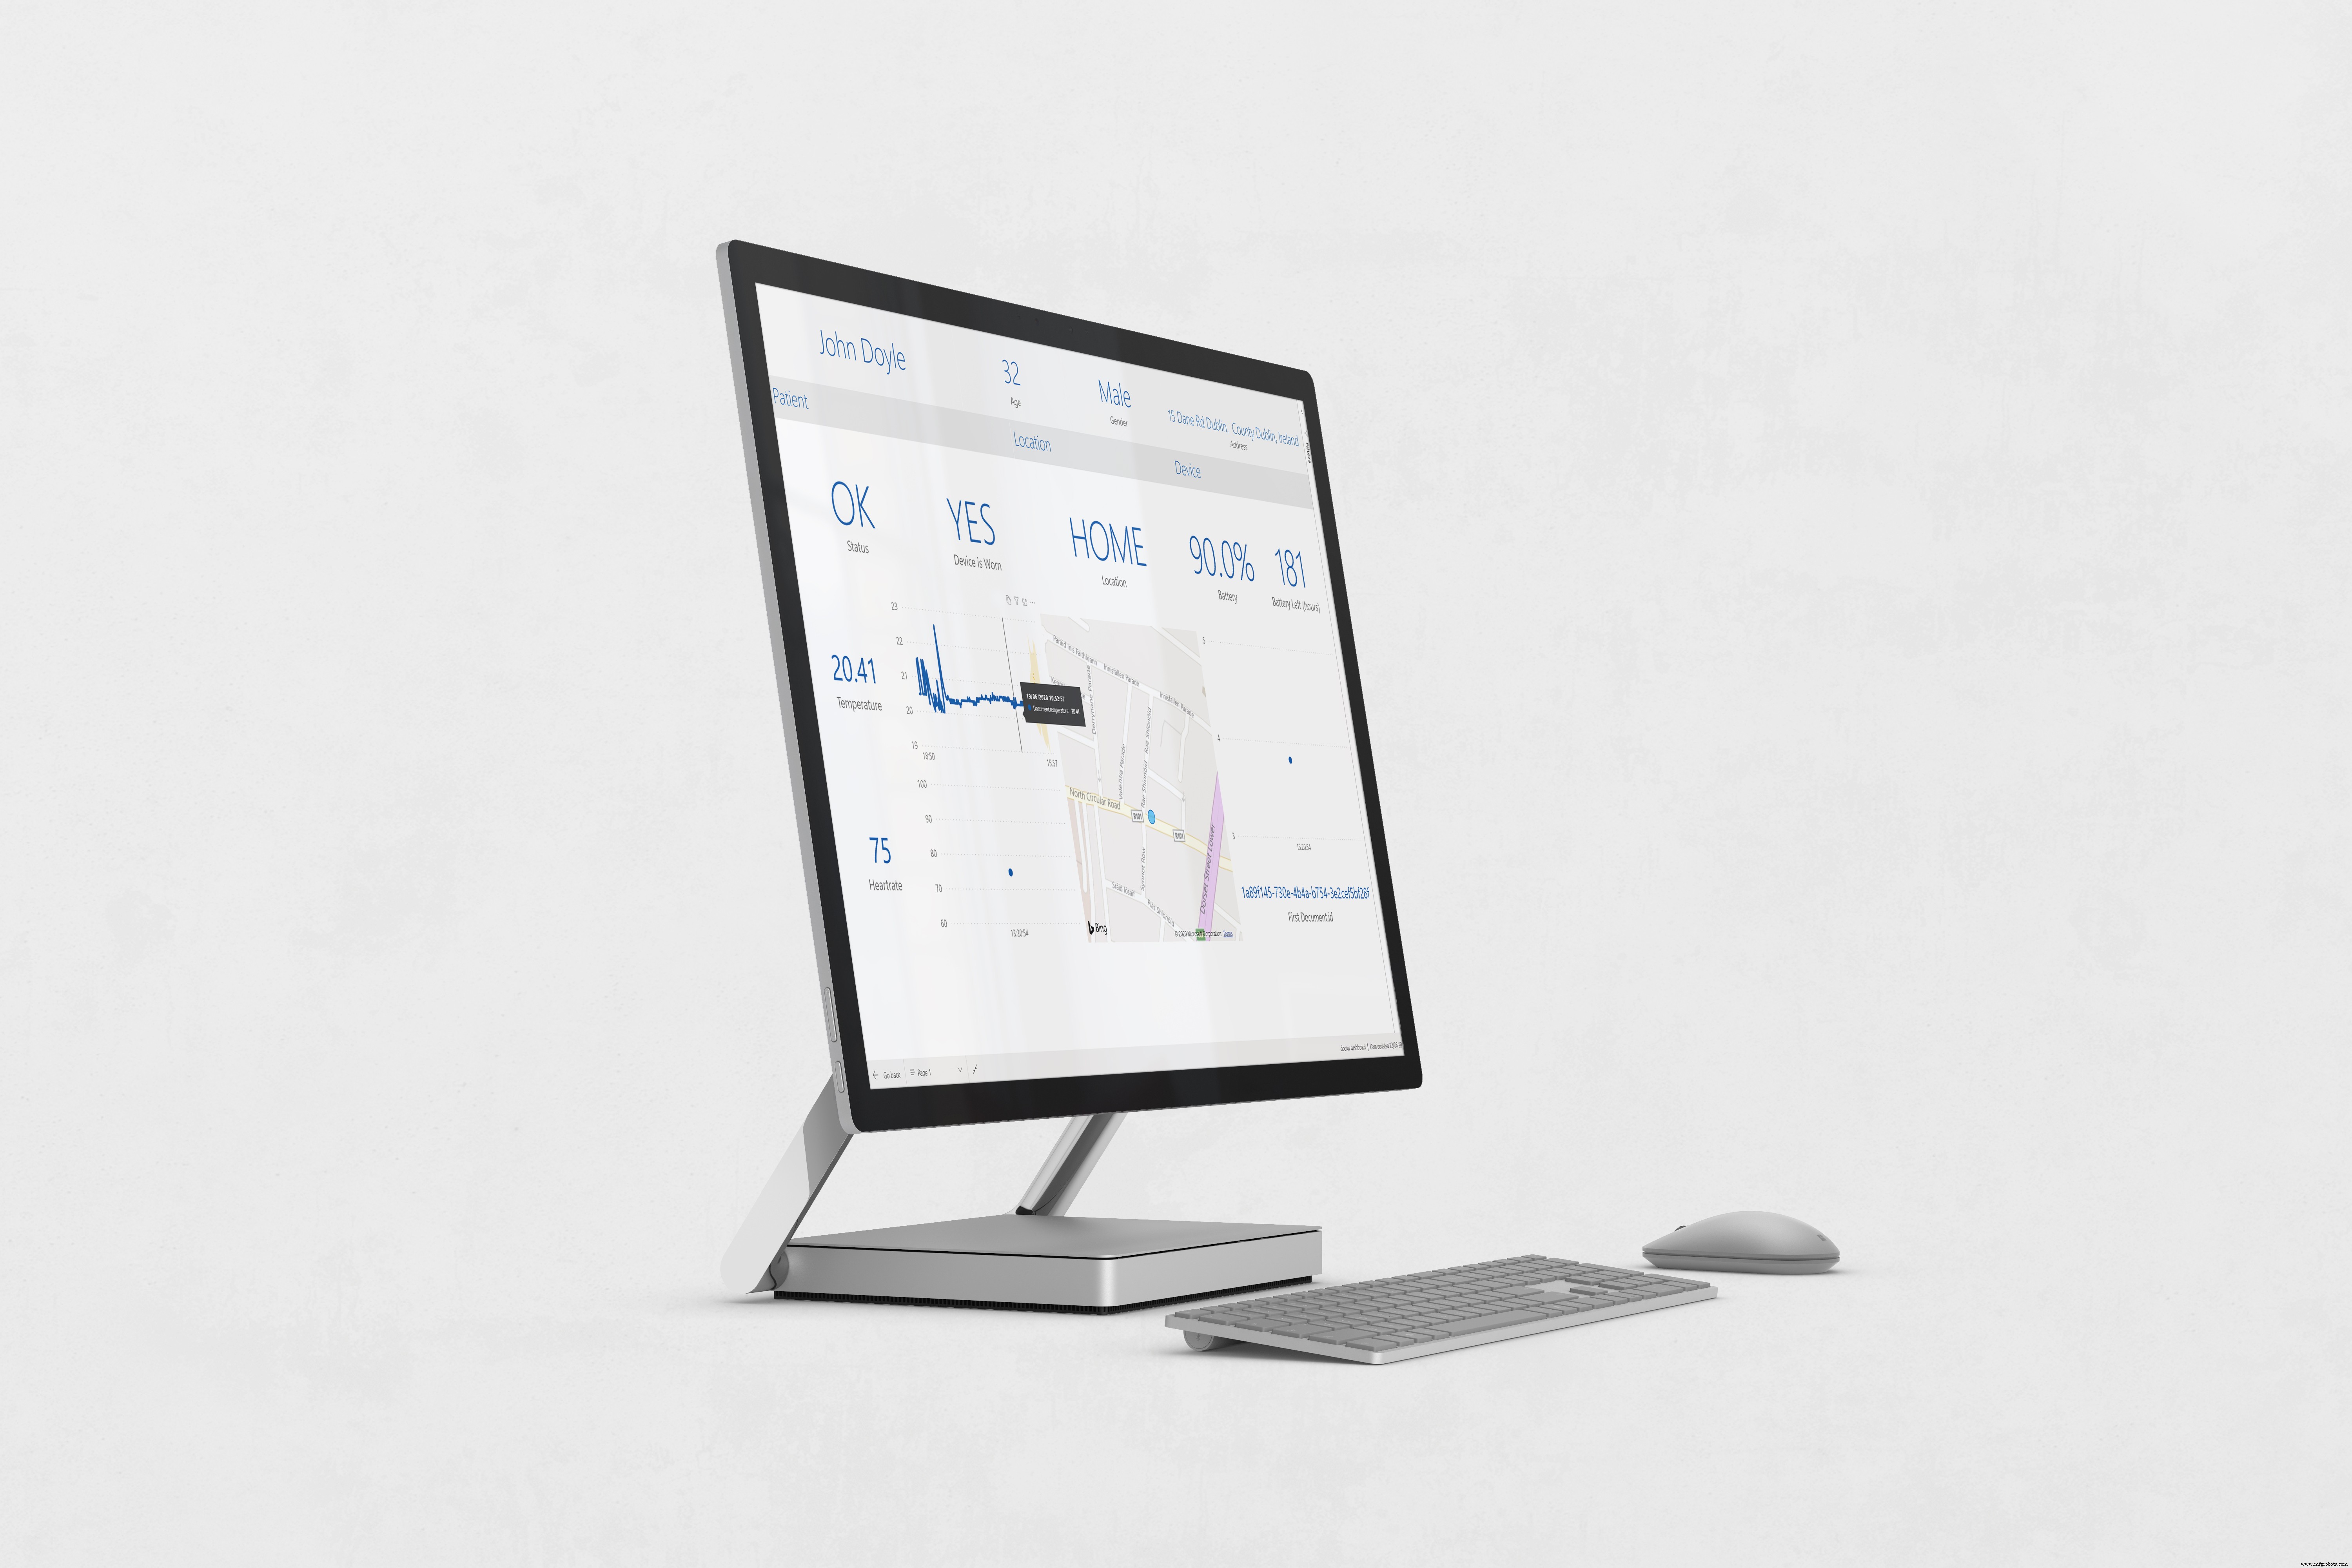
닥터 대시보드
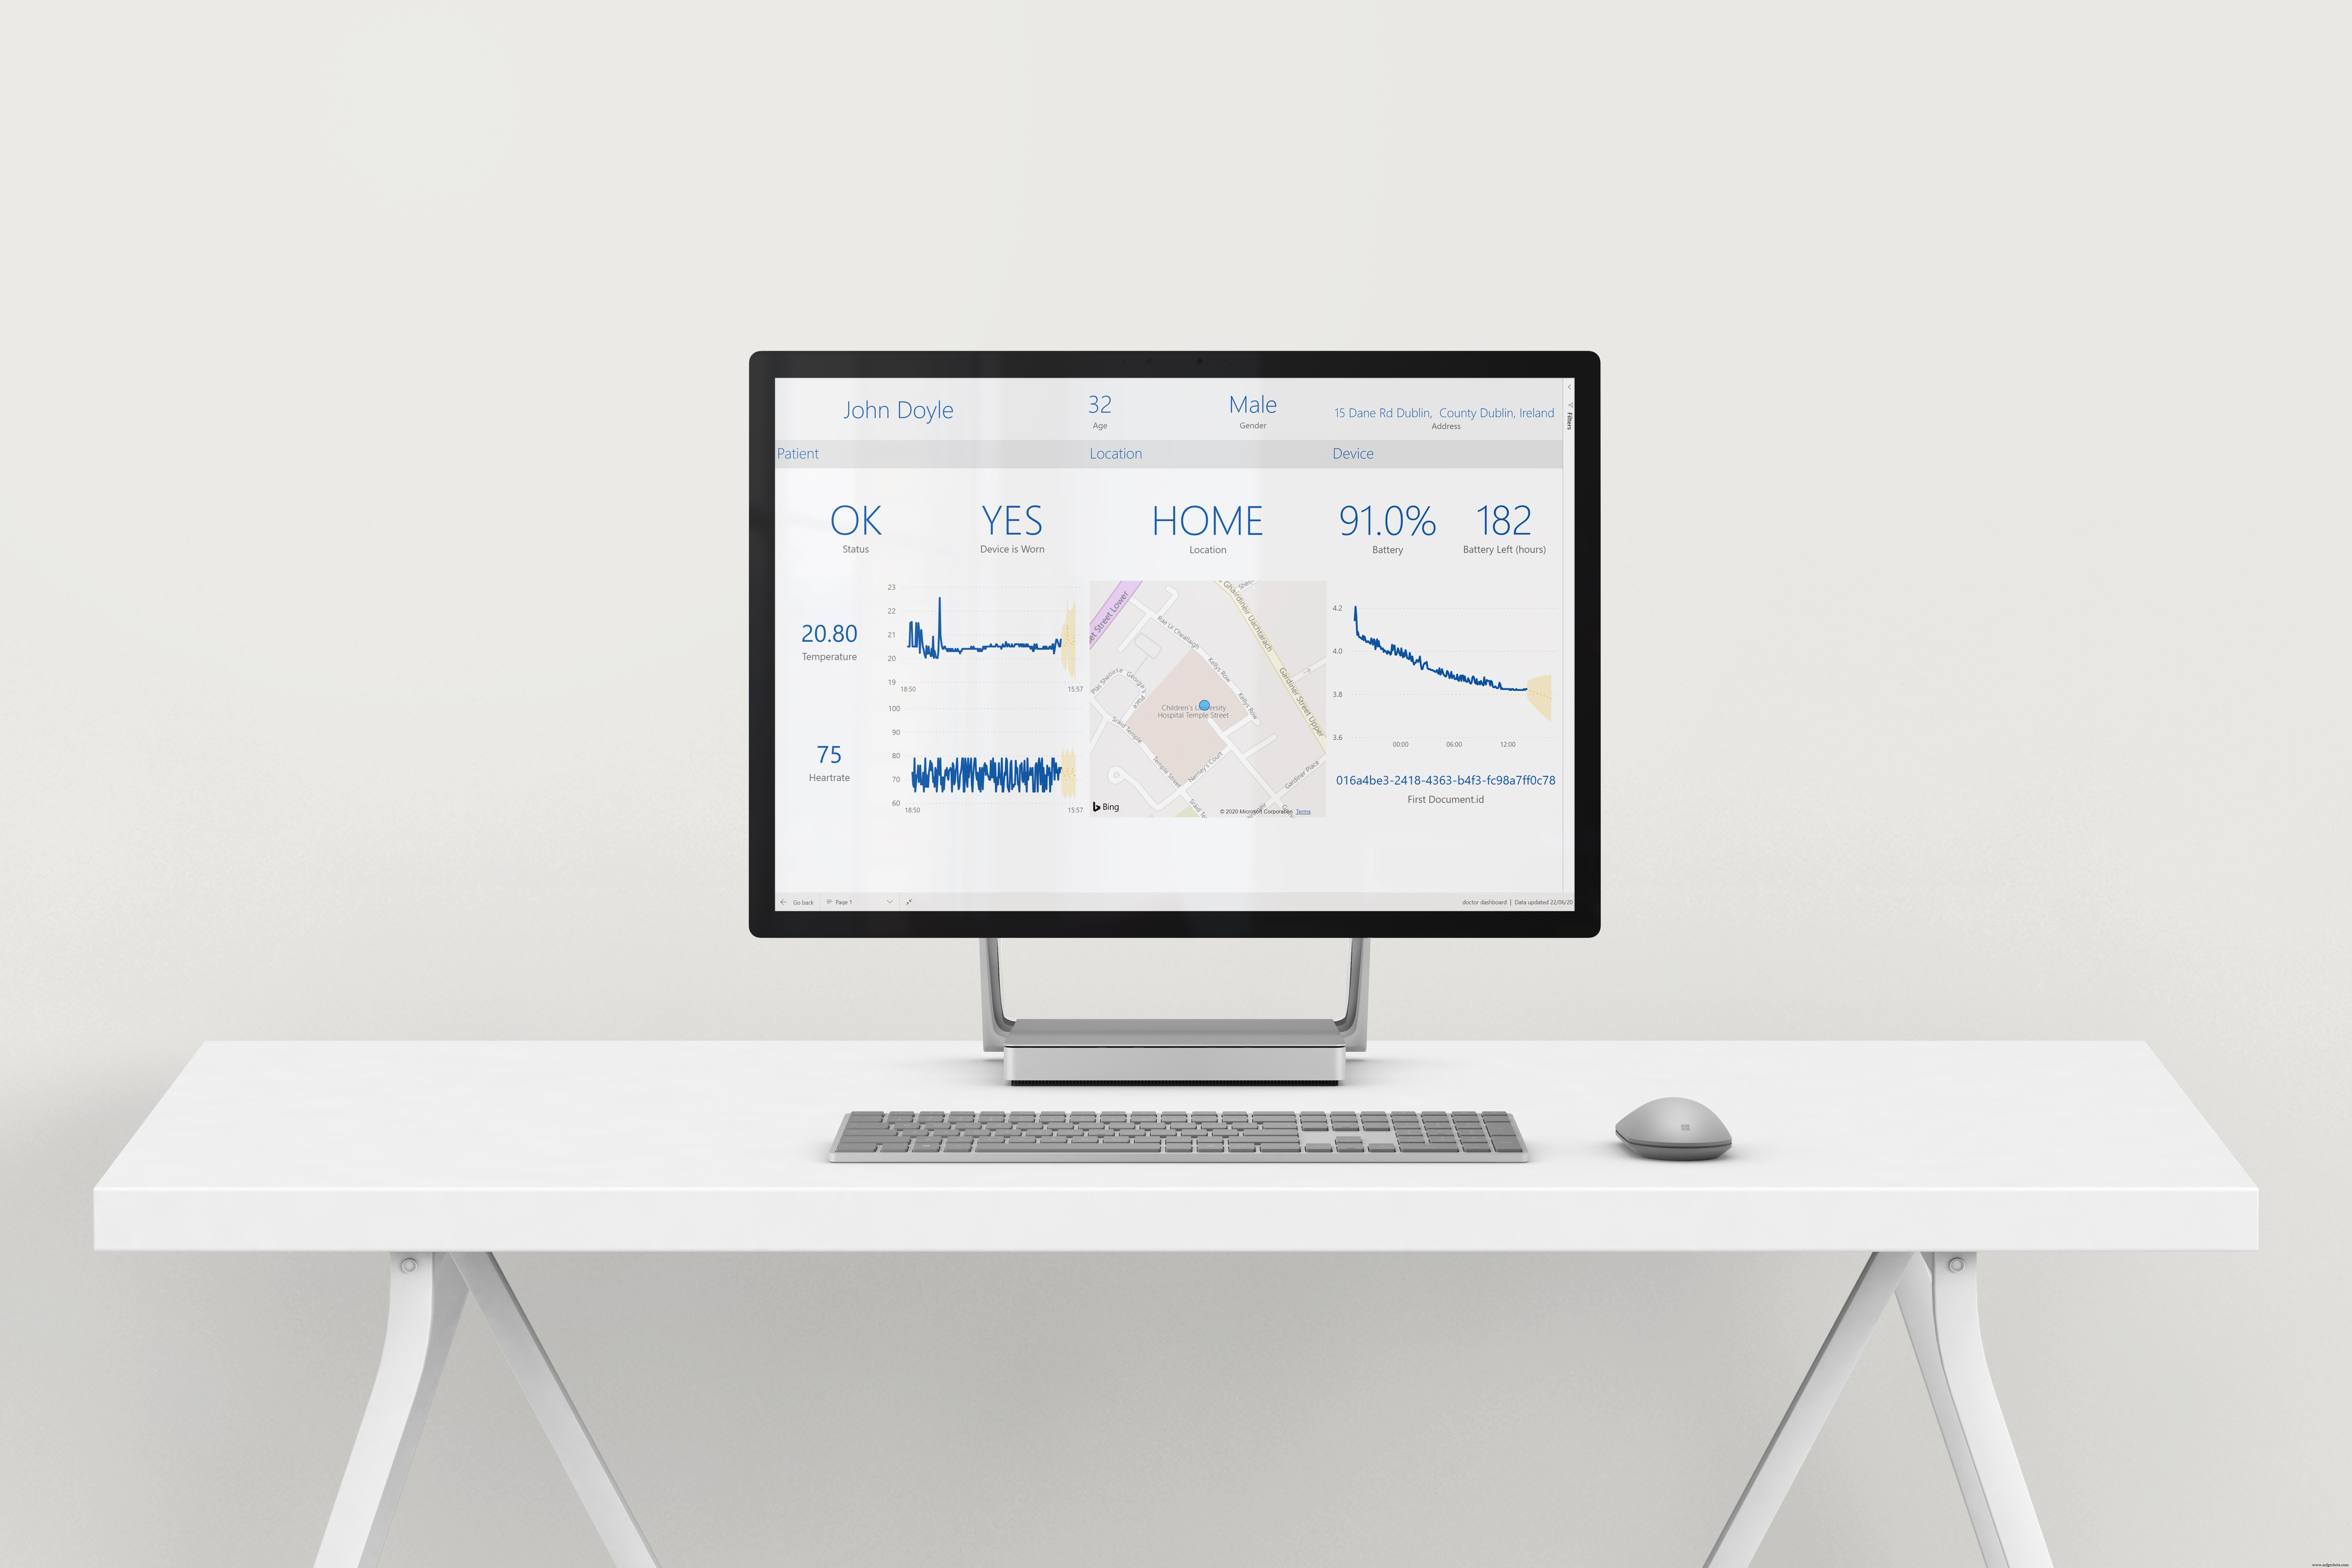
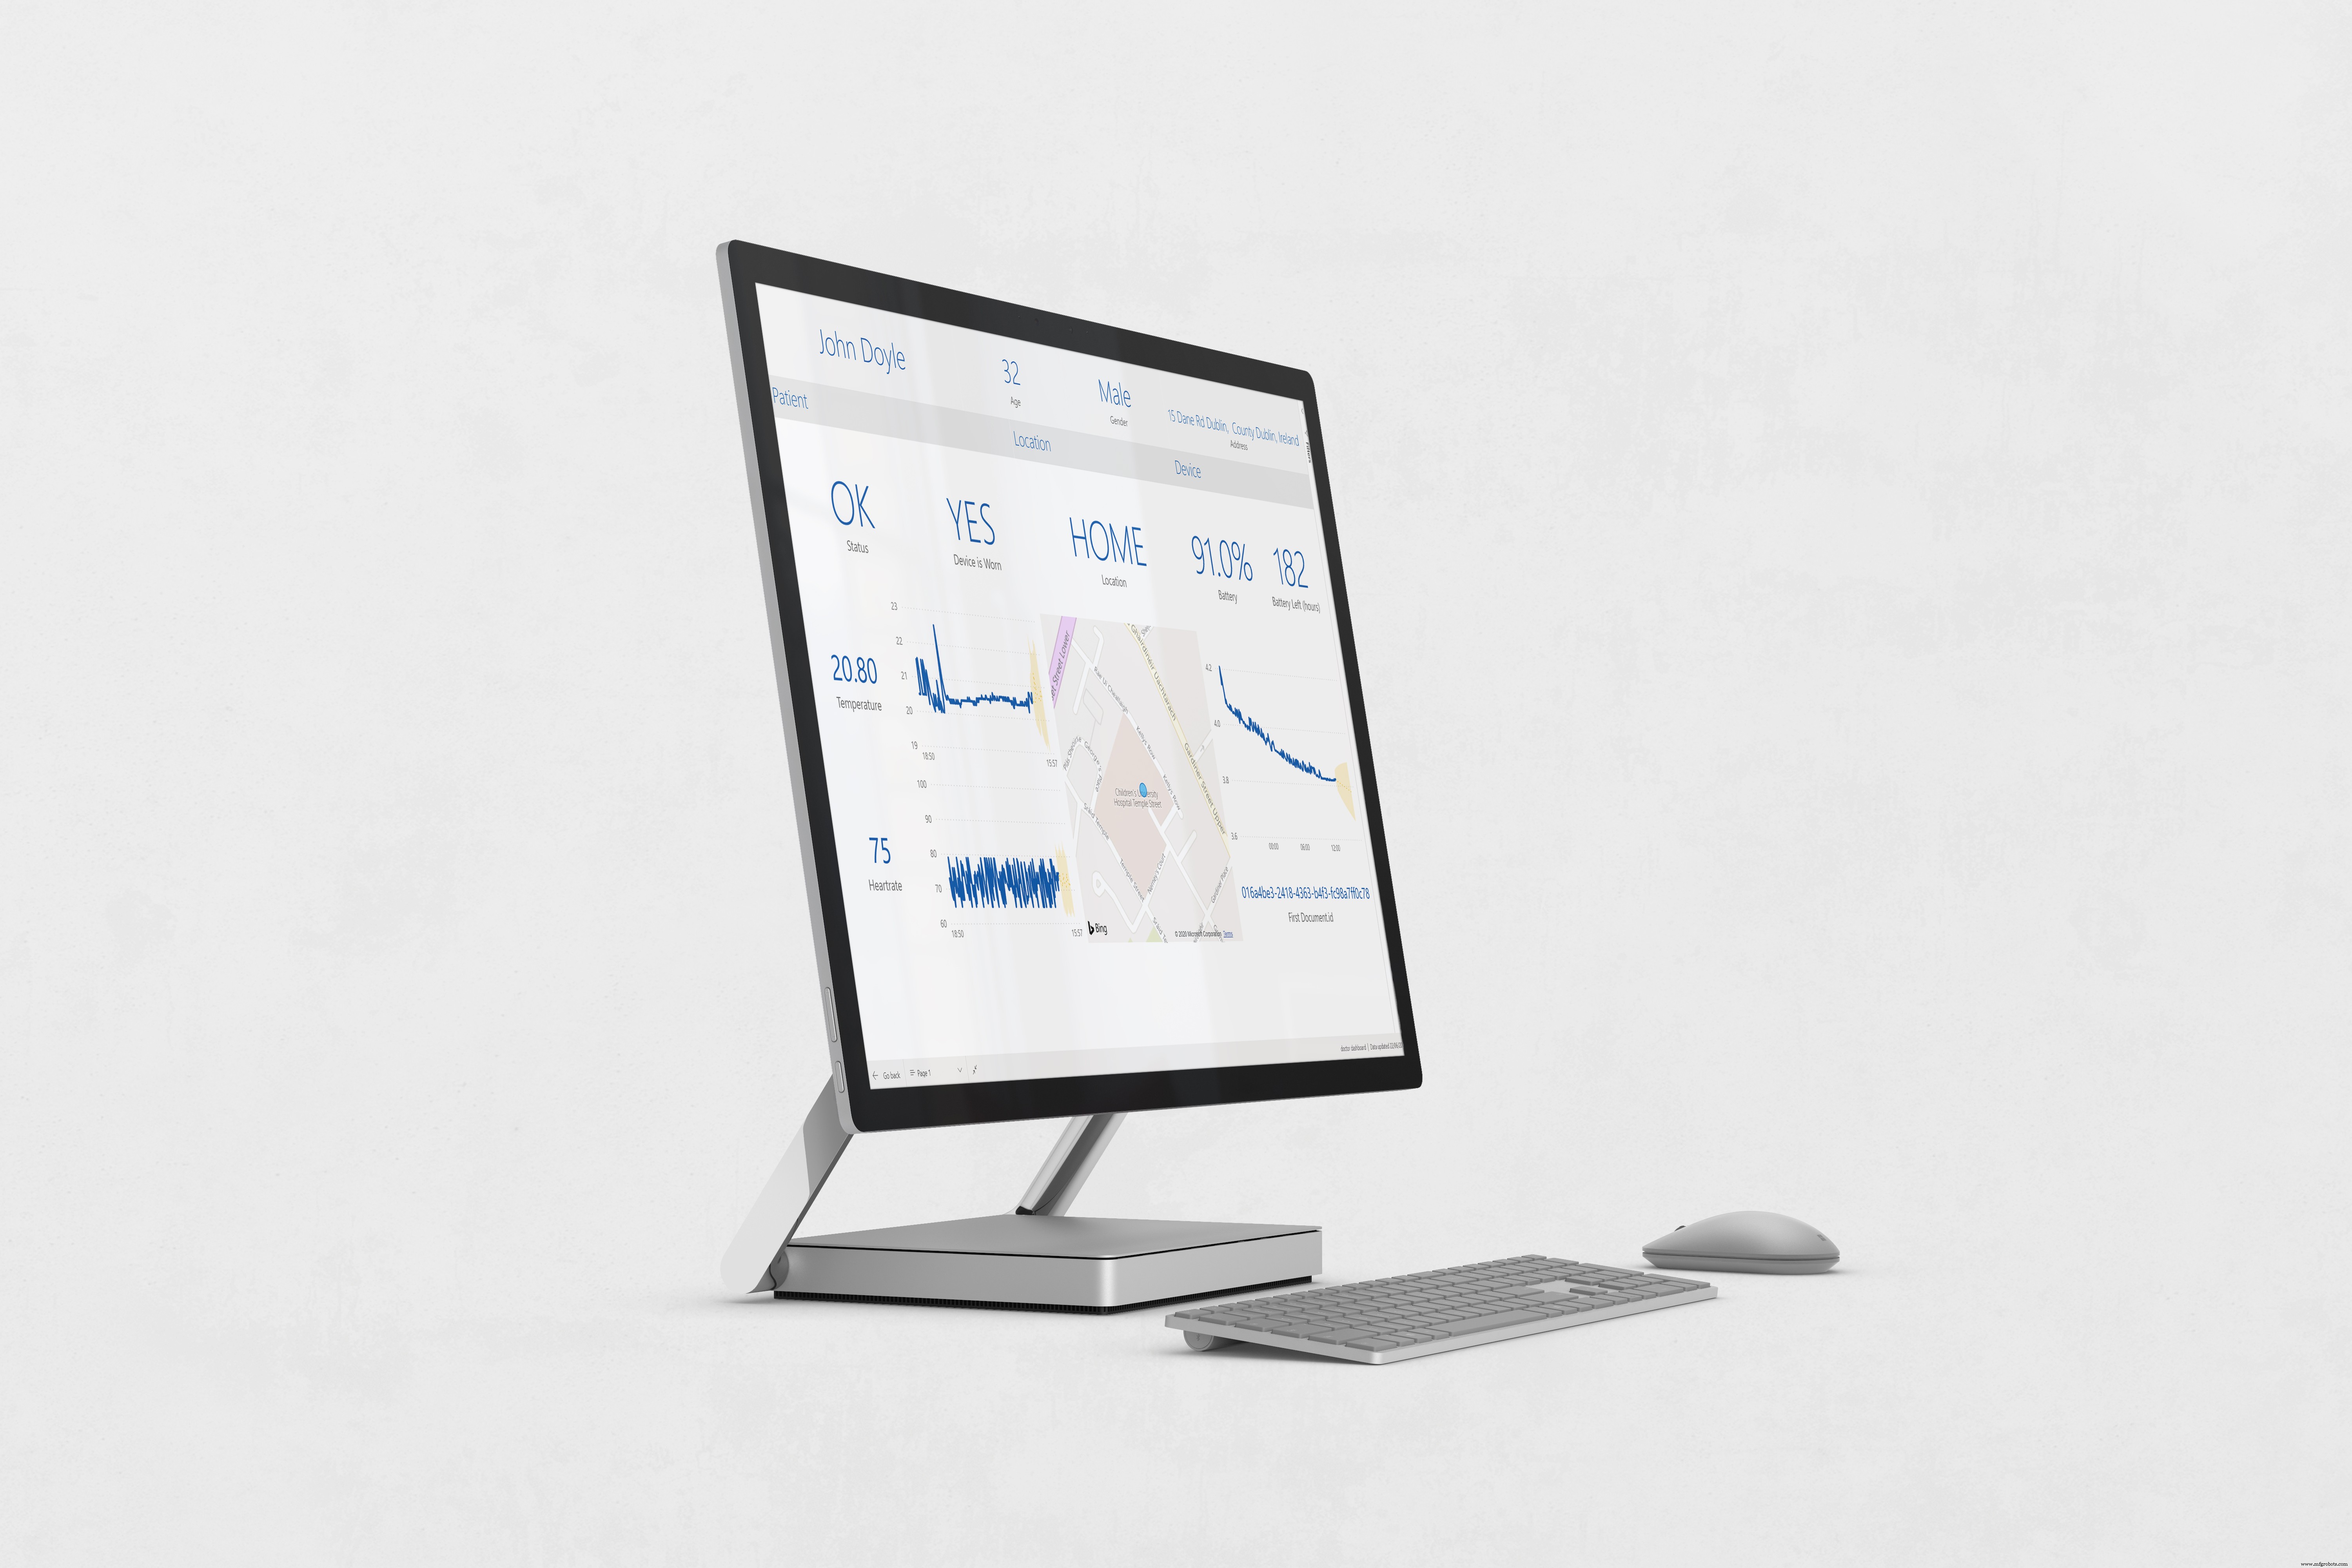
집으로 보내진 이들 환자의 건강을 항시 모니터링하고 이상이 없을 경우 경고를 받을 수 있도록 하는 것이 병원에서 매우 중요하다. 병원은 모니터링되는 모든 환자의 활력과 모든 환자에 대한 특정 보고서를 보여주는 대시보드에 액세스할 수 있습니다. 이를 통해 의사는 환자에게 도움이 필요한 경우 알림을 받은 다음 문제가 무엇인지 정확히 알기 위해 환자를 더 자세히 볼 수 있습니다.
의사는 이메일 형식으로 알림을 수신합니다. 환자가 집에 없거나 기기를 착용하지 않았거나 온도 및/또는 심박수가 불규칙한 경우 대시보드에서 알림 .
또한 의사는 환자의 활력이 비정상적일 때 이메일로 데이터 알림을 받아 즉시 조치를 취할 수 있습니다.
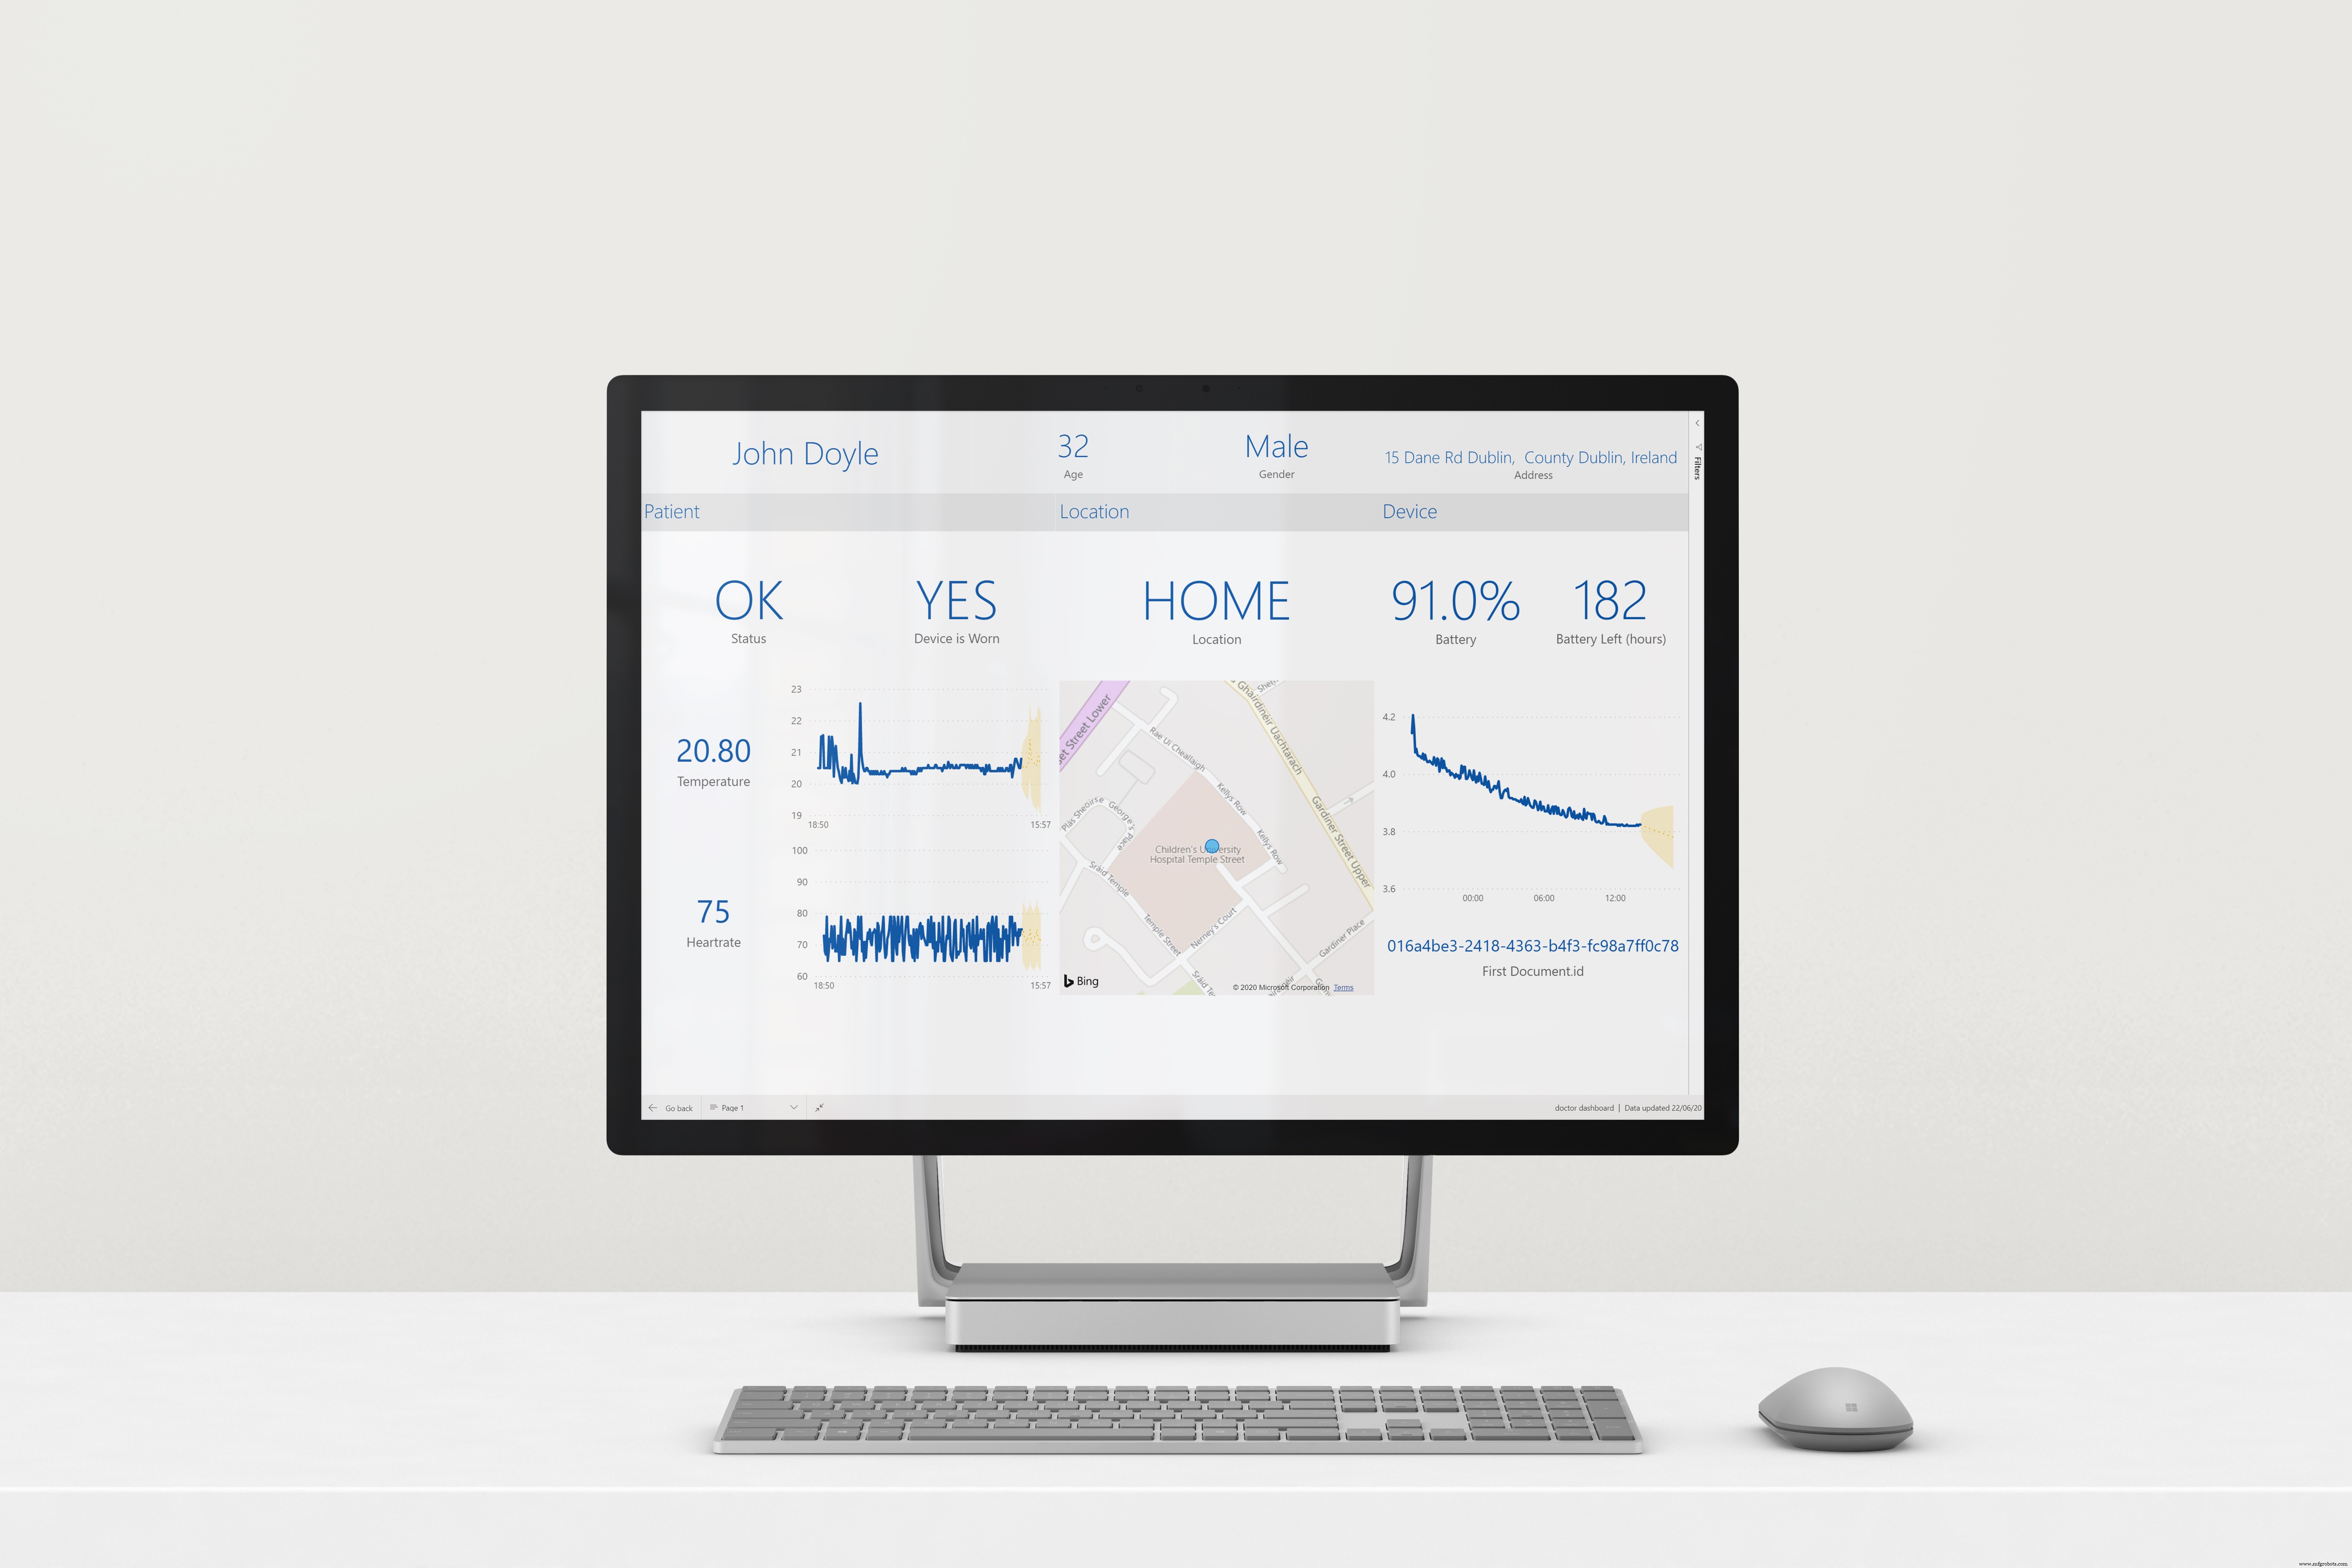
보고서는 환자의 3개 섹션으로 나뉩니다. (vital에 대한 세부정보 제공), 위치 (환자의 위치 및 집에 있는 경우) 및 기기 (배터리 잔량, ID). 머신 러닝 또한 환자의 건강이 시간이 지남에 따라 악화되는 경우 의사에게 표시하여 가까운 장래에 환자의 건강을 예측하는 데 사용됩니다.
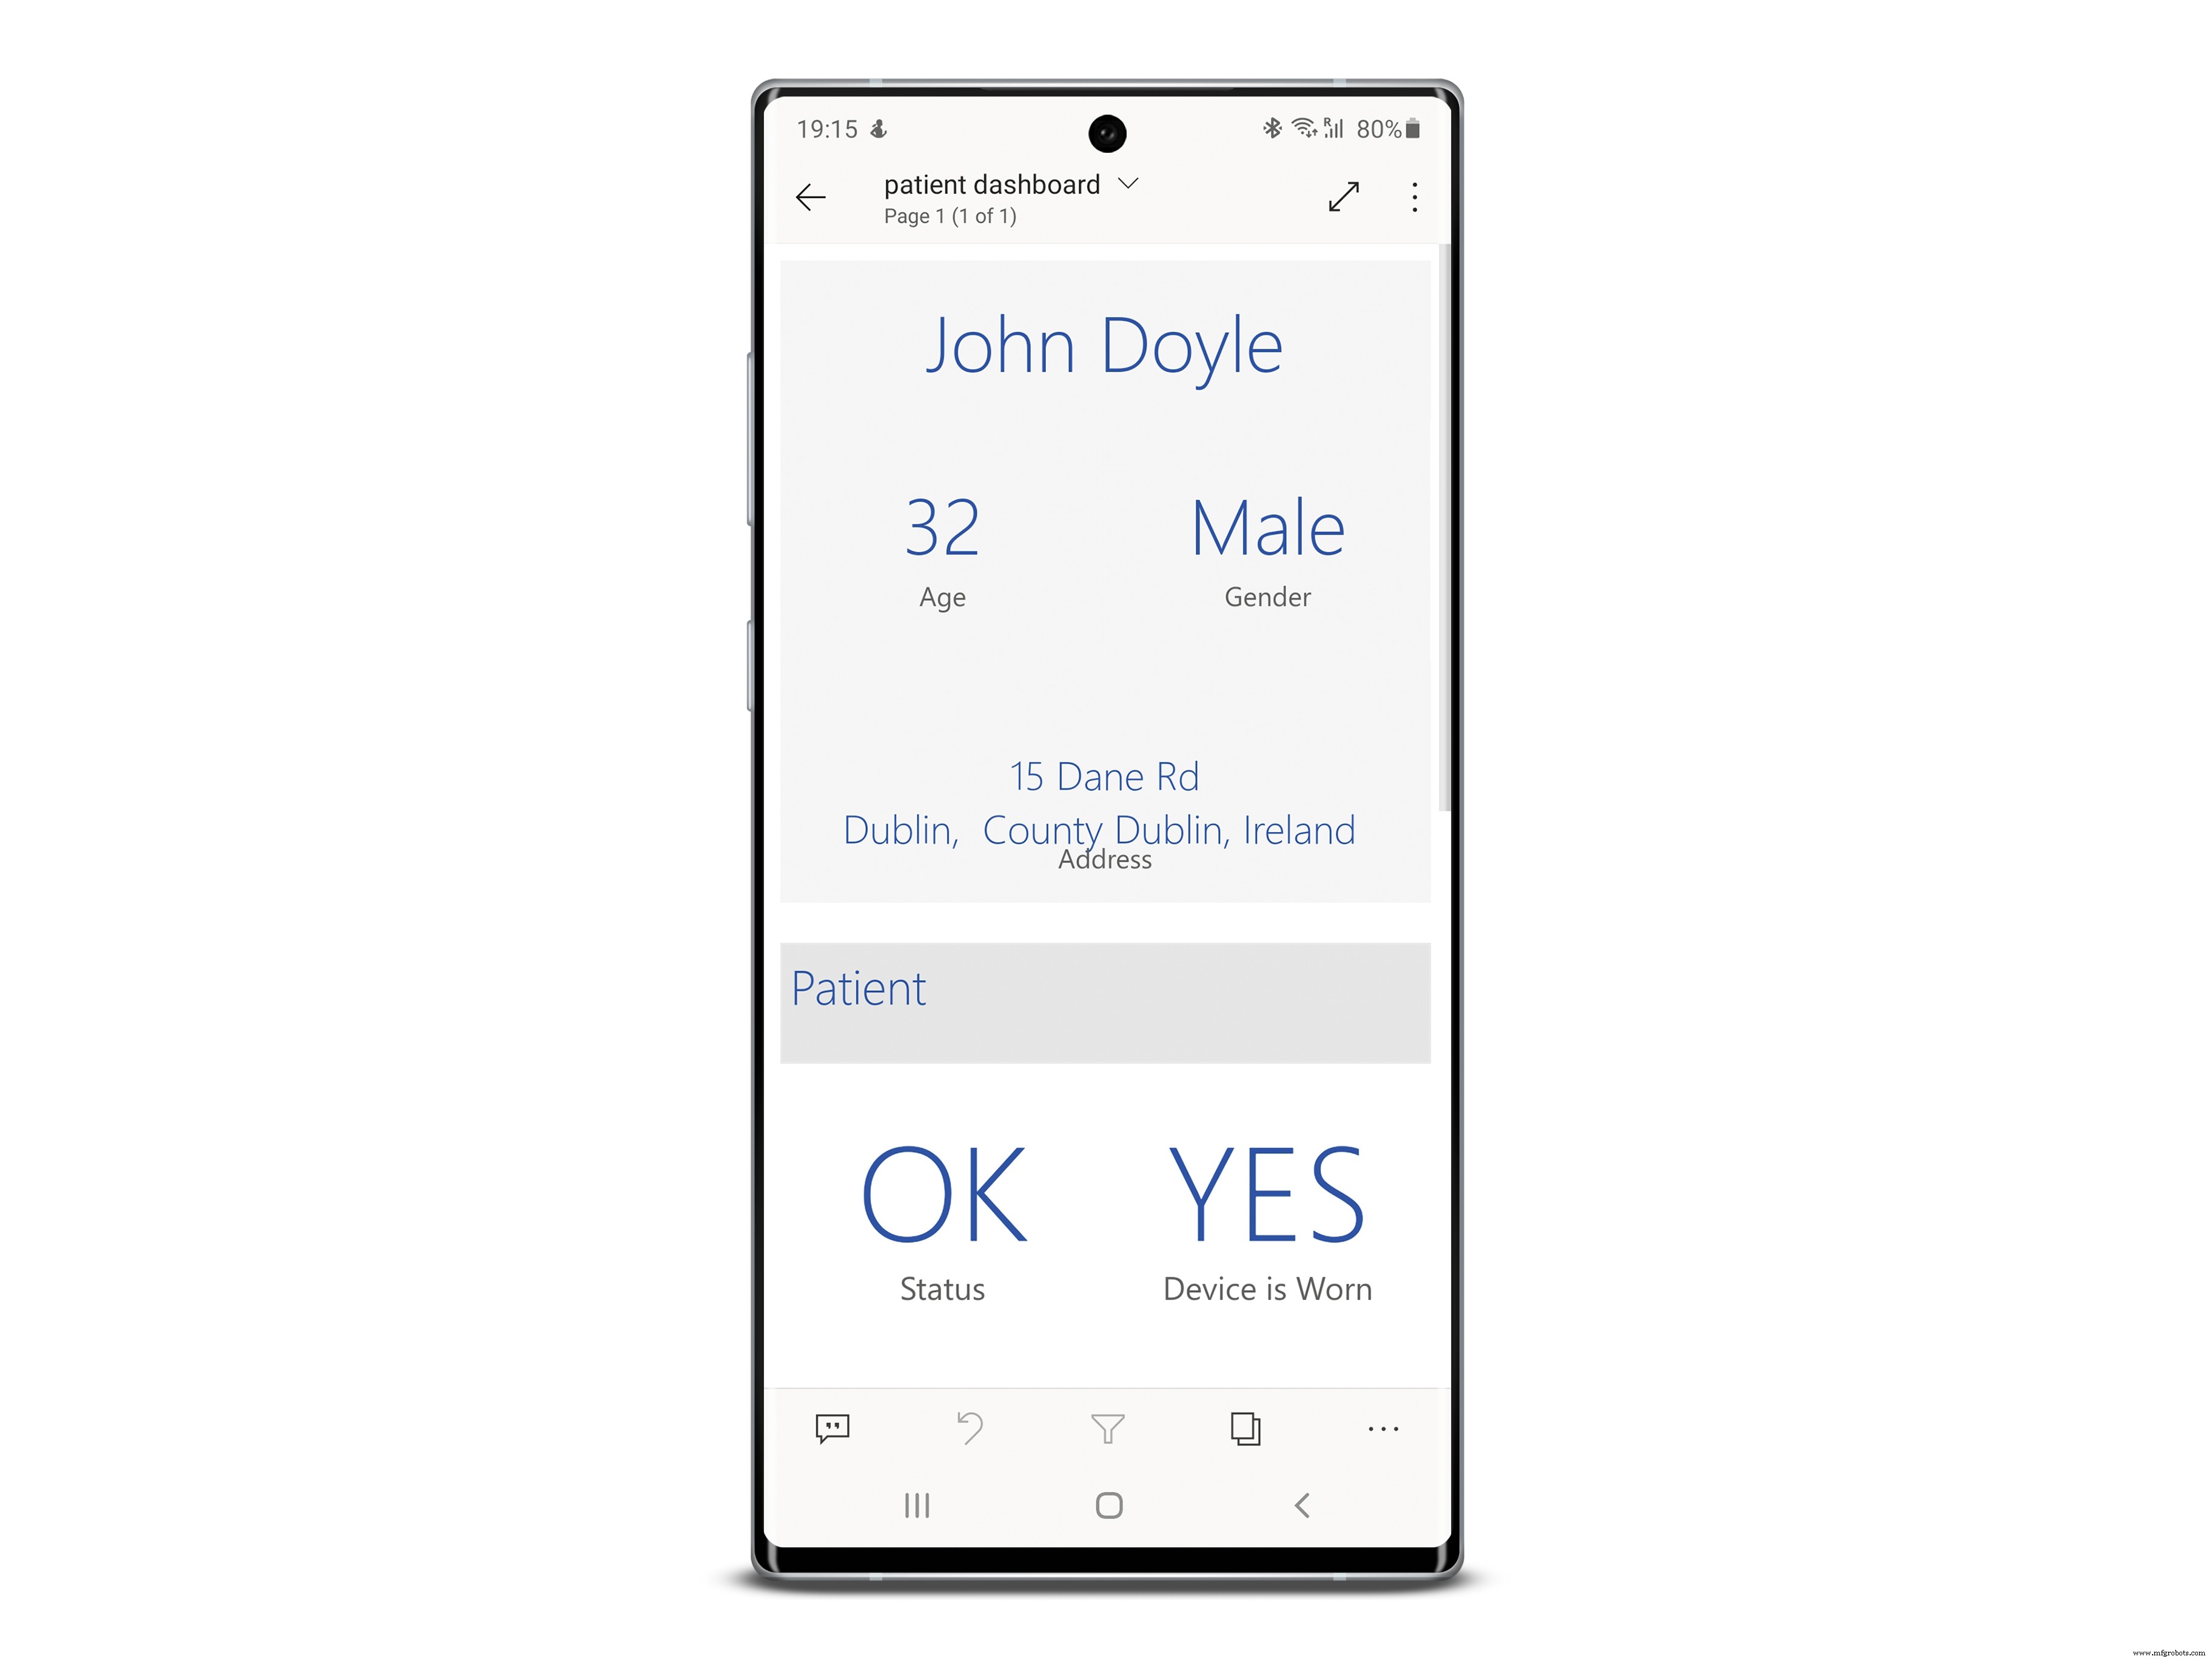
환자 대시보드
나는 환자들이 이 데이터에 액세스하여 자신이 어떻게 지내는지 알고 자각할 수 있어야 한다고 생각합니다. 환자는 데스크톱과 모바일 환경을 모두 사용할 수 있으므로 즉시 데이터를 얻을 수 있습니다.
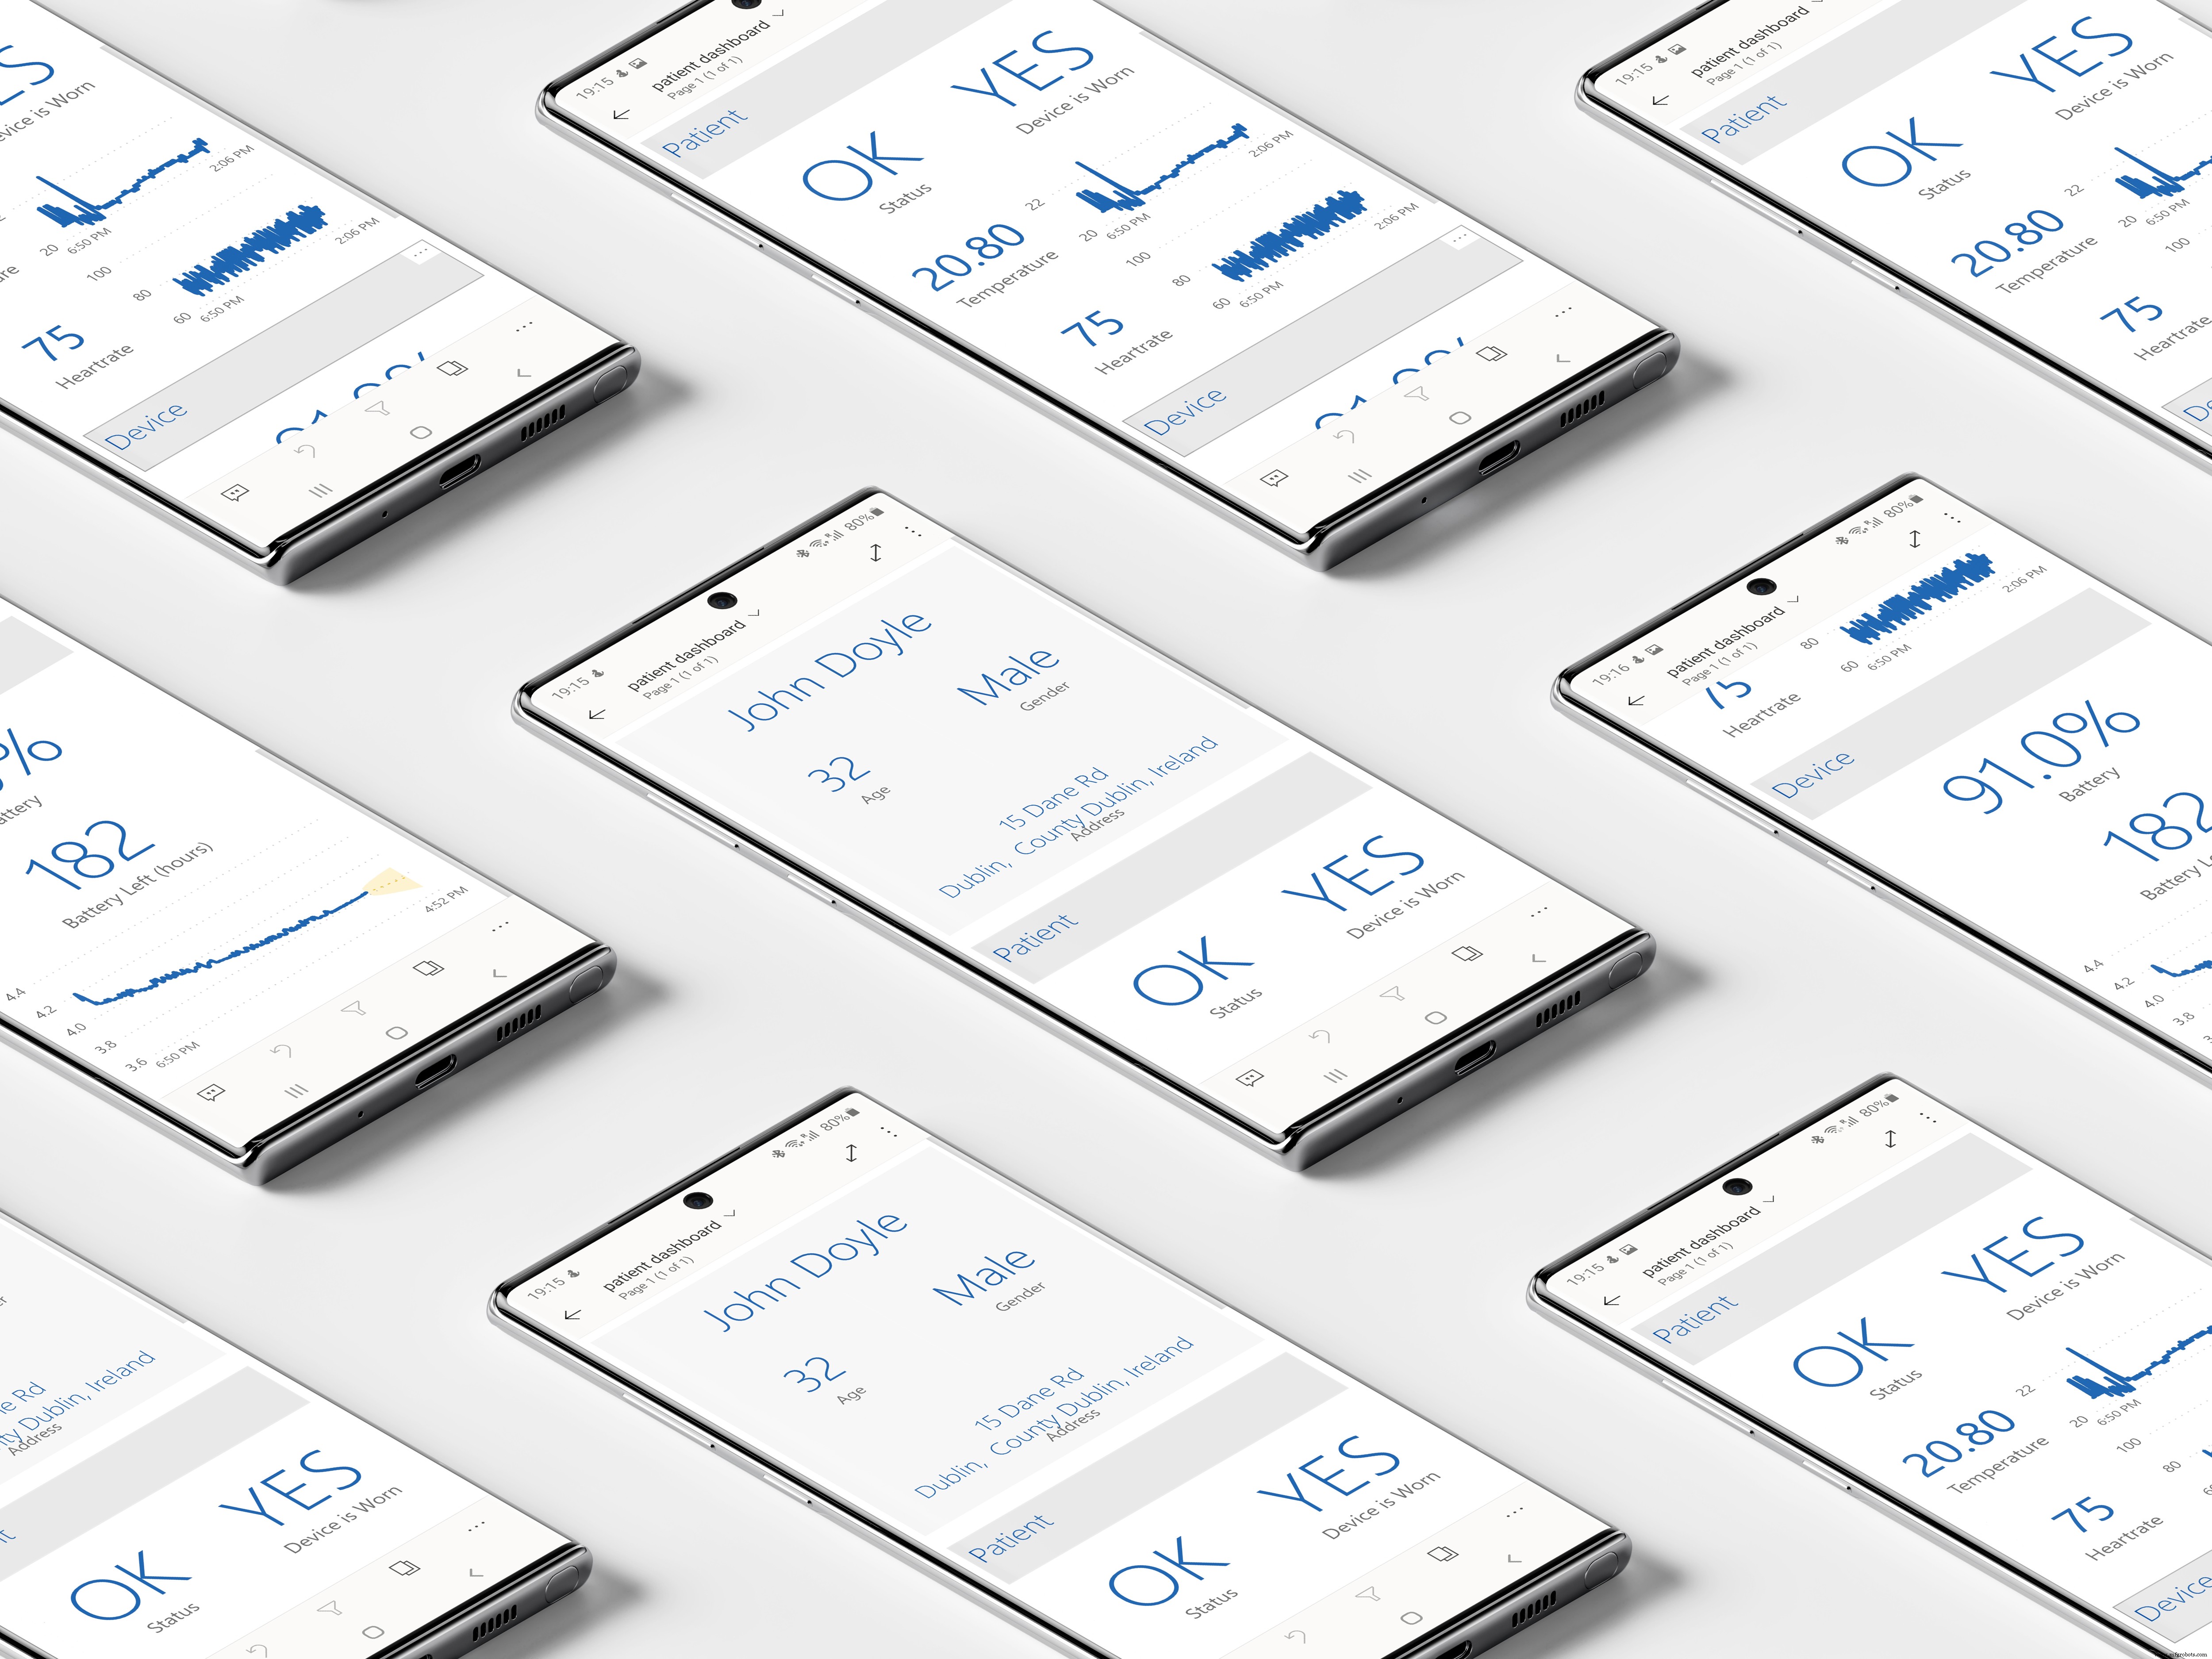
예측 및 지리적 위치 데이터는 환자의 대시보드에 표시되지 않습니다. 그 정보가 필요하지 않기 때문입니다.
대량 생산 및 확장성
이 장치는 가격이 저렴하고 시공이 간편하여 대량 생산에 적합하고 확장이 가능합니다. 이 장치는 전 세계 사람들을 보호하는 셀룰러 서비스를 통해 전 세계 어디에서나 작동할 수 있습니다.
100% 오픈 소스
이 프로젝트를 개발할 때 사용된 모든 자산, 라이브러리 및 기타 자산이 관료주의 없이 가능한 한 빨리 애플리케이션을 개발하고 출시할 수 있도록 오픈 소스임을 확인했습니다. 이 프로젝트는 완전히 오픈 소스이며 GitHub에서 사용할 수 있습니다.
데이터 수집
장치는 기밀로 간주되는 사용자의 지리적 위치 데이터를 수집합니다. 장치는 이 데이터를 로컬에서 처리하지 않지만 클라우드에 의존하여 안전하게 처리하여 사용자의 데이터가 도용되지 않도록 합니다. Azure 데이터베이스와의 연결은 데이터가 잘못된 사람에게 넘어가지 않도록 암호화되고 안전합니다.
더 나아가기
이 프로젝트를 개발하는 동안 제품을 더욱 개발하고 향상시키기 위한 수많은 아이디어가 떠올랐습니다. 이 섹션에서는 이에 대해 자세히 설명합니다.
<울>
애플리케이션 프론트엔드

위의 다이어그램은 장치에서 실행되는 애플리케이션의 아키텍처를 보여줍니다. 다음은 5분마다 장치에서 수행하는 단계입니다. 기기가 모든 데이터를 수집합니다. , 착용 여부 확인 사용자가 만든 다음 패키징하여 GSM을 통해 백엔드로 보냅니다. .
기기는 또한 시간을 추적합니다. , 지정된 서버에서 시간을 가져오고 처음으로 깨어나거나 꺼진 후 온보드 RTC를 이 타임스탬프와 동기화합니다.
애플리케이션의 백엔드
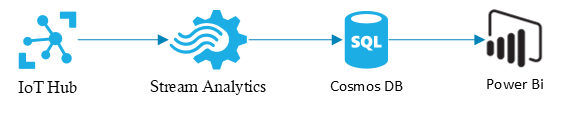
기기에서 보낸 데이터는 Azure IoT Hub에서 수신됩니다. 안전하게 배송된 . 스트림 분석 작업 그런 다음 허브에서 이 데이터를 추출하여 Cosmos DB에 푸시합니다. 데이터 베이스. 환자와 의사 Power Bi 보고서 그런 다음 데이터베이스에서 시간 간격으로 이 데이터를 쿼리하고 기계 학습 알고리즘을 실행한 다음 데이터를 표시합니다. 의사 대시보드 그런 다음 모니터링되는 모든 환자를 수집하고 건강에 대한 간략한 정보를 제공합니다.
Azure가 필요한 이유

사용 및 탐색이 간편할 뿐만 아니라 개발을 위한 훌륭한 무료 계획을 사용할 수 있기 때문에 다른 대안보다 Azure를 사용하는 것을 좋아합니다. 또한 사용자 인터페이스와 내가 사용하는 다른 Microsoft 제품과의 통합도 마음에 듭니다.
시장 조사
많은 국가에서 코로나바이러스 환자가 집에서 자가 격리하는 동안 모니터링에 대한 대안을 시행하고 있습니다. 대만은 혁신적인 추적 시스템을 구현했습니다. 환자가 휴대전화를 통해 추적되는 곳 집에 머물 수 있도록 합니다.
다른 국가들도 자가 격리에 있는 사람들의 건강을 모니터링하기 위한 아이디어를 구현했으며 일부 시스템은 다른 시스템보다 더 잘 작동합니다. 그러나 어떤 제품도 작고 편안한 패키지에 환자의 상태와 위치에 대한 중요한 정보를 모두 수집하지 않습니다.
타겟 잠재고객
이 장치는 약한 형태의 바이러스에 대해 양성 반응을 보이거나 무증상이어서 자가격리하도록 병원에서 보낸 사람들을 대상으로 합니다.
SmartWristband 사용의 이점 <울>
프로젝트 수행
이 섹션에서는 프로젝트 구성을 안내하고 이 애플리케이션을 개발하는 데 필요한 단계를 다룹니다.
1단계:모든 것을 통합하기
가장 먼저 해야 할 일은 필요한 모든 구성 요소를 함께 모으는 것입니다. 필요한 구성 요소와 서비스는 다음과 같습니다.
<울>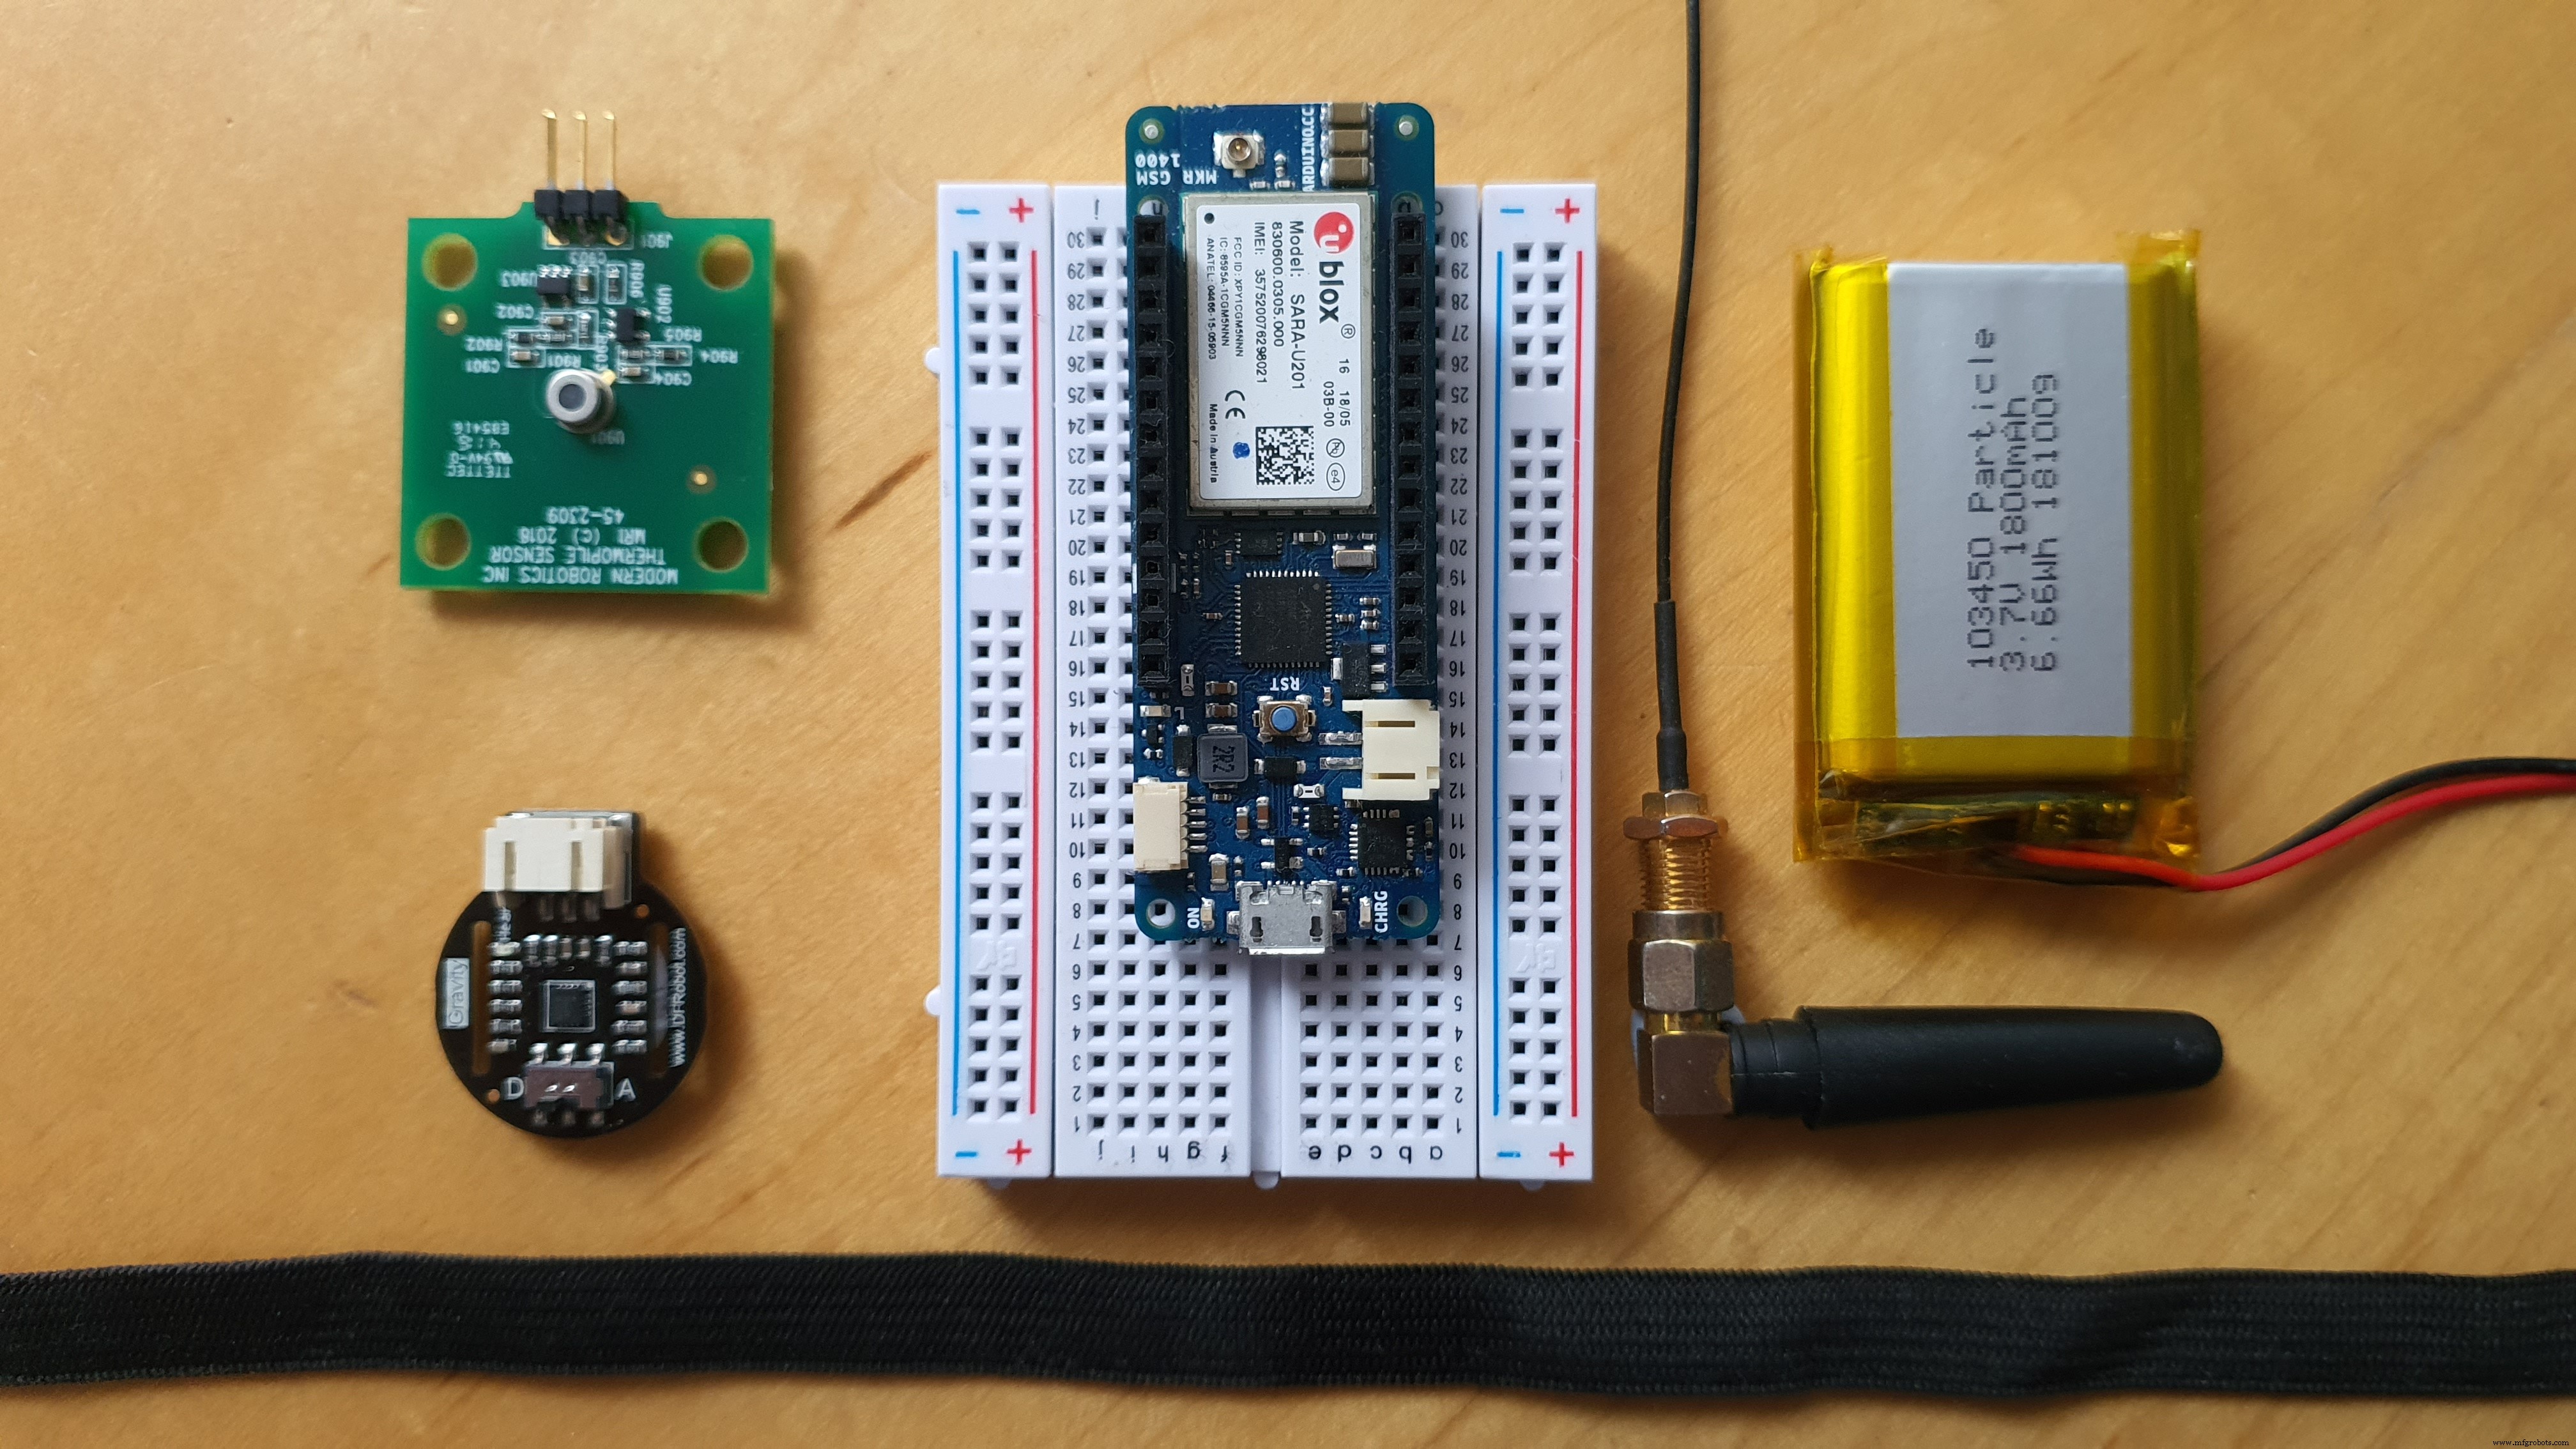
필요한 하드웨어뿐만 아니라 프로젝트를 시작하기 전에 설정해야 하는 몇 가지 서비스도 있습니다. 시작하려면 아래에 링크된 자습서를 사용하십시오.
<울>
2단계:MKR GSM 사용
프로젝트 자체를 만들기 시작하기 전에 Azure IoT에 연결하도록 MKR GSM을 구성해야 합니다. . 이를 위해 인증서를 생성 및 저장해야 합니다. 백엔드와의 연결을 확인할 수 있습니다.
MKR NB에 대해 이것을 다루는 Hackster에 대한 자습서가 있습니다. 이 자습서를 처음부터 따르고 인증서를 생성한 후에는 중지해야 합니다. . SHA1 문자열을 저장해야 합니다. 나중에 필요할 것이기 때문입니다. 튜토리얼이 여기에 있습니다.
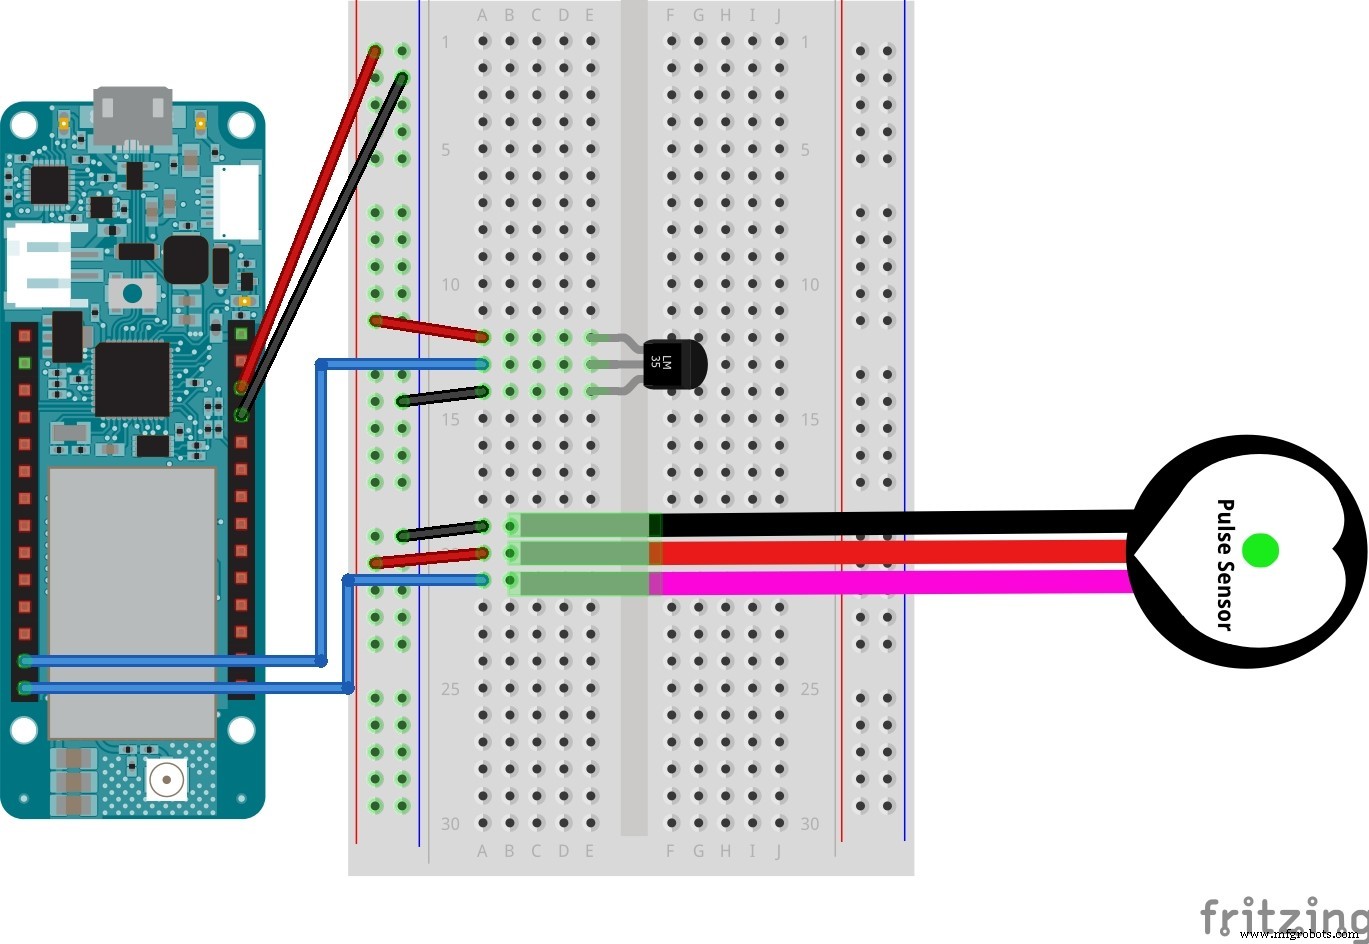
3단계:모든 것을 함께 연결하기
다음으로 해야 할 일은 모든 것을 정리하는 것입니다. 아래는 도식을 묘사한 이미지입니다. 이 프로젝트를 만들기 위해. 구성 요소가 회로도의 구성 요소와 같지 않을 수 있습니다. 온도 센서를 A4에 연결했는지 확인하세요. 기기 및 심박수 센서를 A5로 . SIM을 넣는 것을 잊지 마세요!

4단계:IoT Hub로
자, 이제 모든 작업이 완료되었으므로 IoT 허브로 넘어갈 수 있습니다. . 백엔드에서 작업할 것입니다. 다음 몇 단계를 위해 먼저 방해가 되지 않도록 합니다. 계속하기 전에 Azure 계정이 있는지 확인하세요.
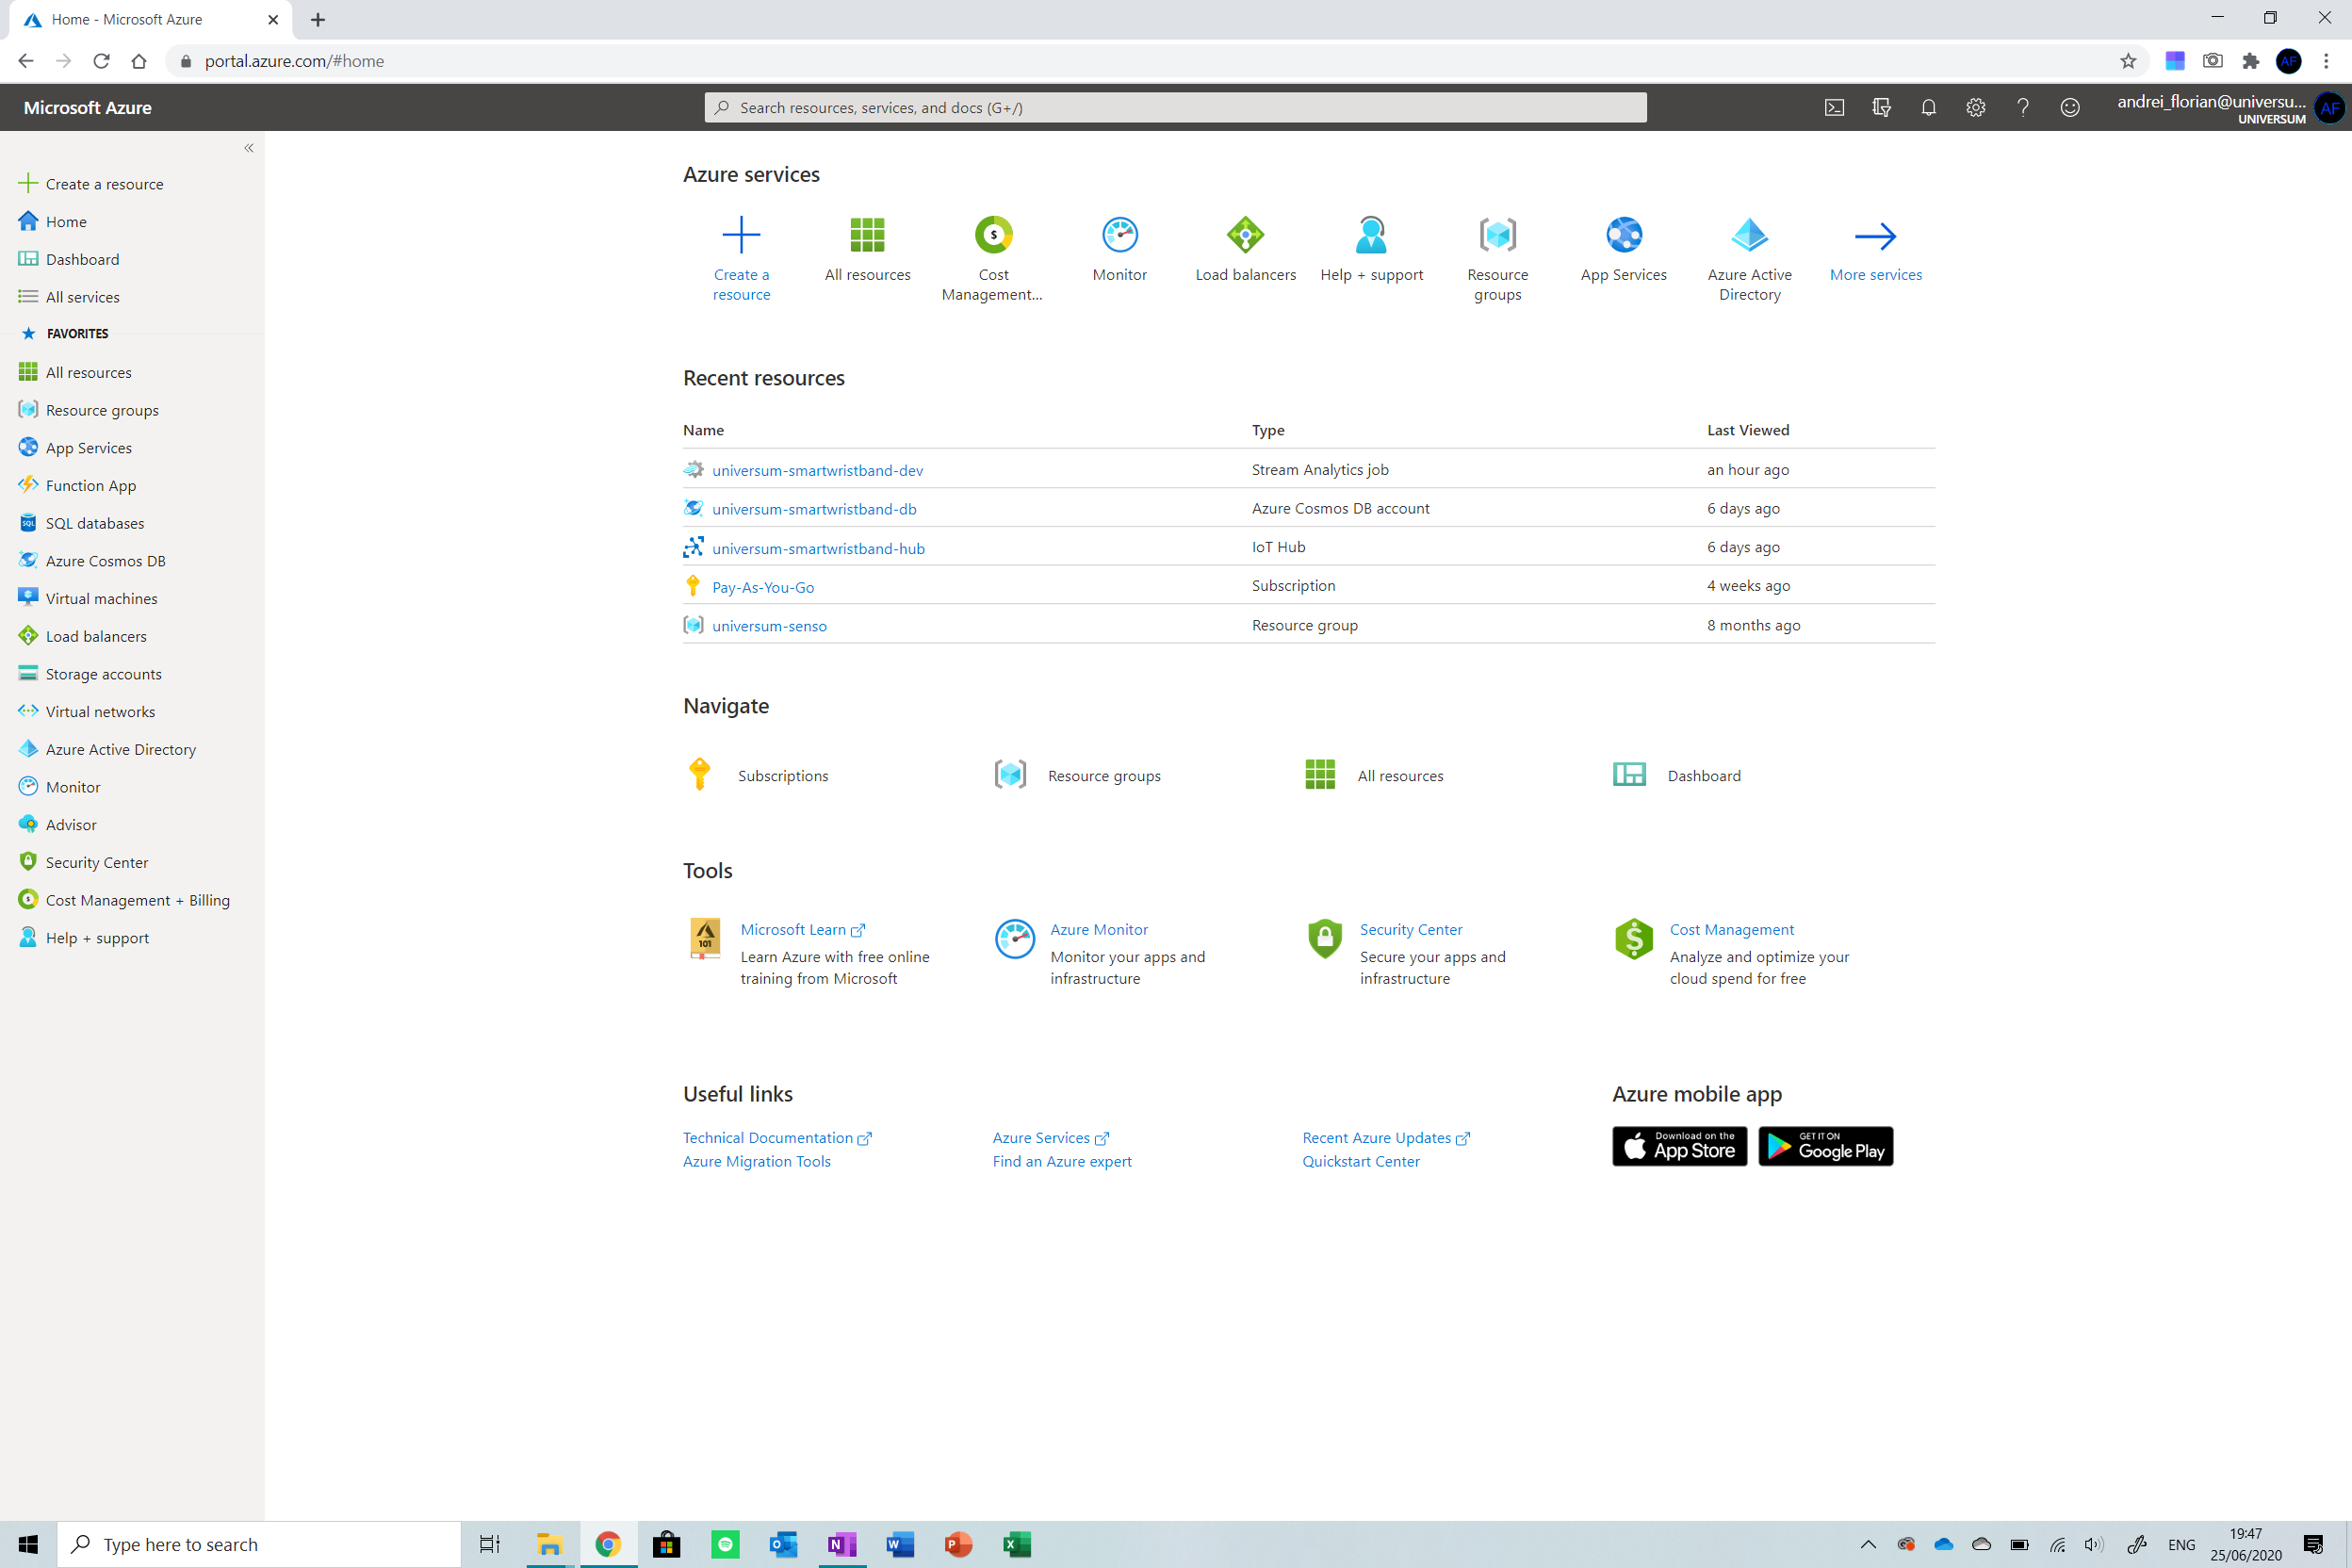
가장 먼저 해야 할 일은 콘솔로 이동하는 것입니다. (portal.azure.com)을 클릭하고 리소스 만들기를 클릭합니다. 화면 왼쪽 상단의 버튼. 이제 IoT Hub 입력 드롭다운에서 옵션을 선택합니다.
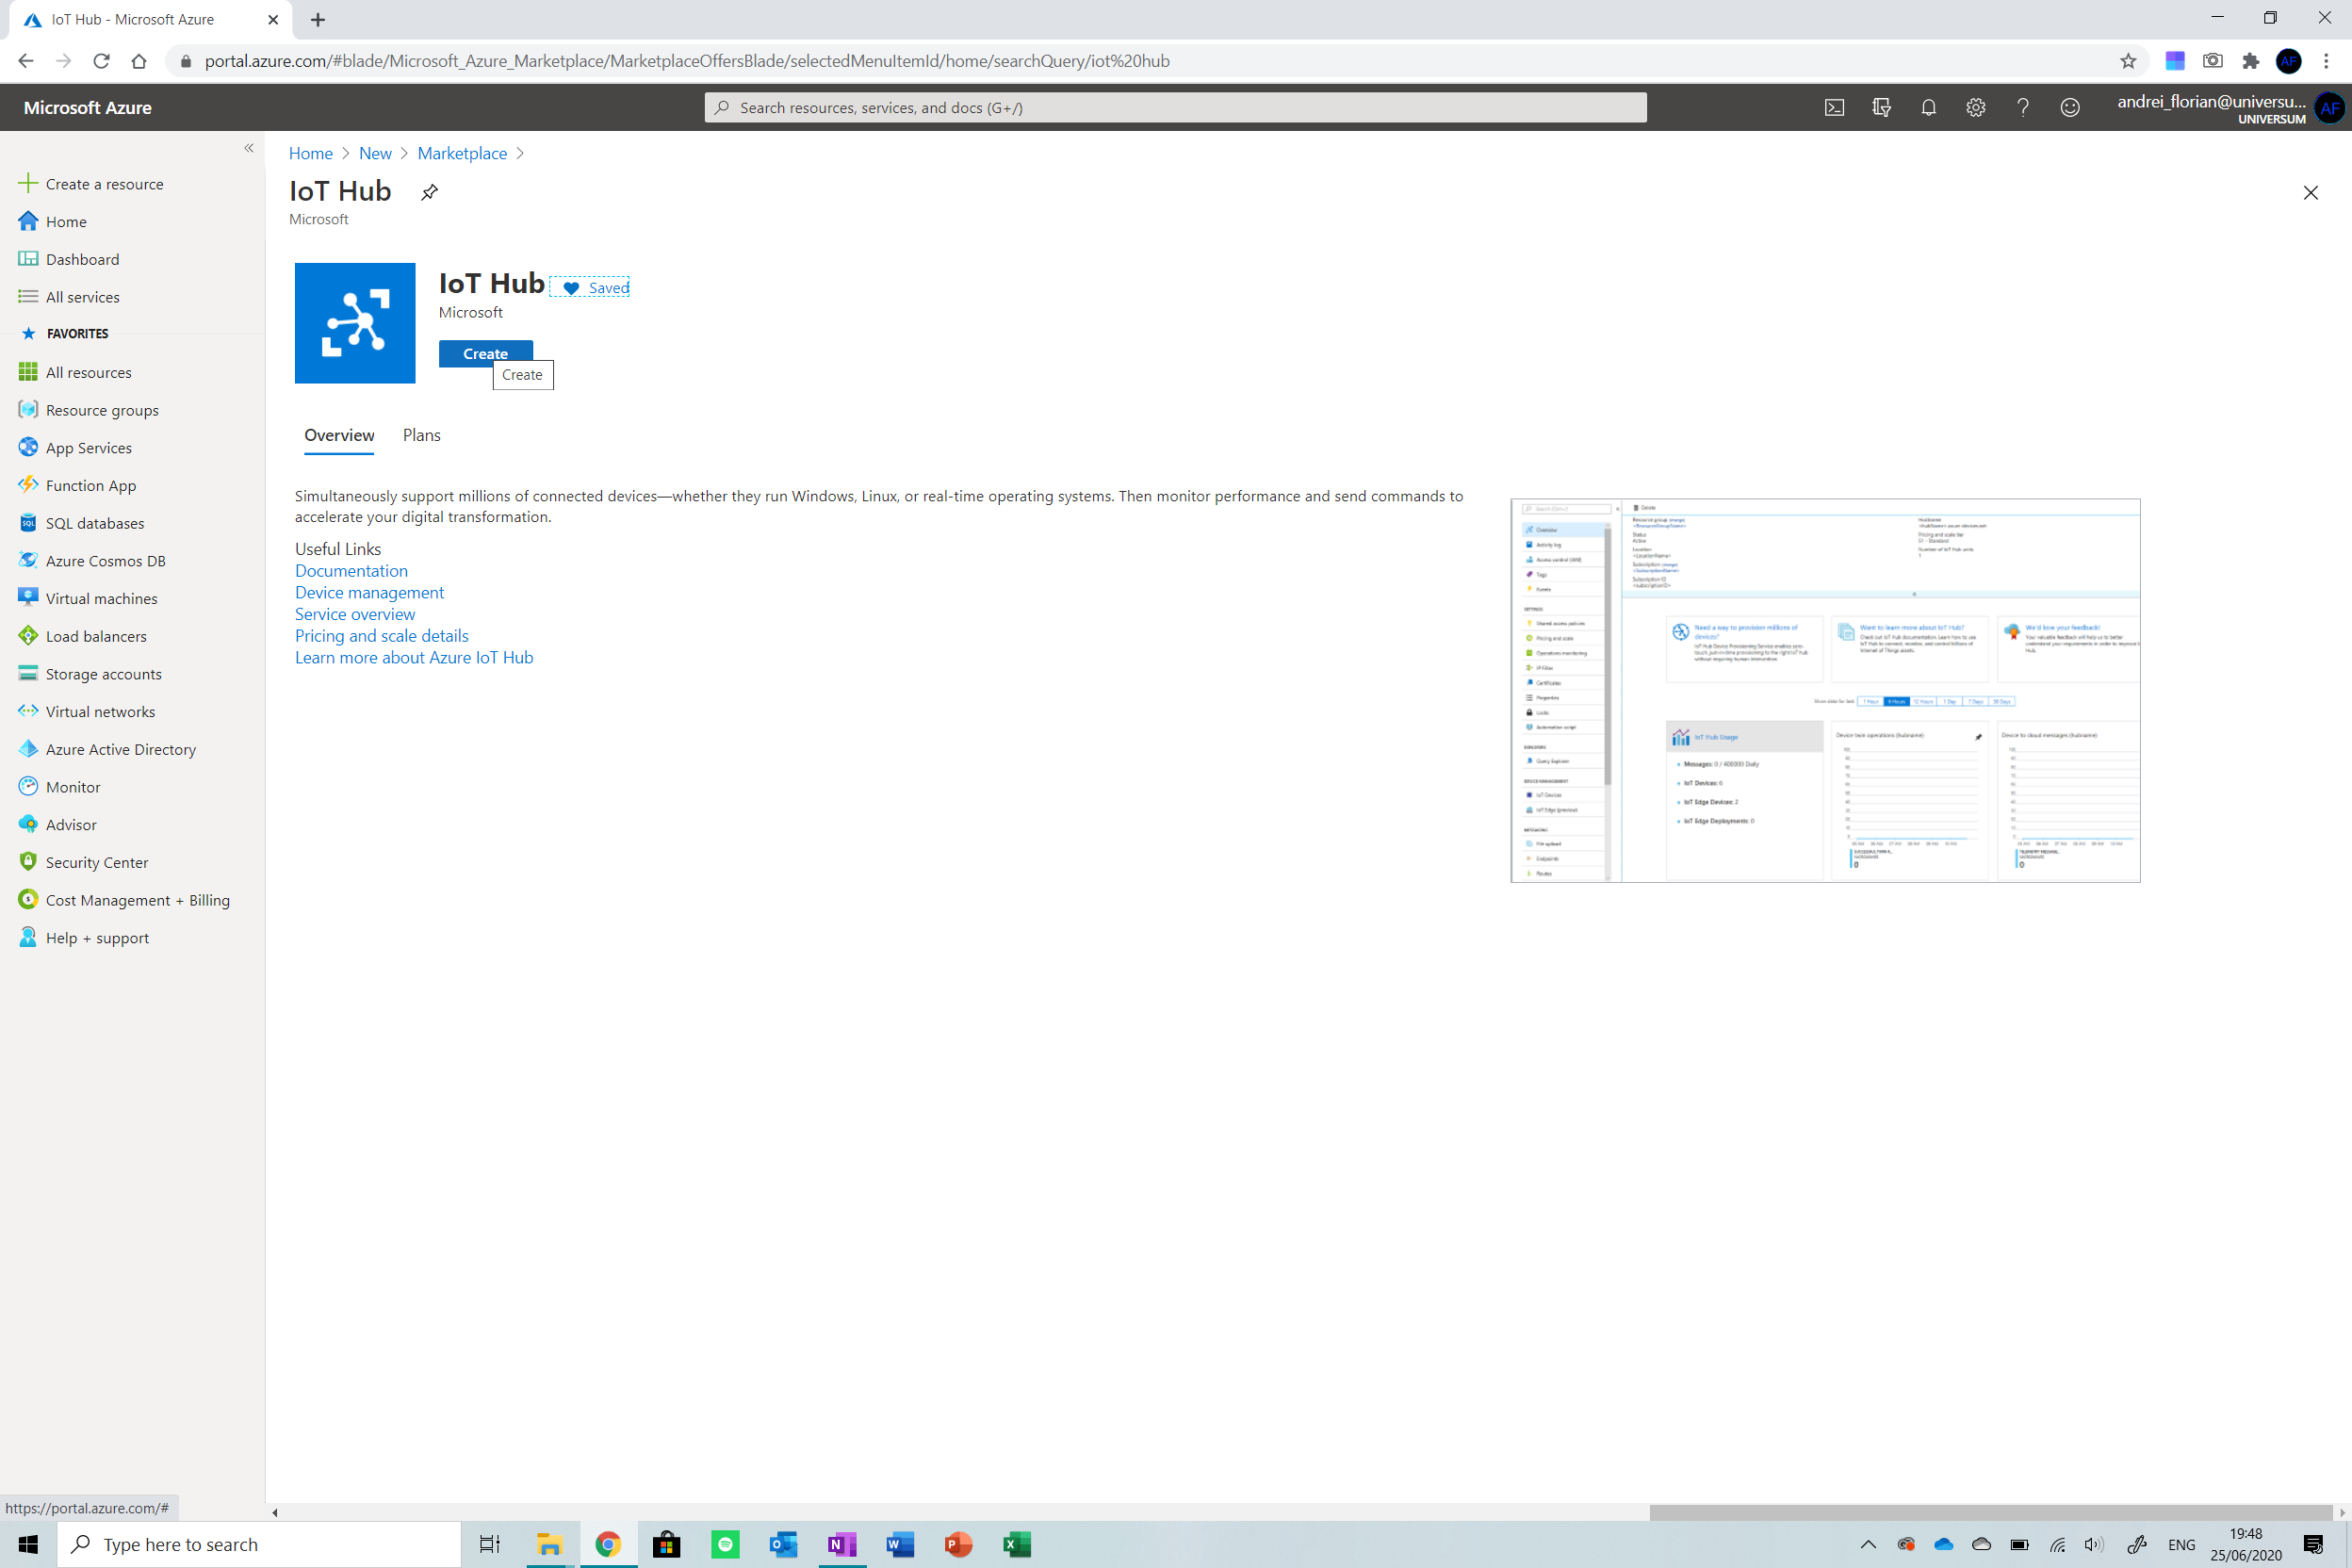
만들기를 클릭합니다. 설정이 완료된 후. 이 예에서는 무료 계층 IoT 허브를 사용합니다. 사용에 대한 비용이 청구되지 않도록 합니다. 이 솔루션을 배포하는 경우 S1으로 계층 변경을 고려 (또는 스케일에 따라 S2/S3).
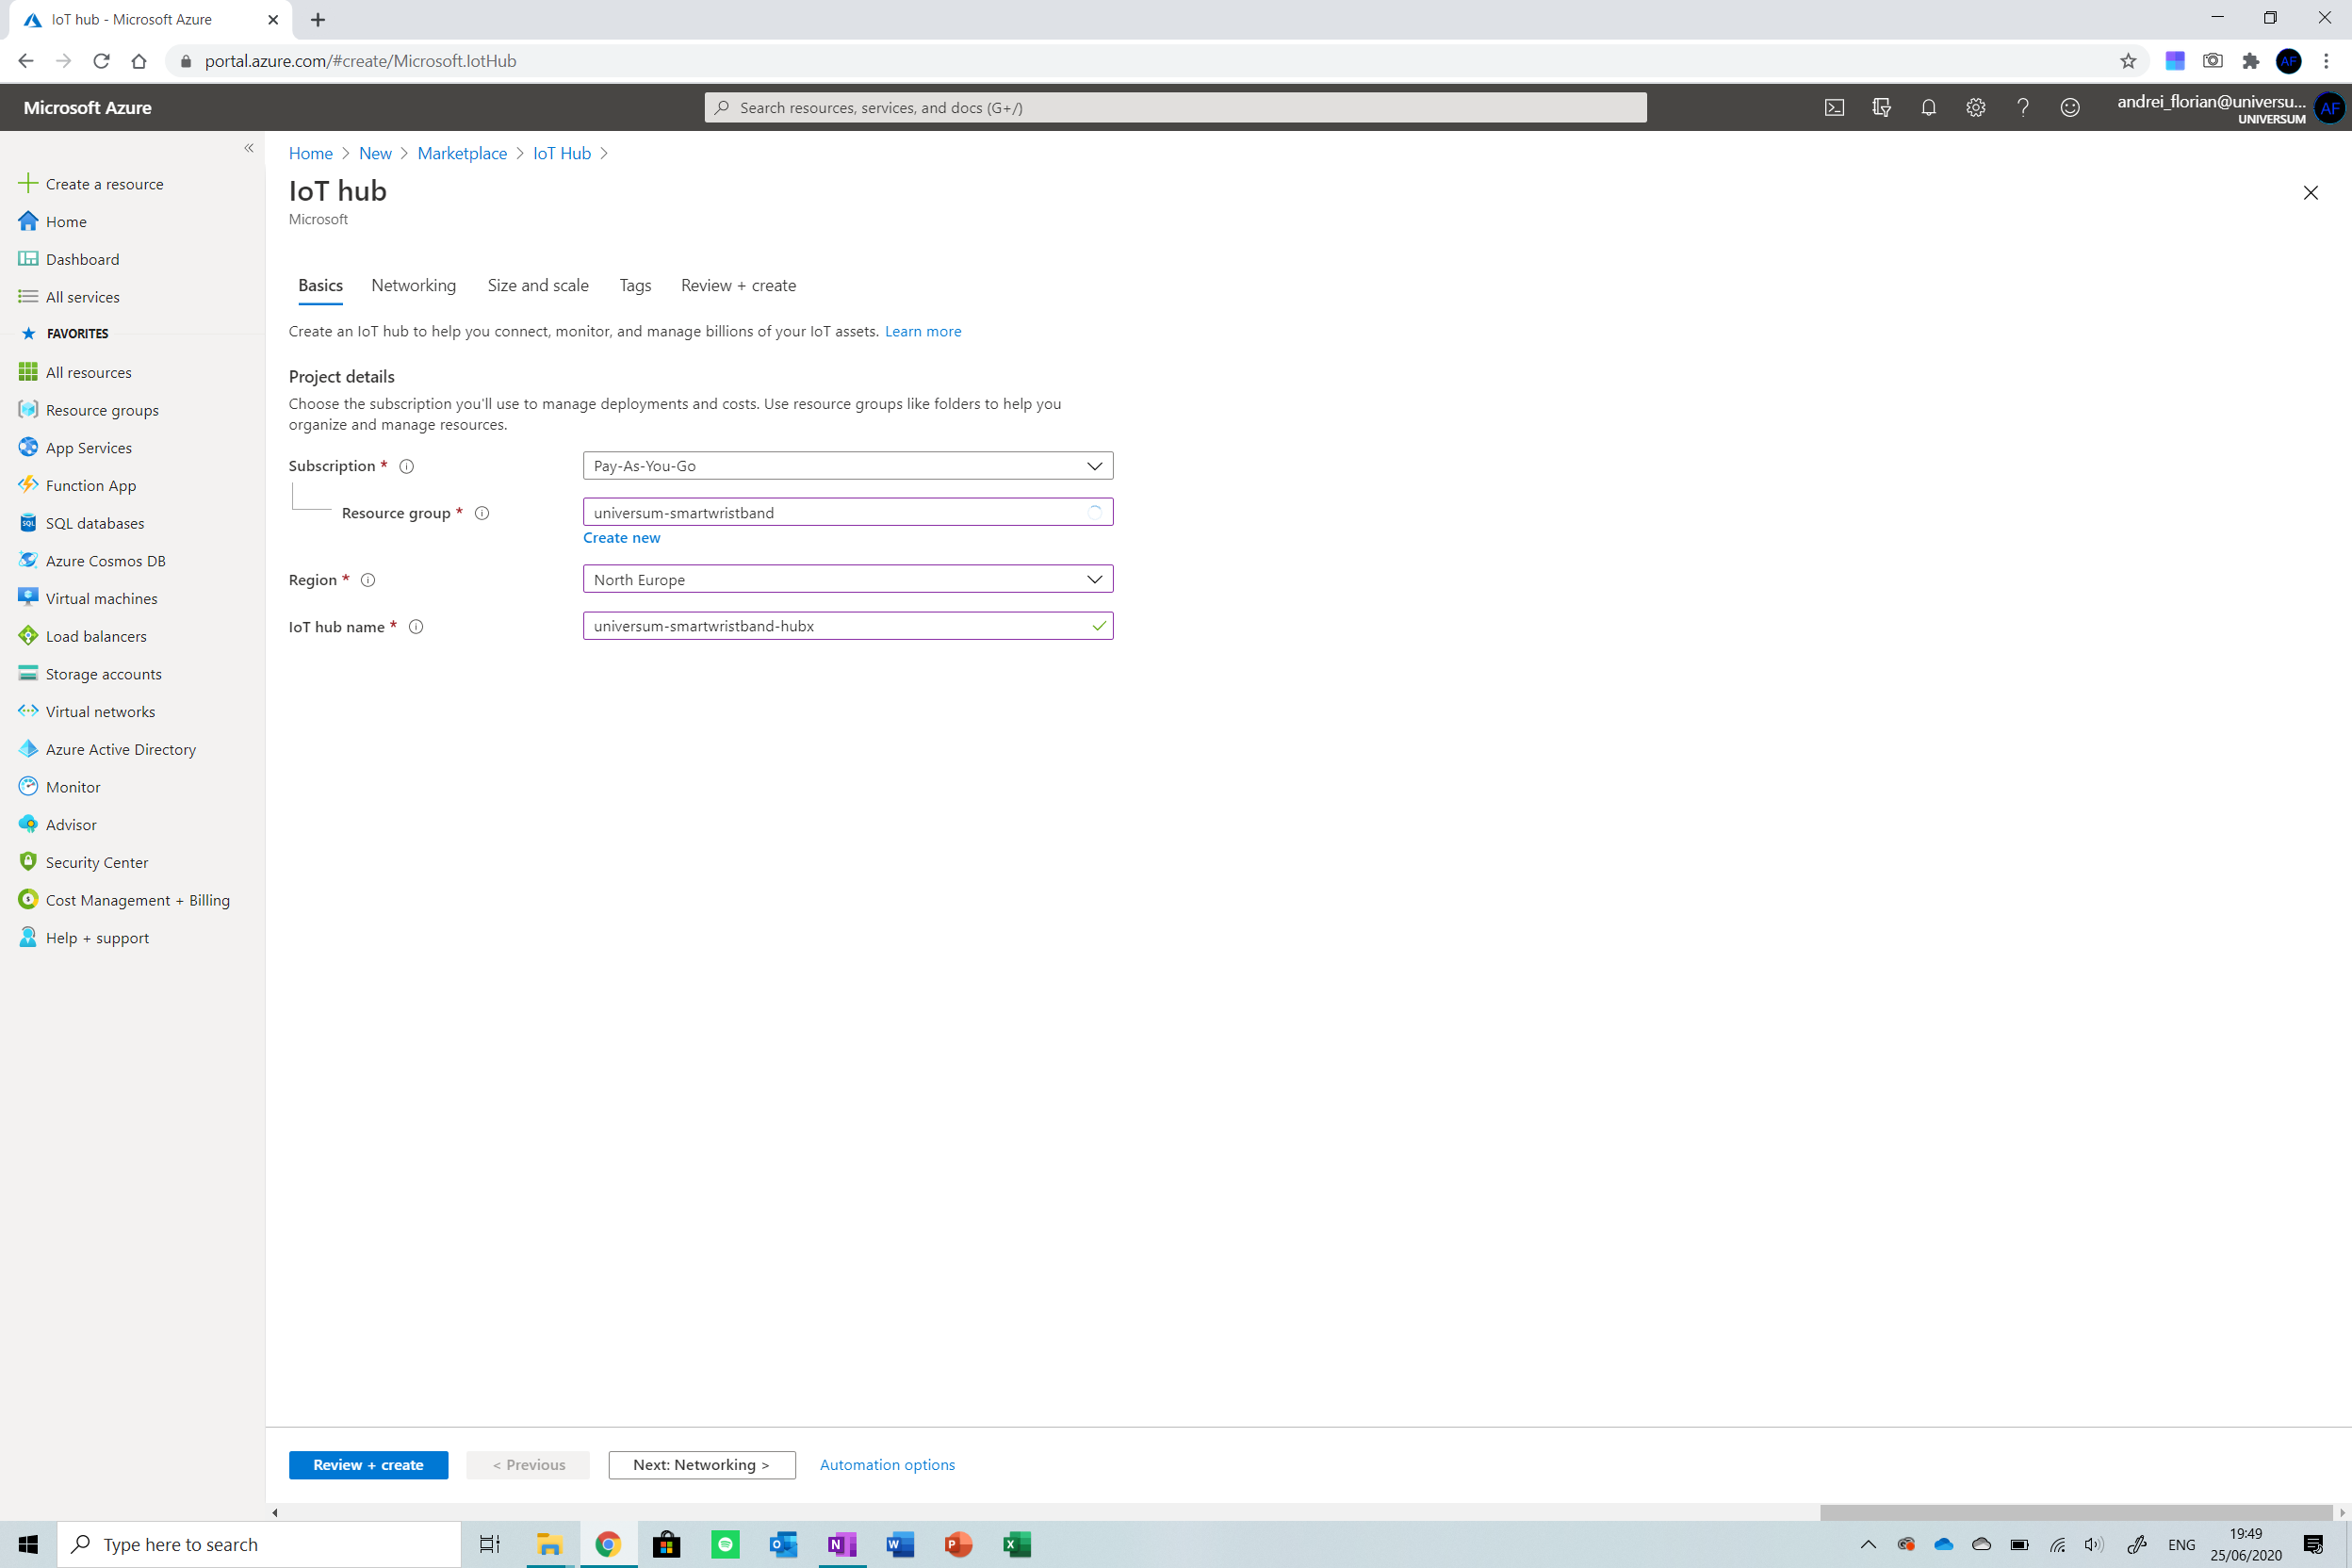
새 리소스 그룹을 만들고 IoT Hub의 이름을 지정합니다. 이제 크기 및 배율을 클릭하십시오. 위 단계에서 옵션을 선택합니다. 아래와 같이 설정되어 있는지 확인하세요.
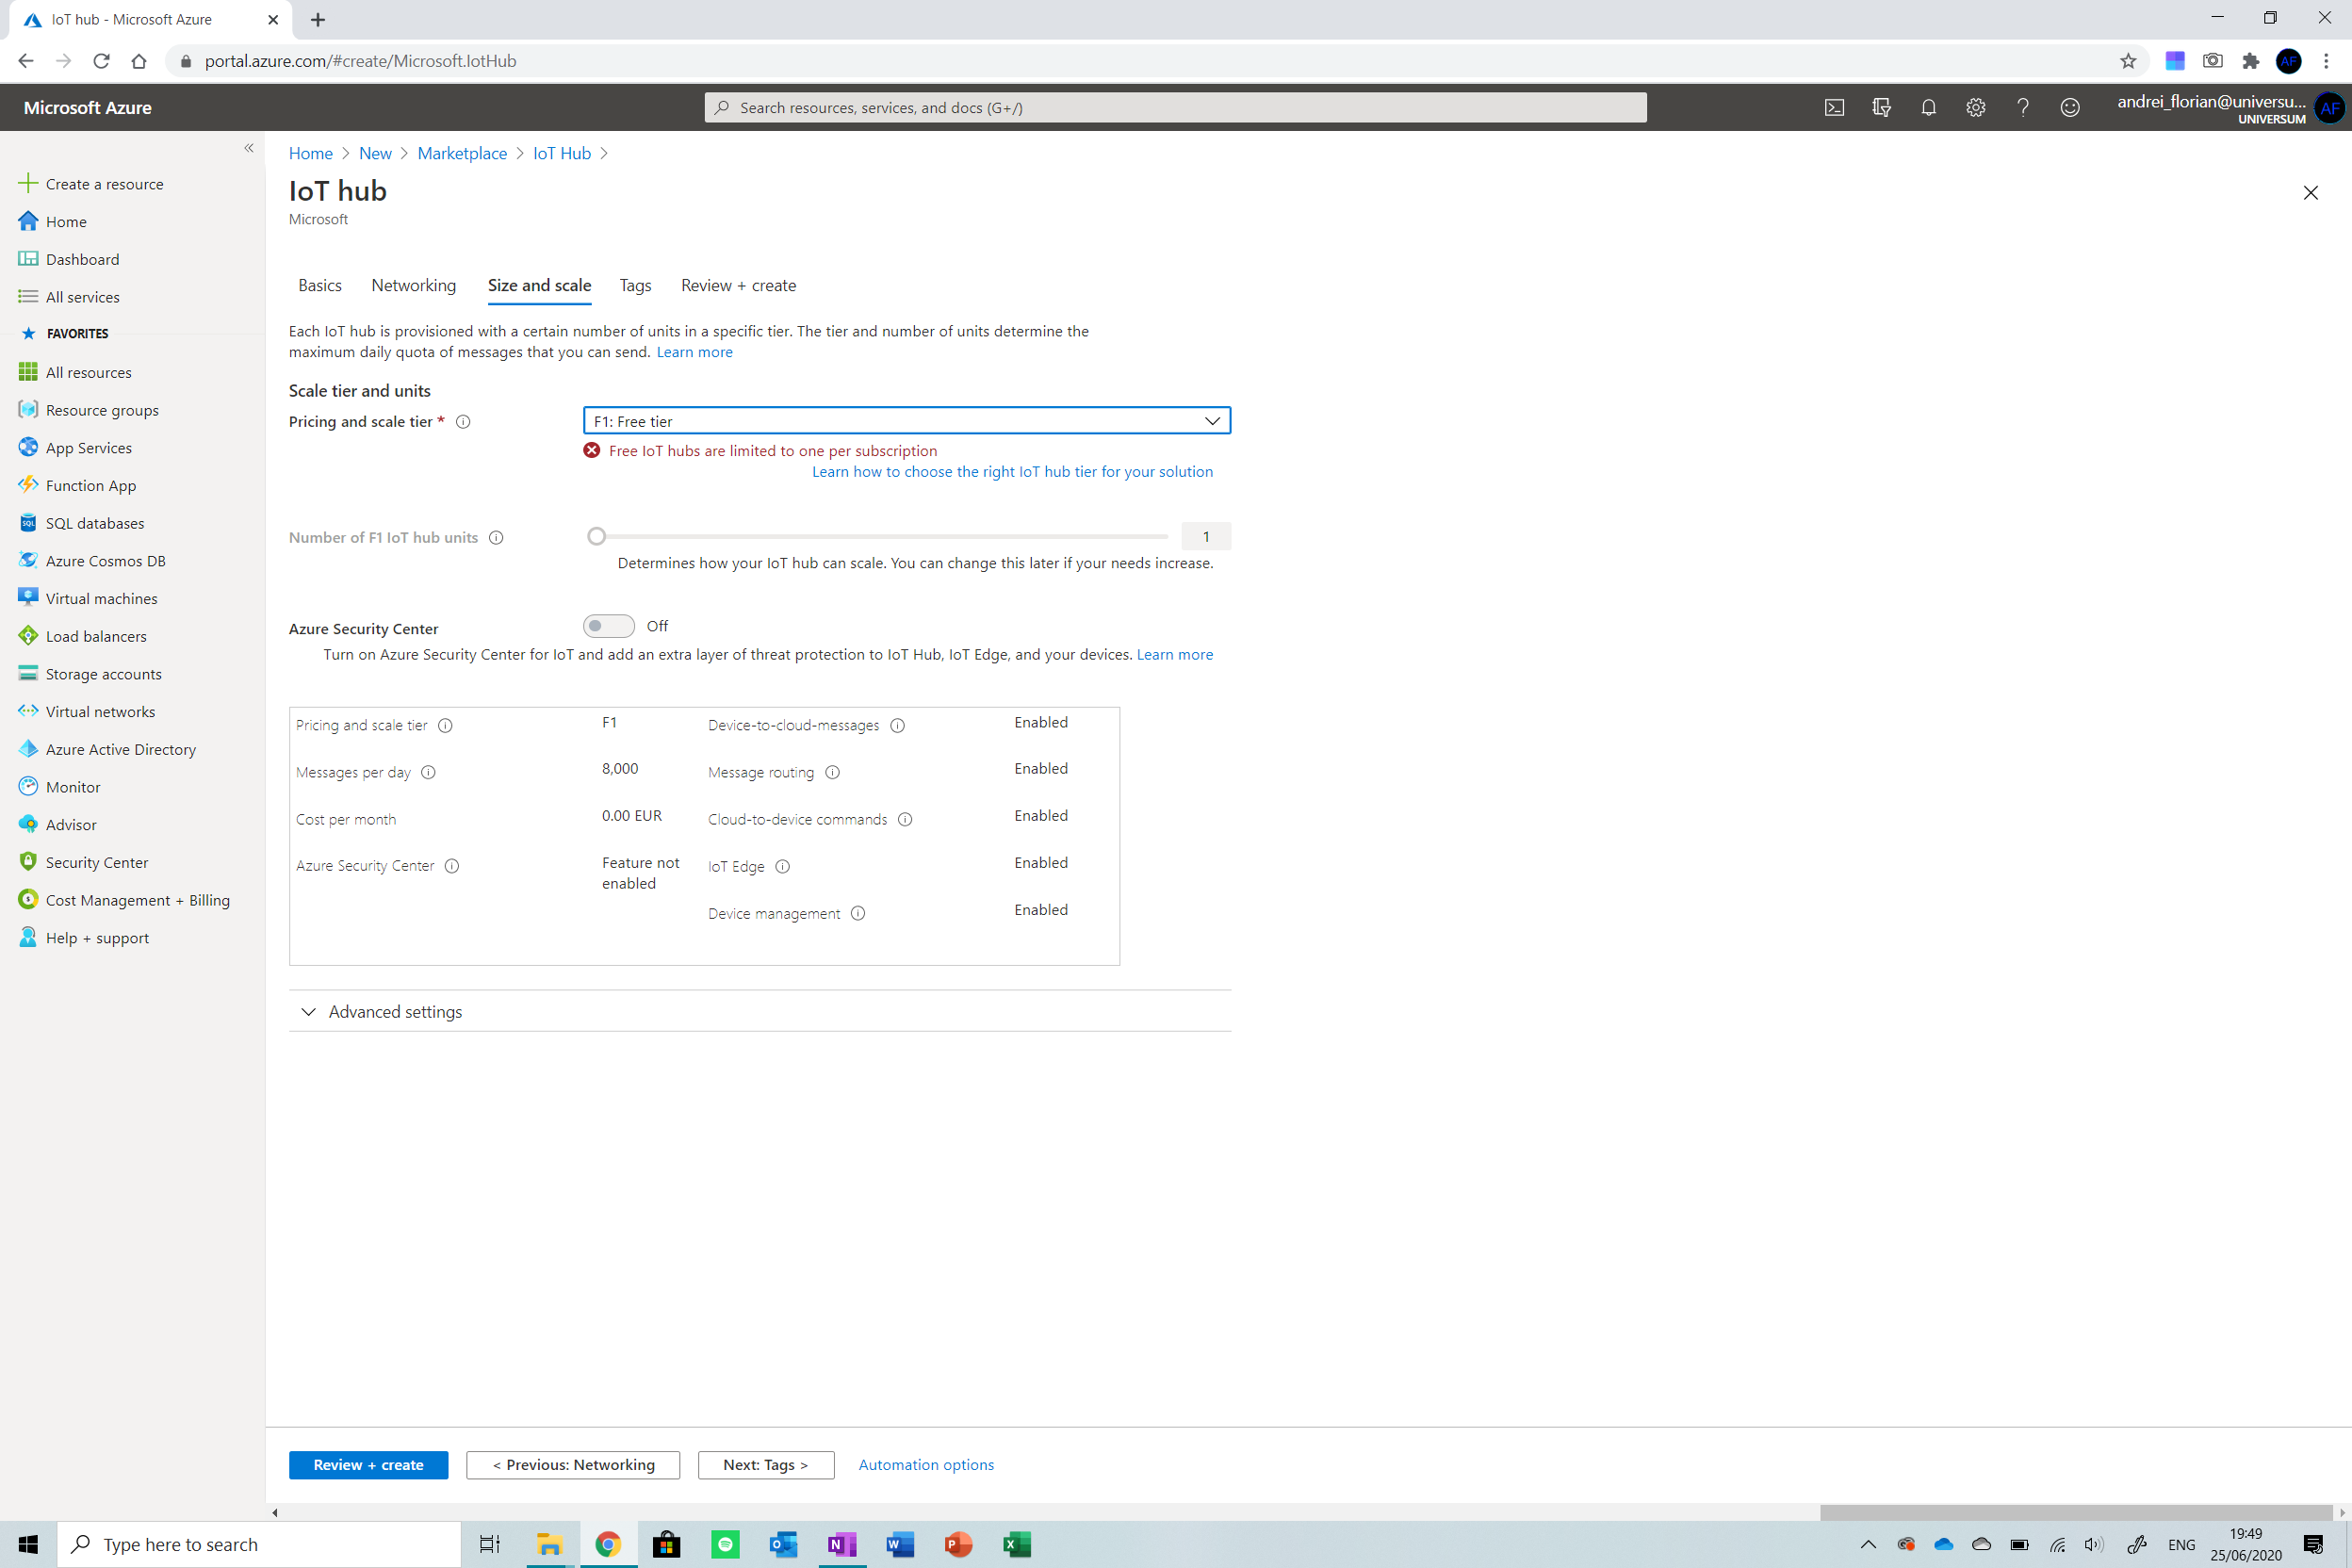
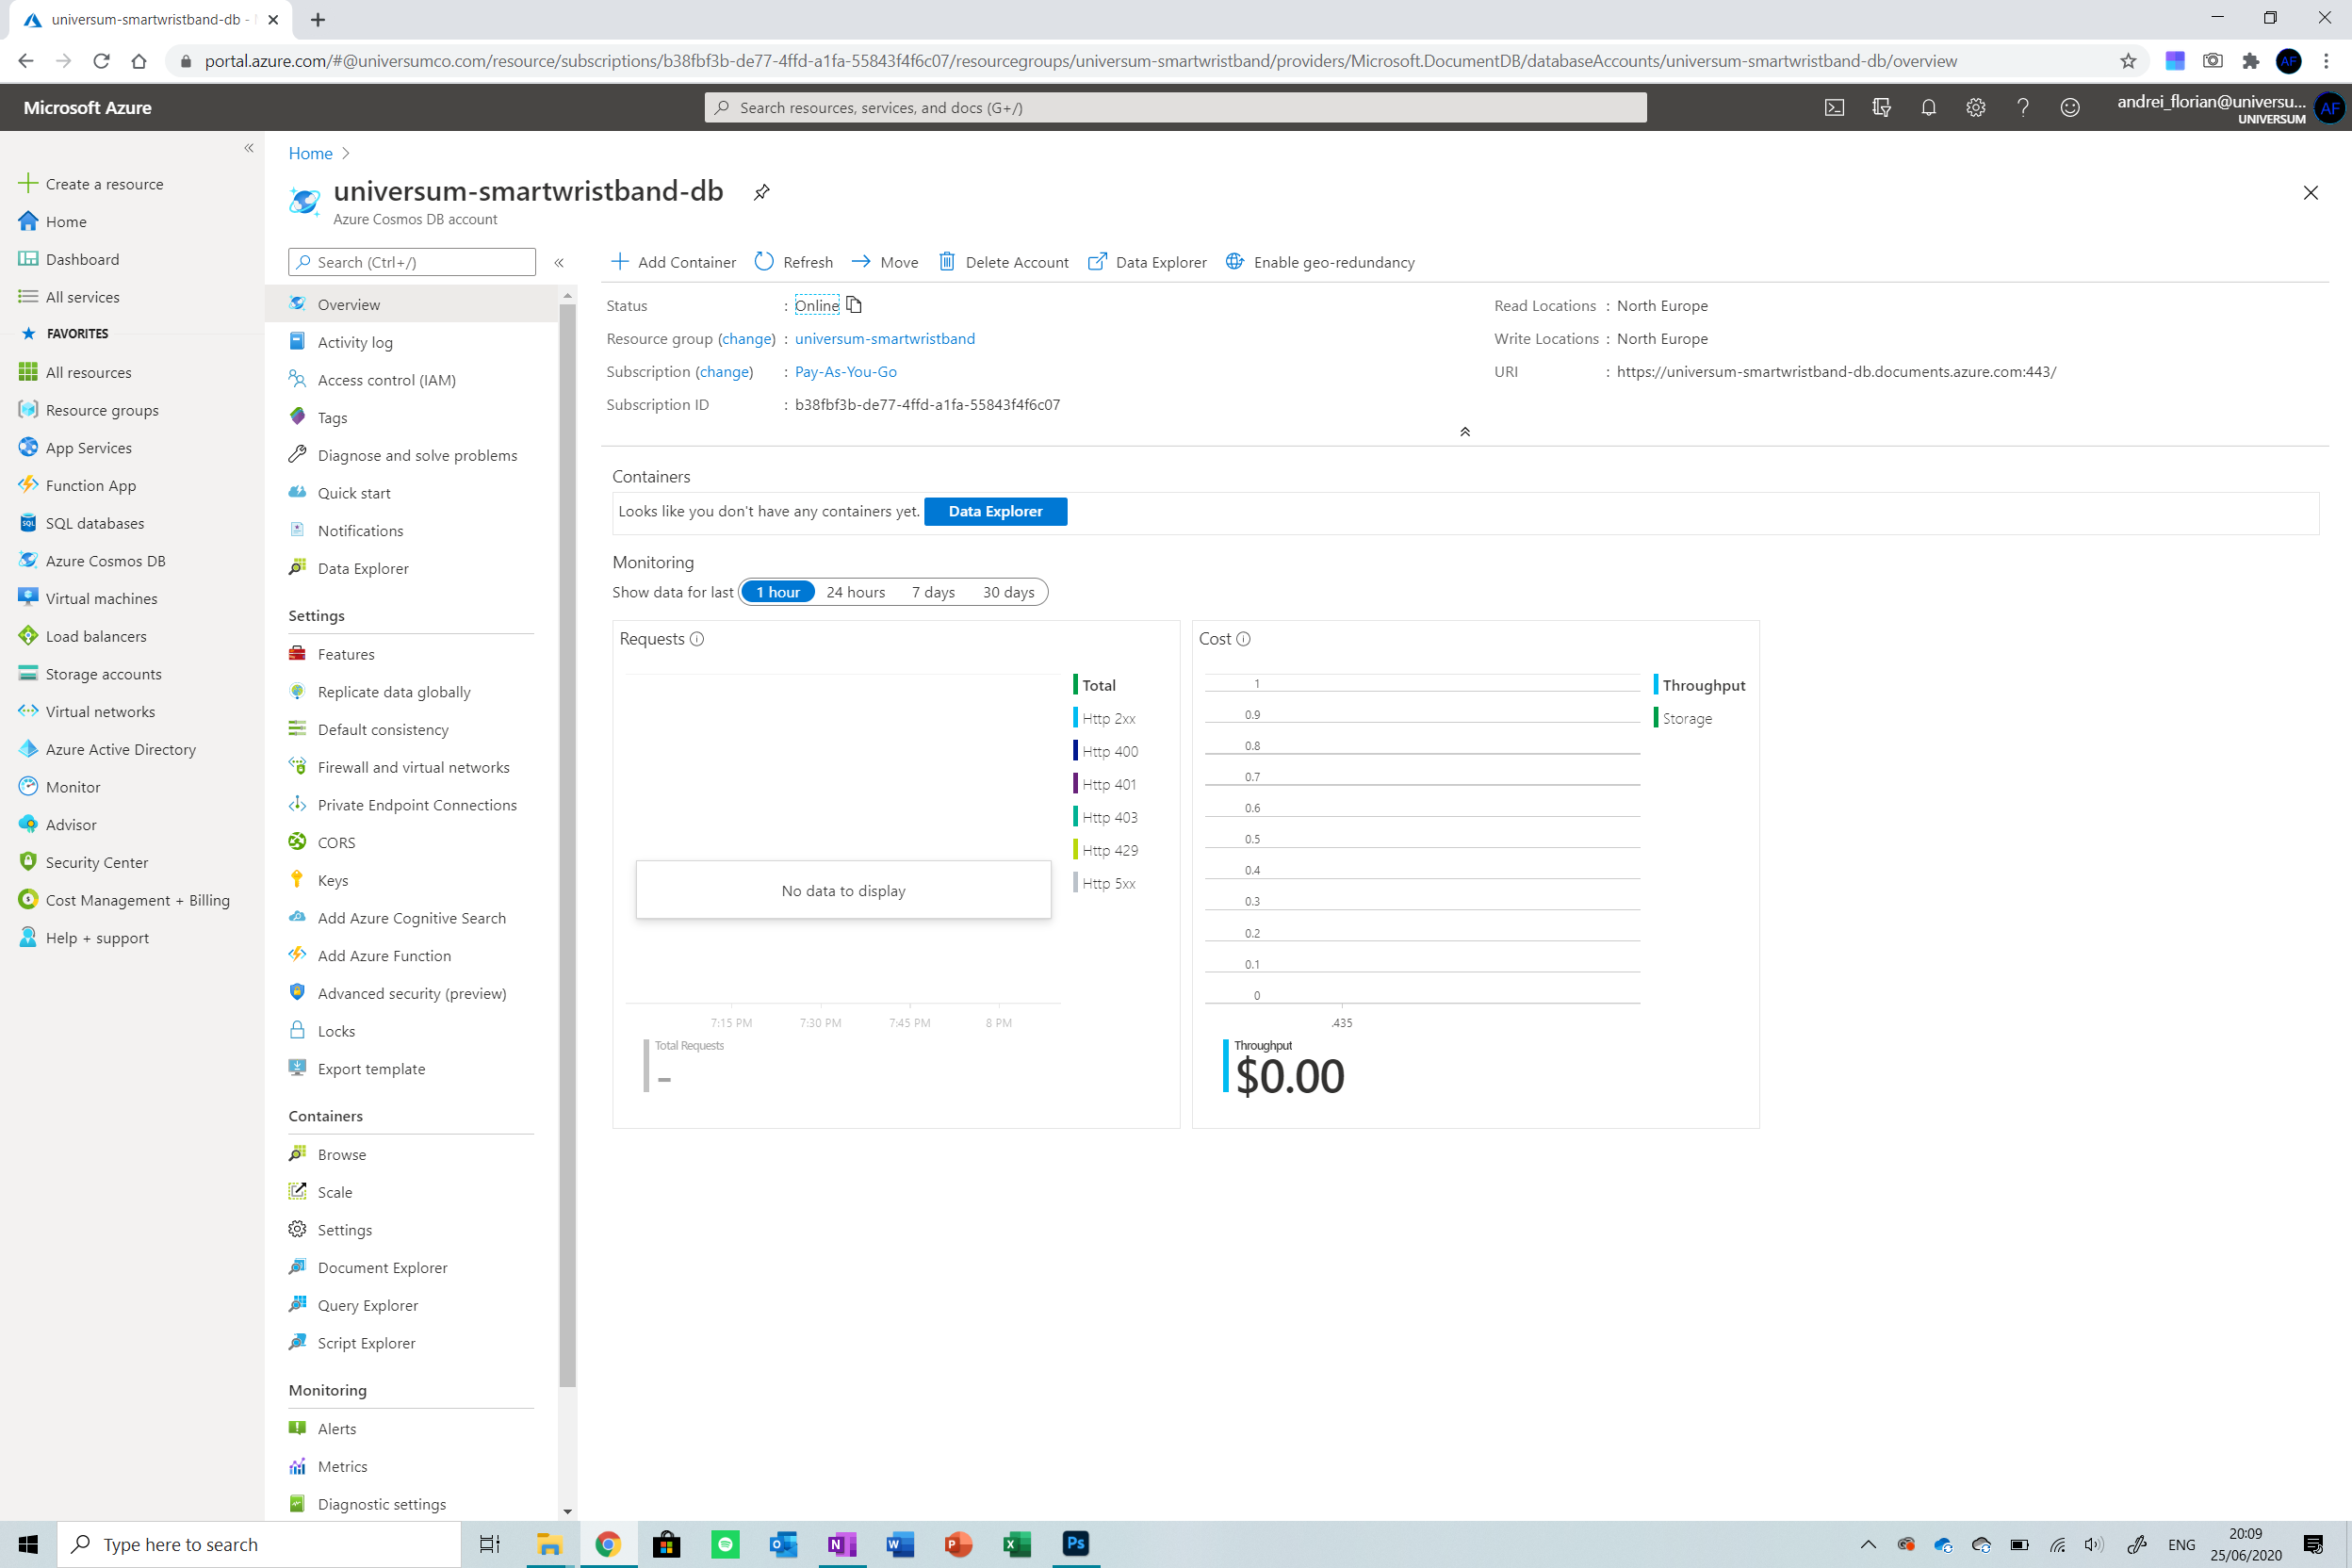
이제 검토 및 생성을 클릭하십시오. 리소스 배포 . IoT Hub가 생성될 때까지 기다렸다가 열기 모든 리소스를 클릭하여 화면 오른쪽 메뉴에서.
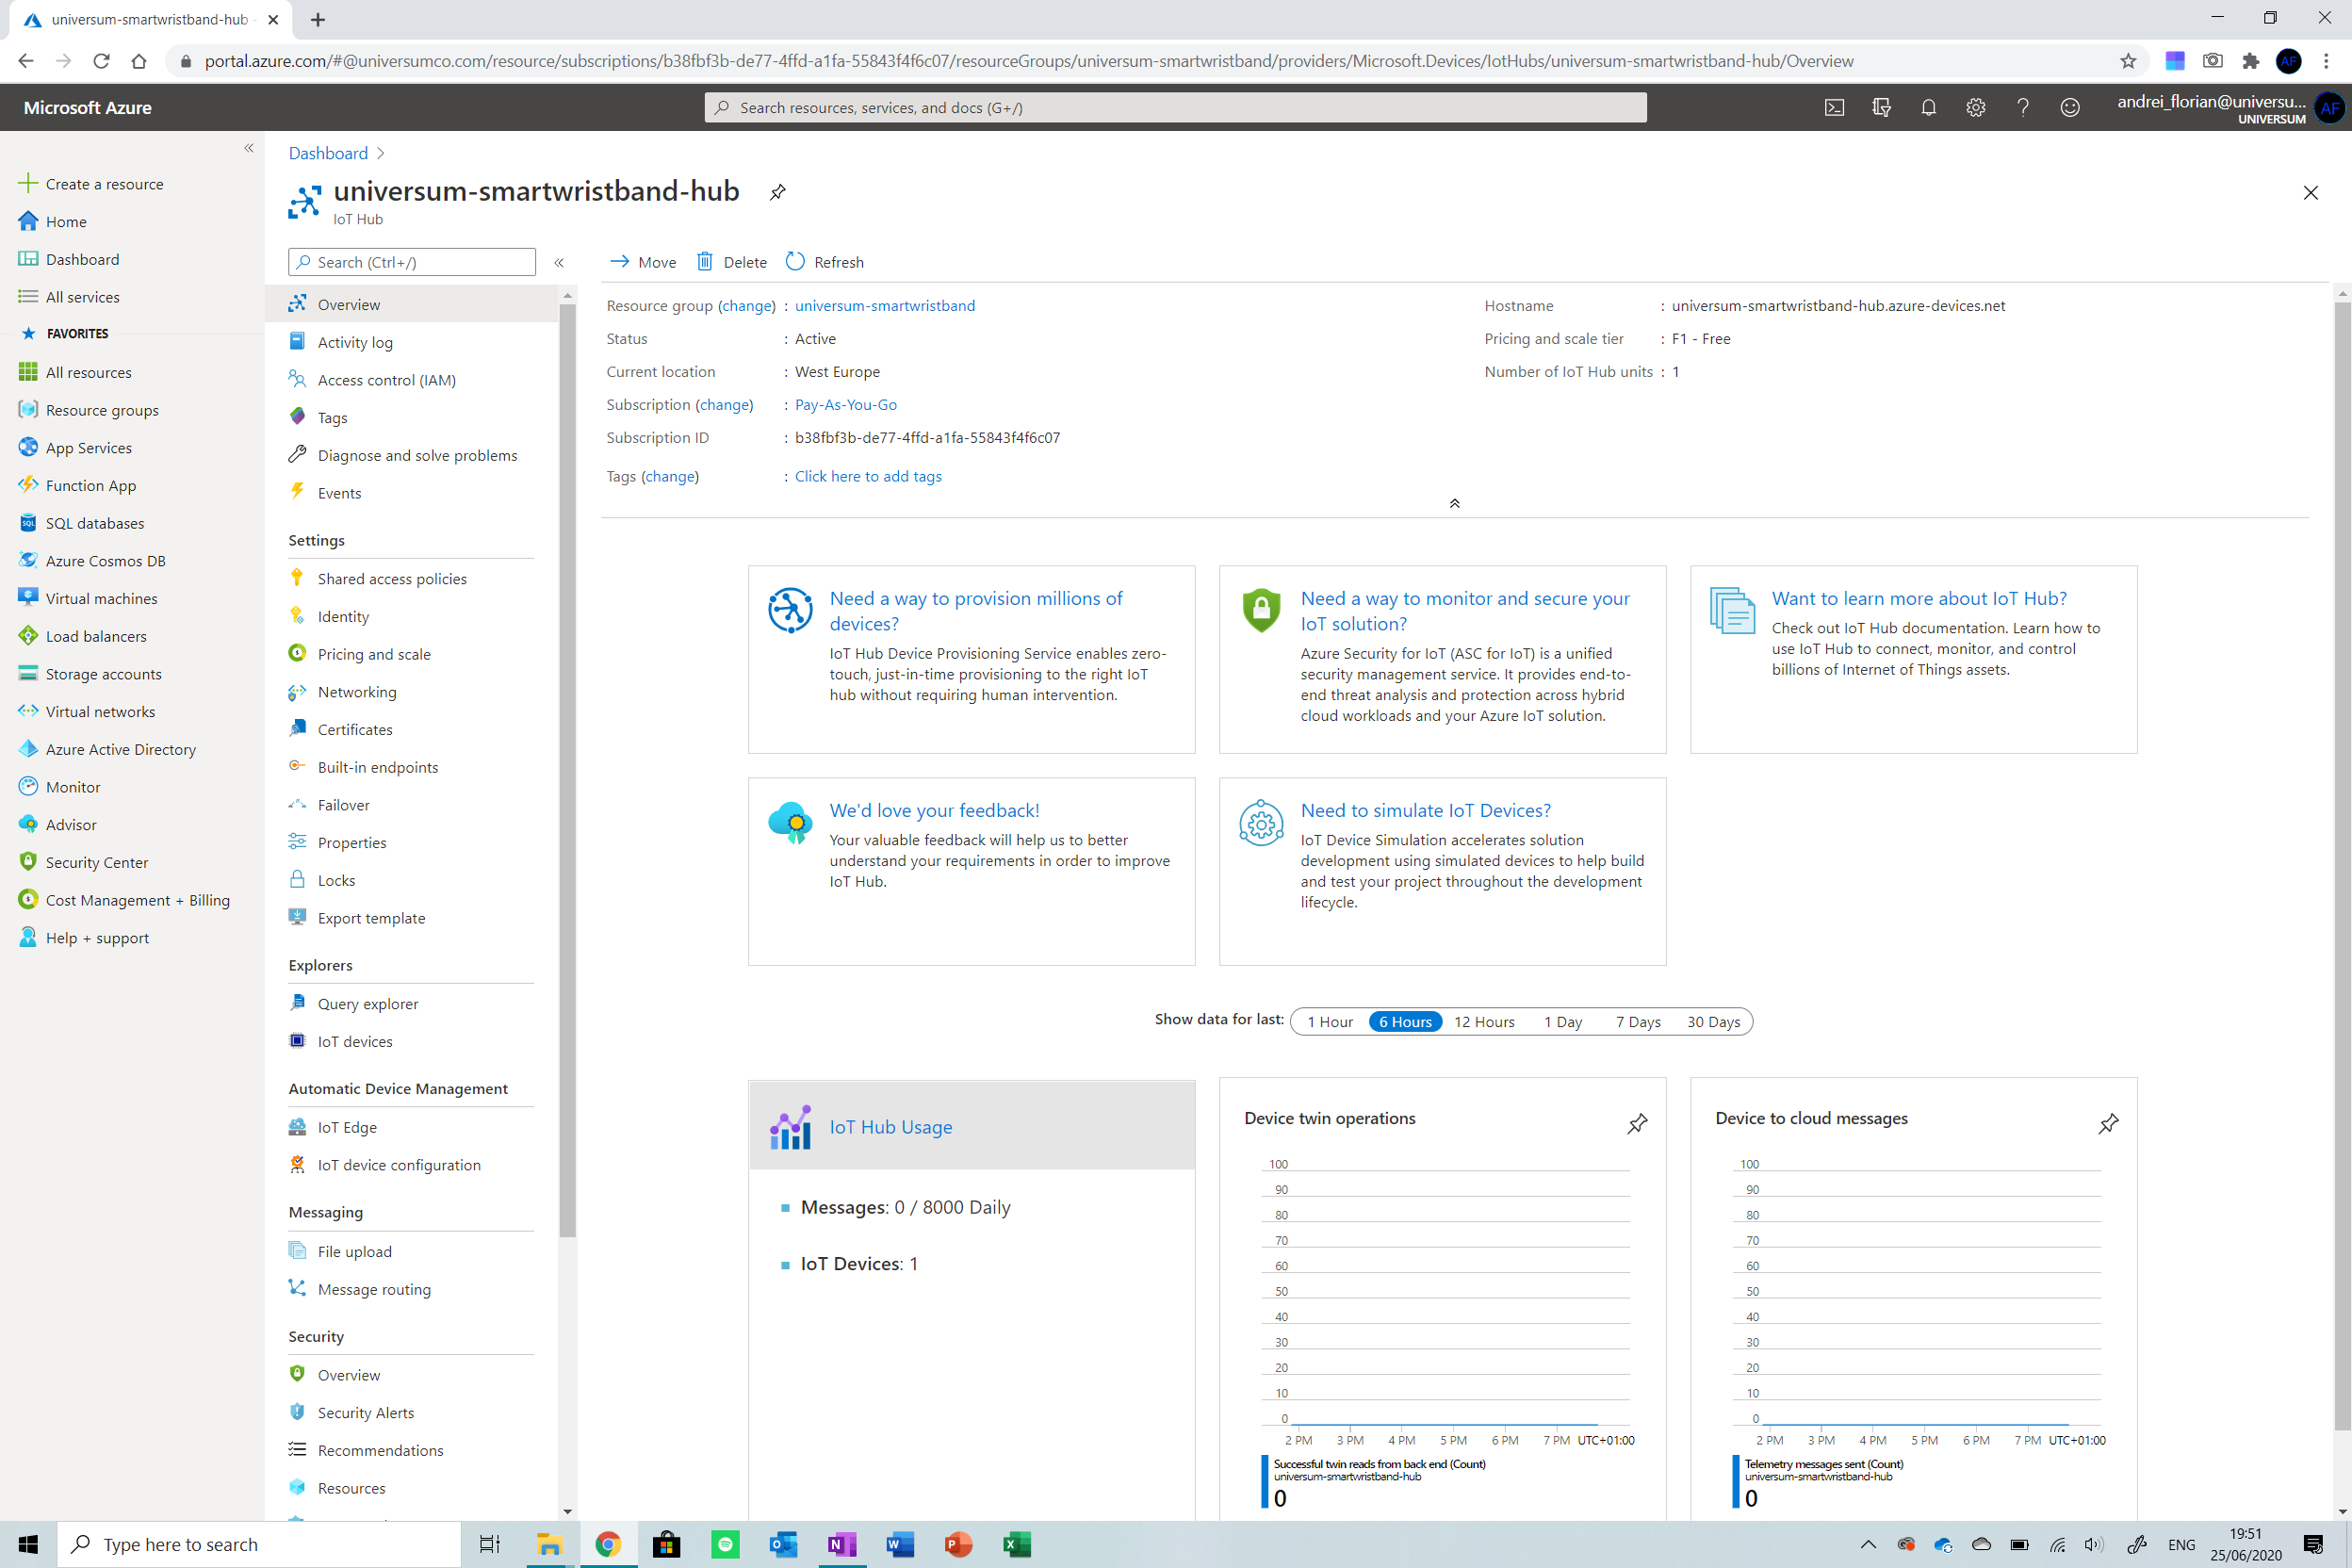
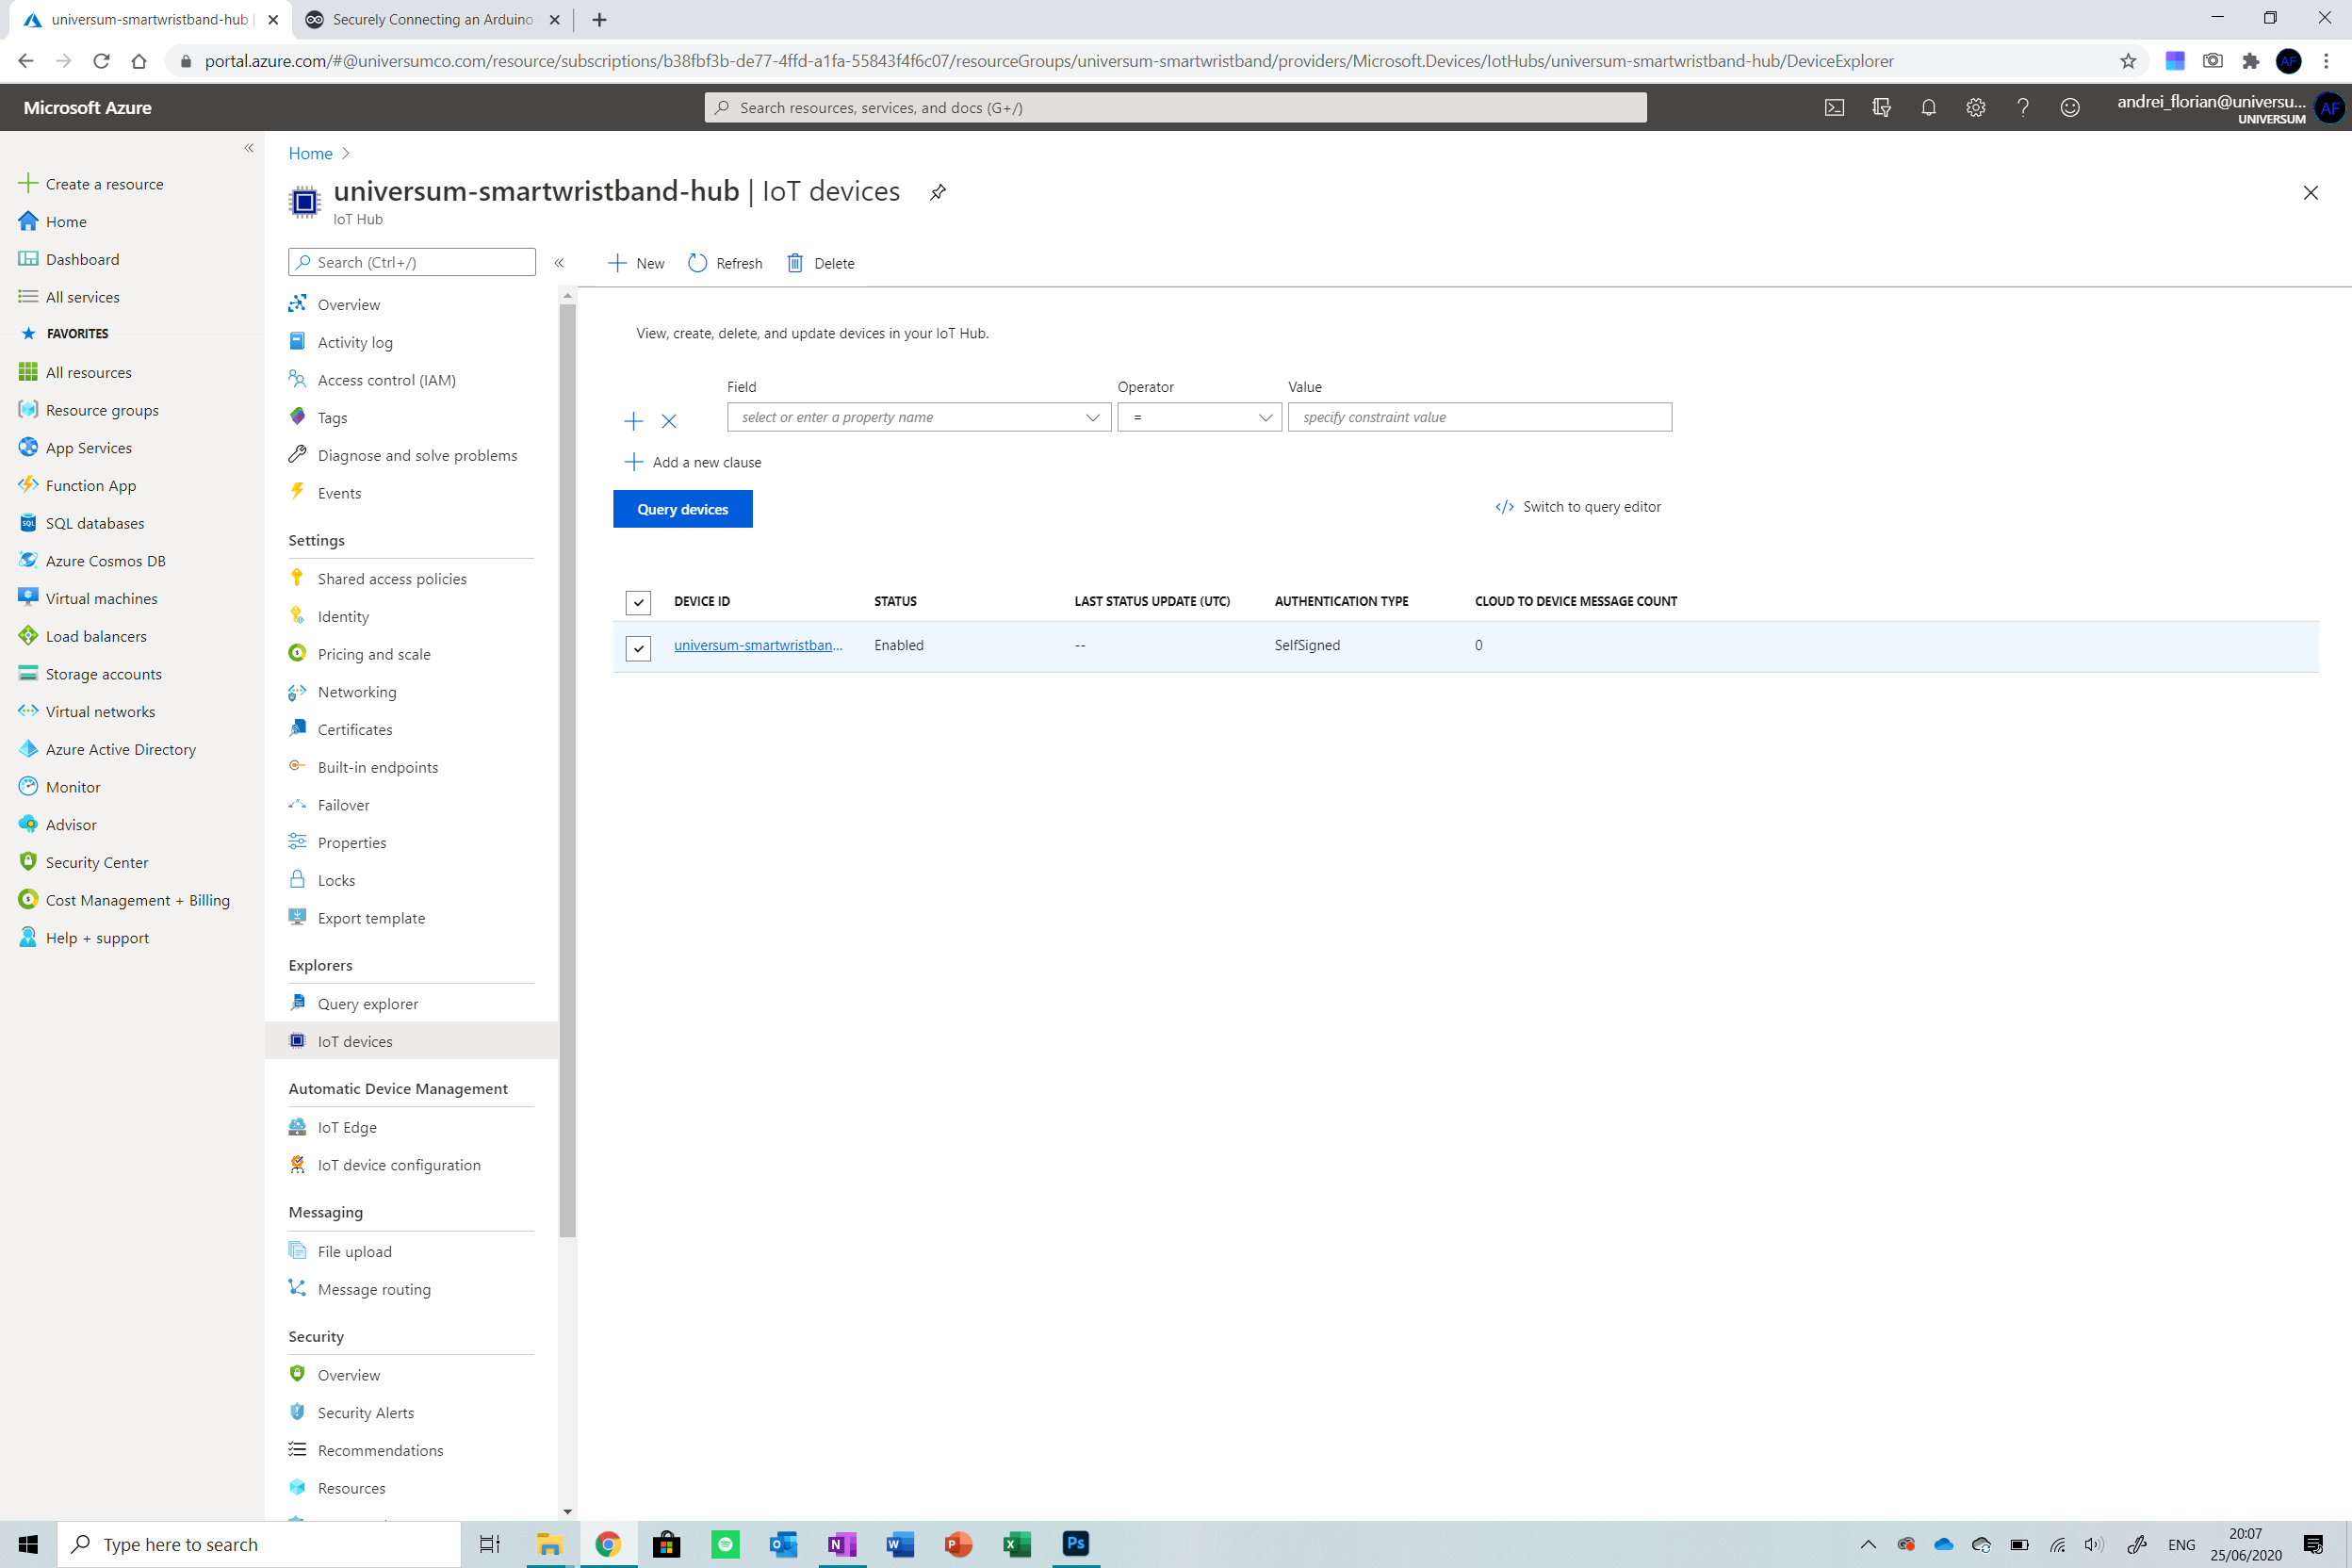
이제 기기를 생성해야 합니다. IoT Hub에 연결합니다. IoT 기기로 이동합니다. 화면 오른쪽 메뉴에서 옵션을 선택하고 옵션을 클릭합니다. 새로 만들기 를 클릭하십시오. 새 기기 추가 버튼 IoT 허브에. 다음 자격 증명을 입력하십시오.
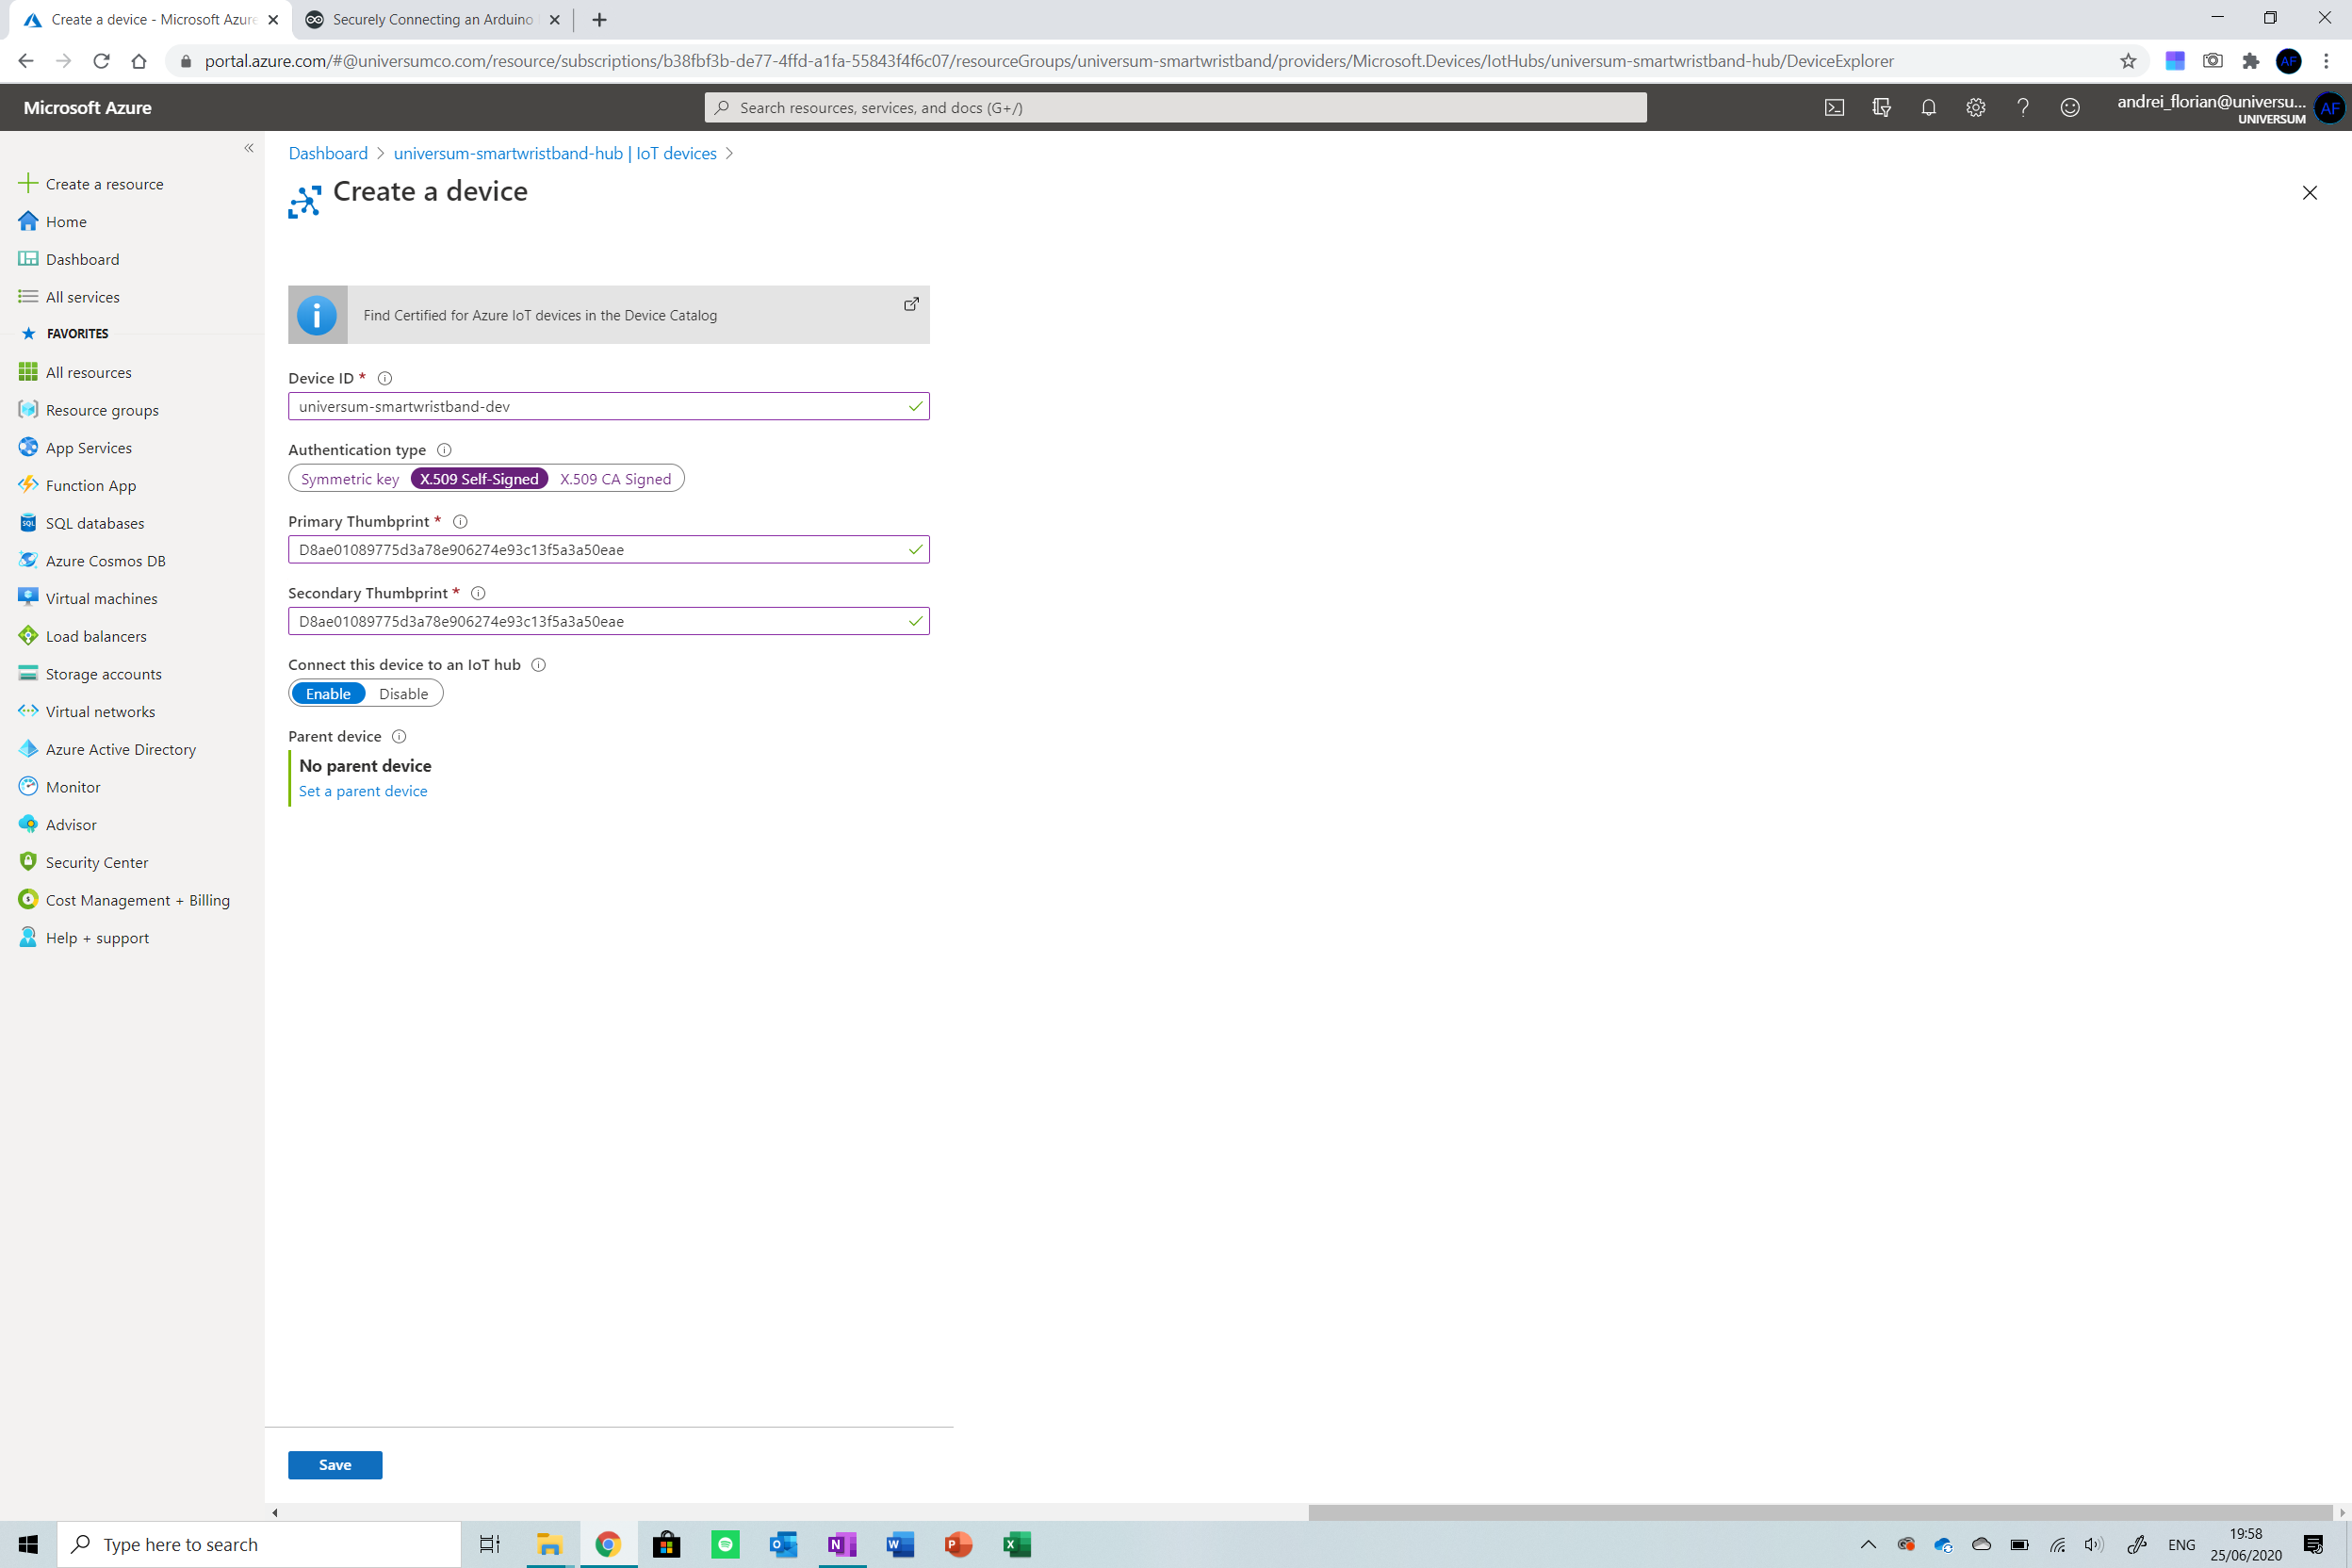
기본 지문과 보조 지문을 SHA1 값으로 교체해야 합니다. 두 번째 단계에서 추출됩니다.
저장을 클릭하면 준비가 완료됩니다!
5단계:Cosmos DB 데이터베이스 생성
이제 장치에서 보낸 데이터가 저장될 데이터베이스를 만들어야 합니다. Azure의 Cosmos DB를 사용하고 있습니다. JSON 파일 저장에 익숙 이것은 우리가 기기에서 보내는 것입니다.
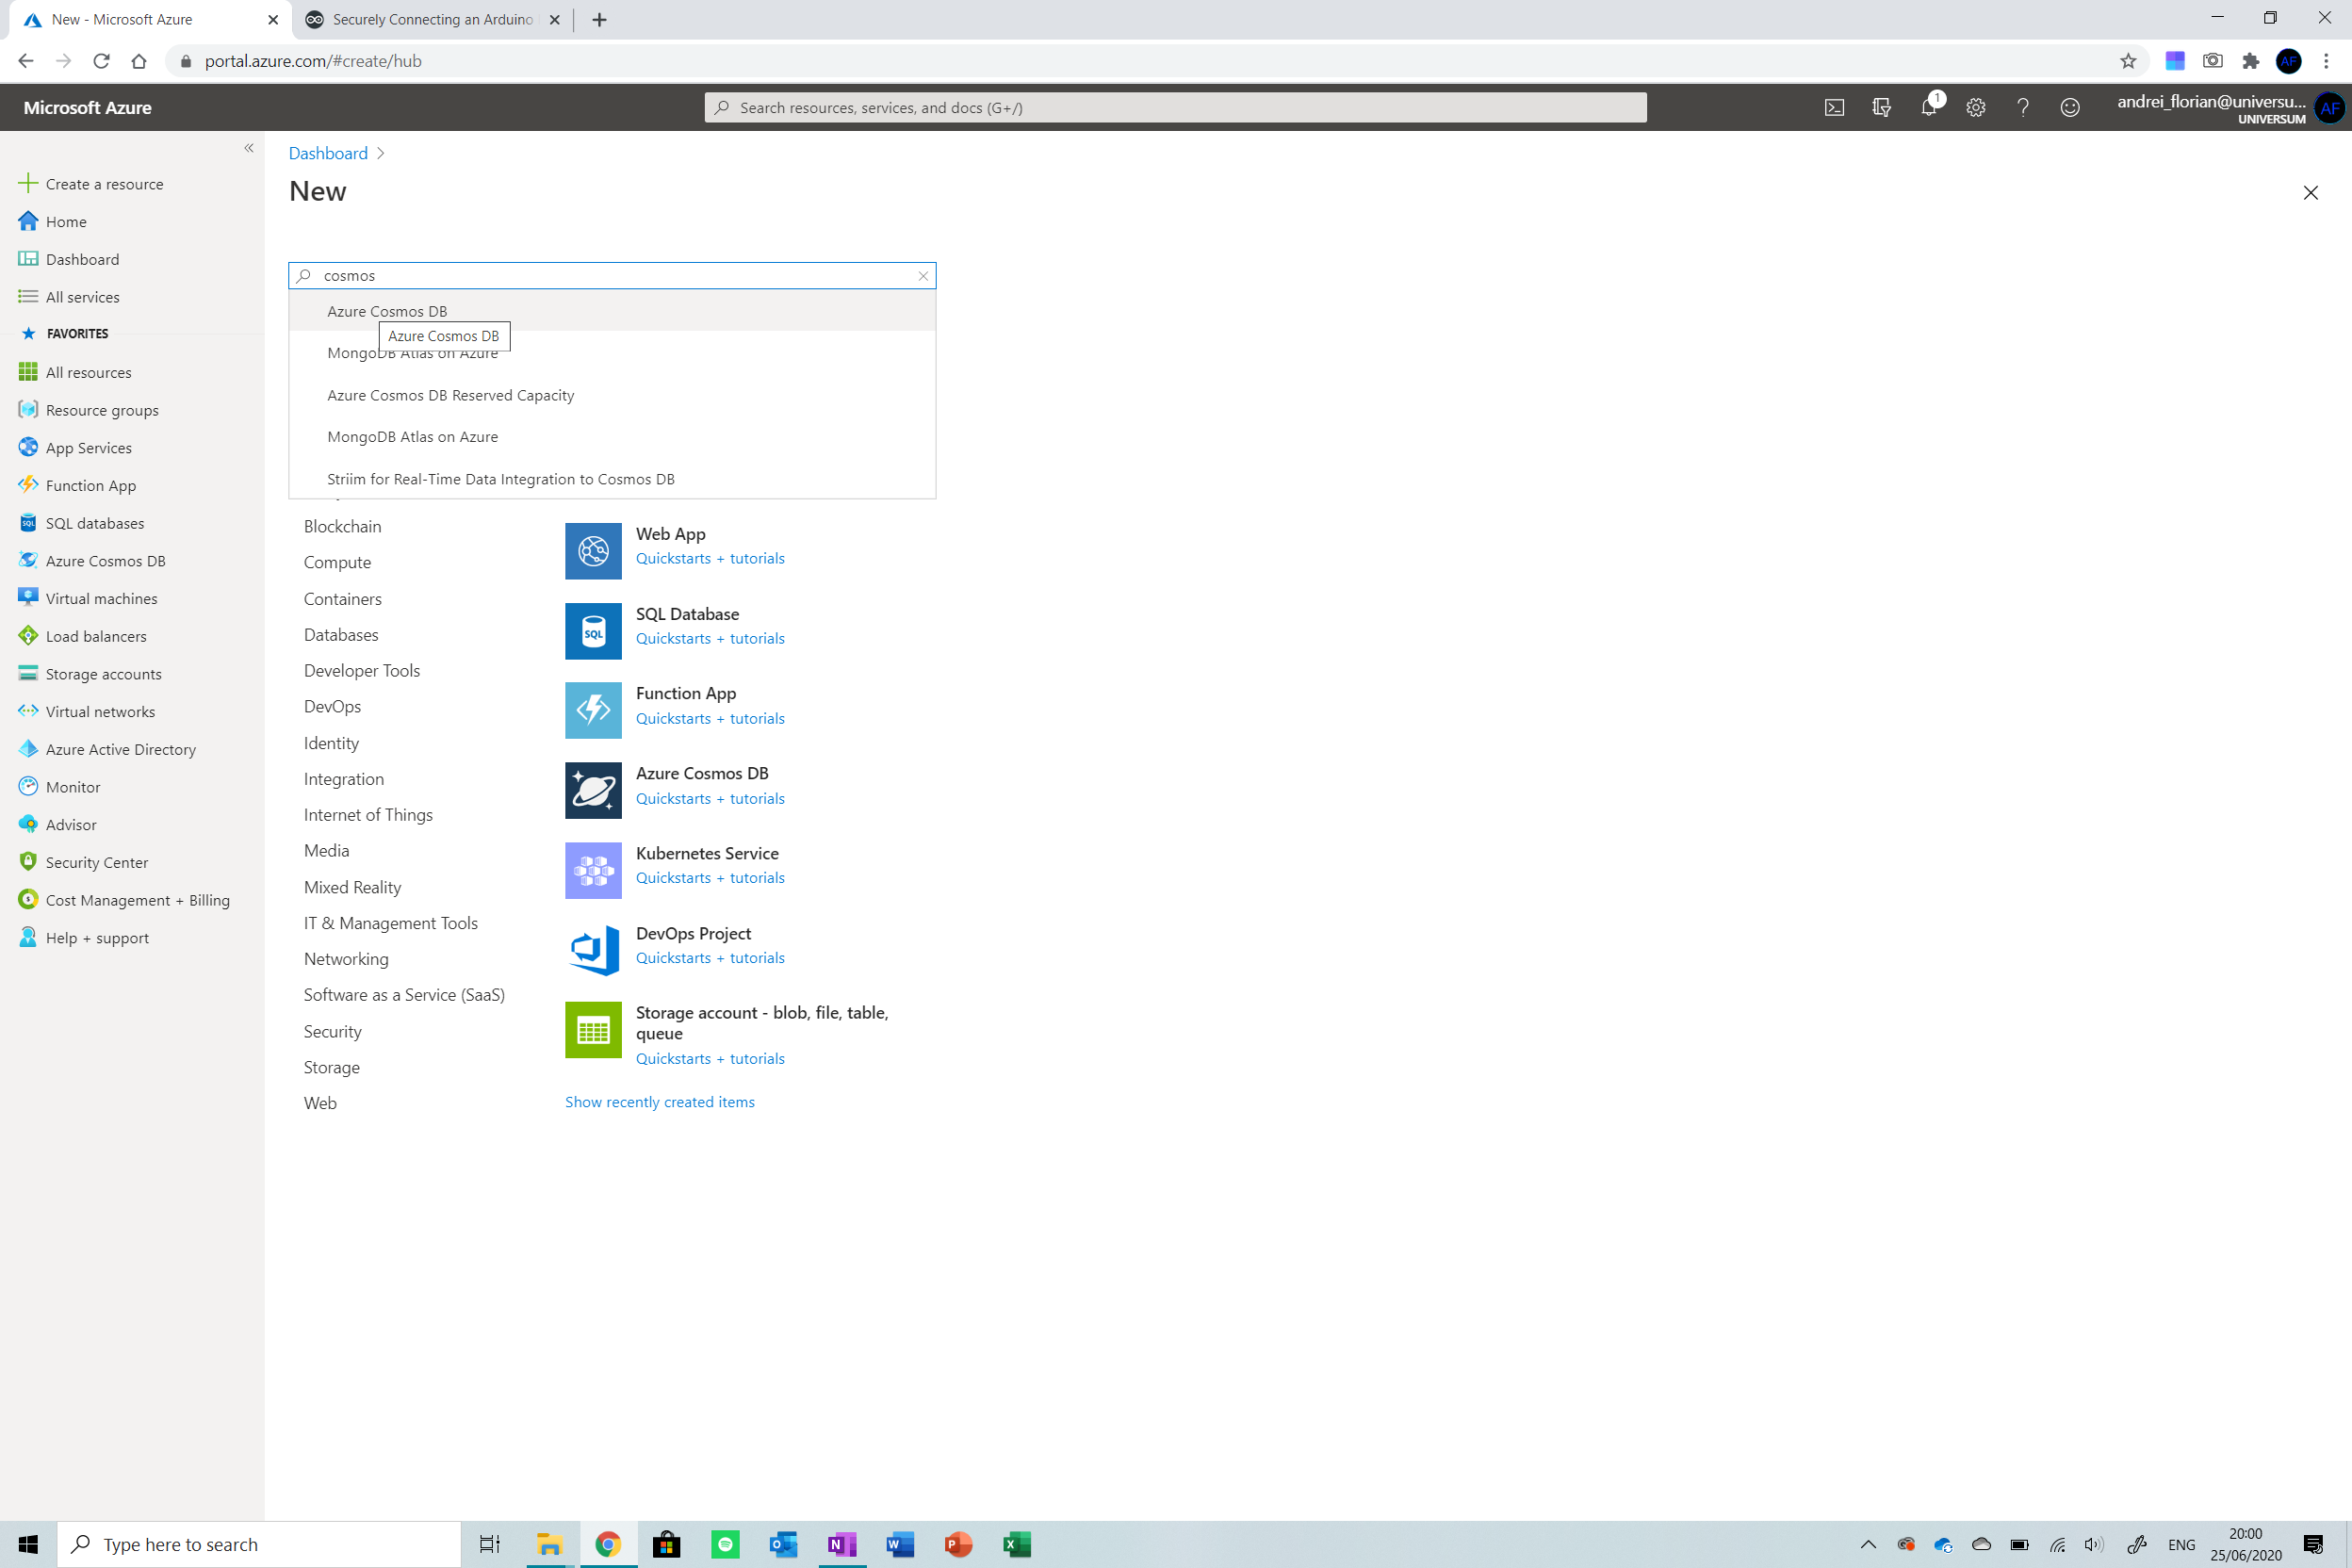
먼저 리소스 만들기 버튼 으로 돌아가십시오. 오른쪽 메뉴에서 클릭하세요. Cosmos DB 검색 옵션을 선택합니다.
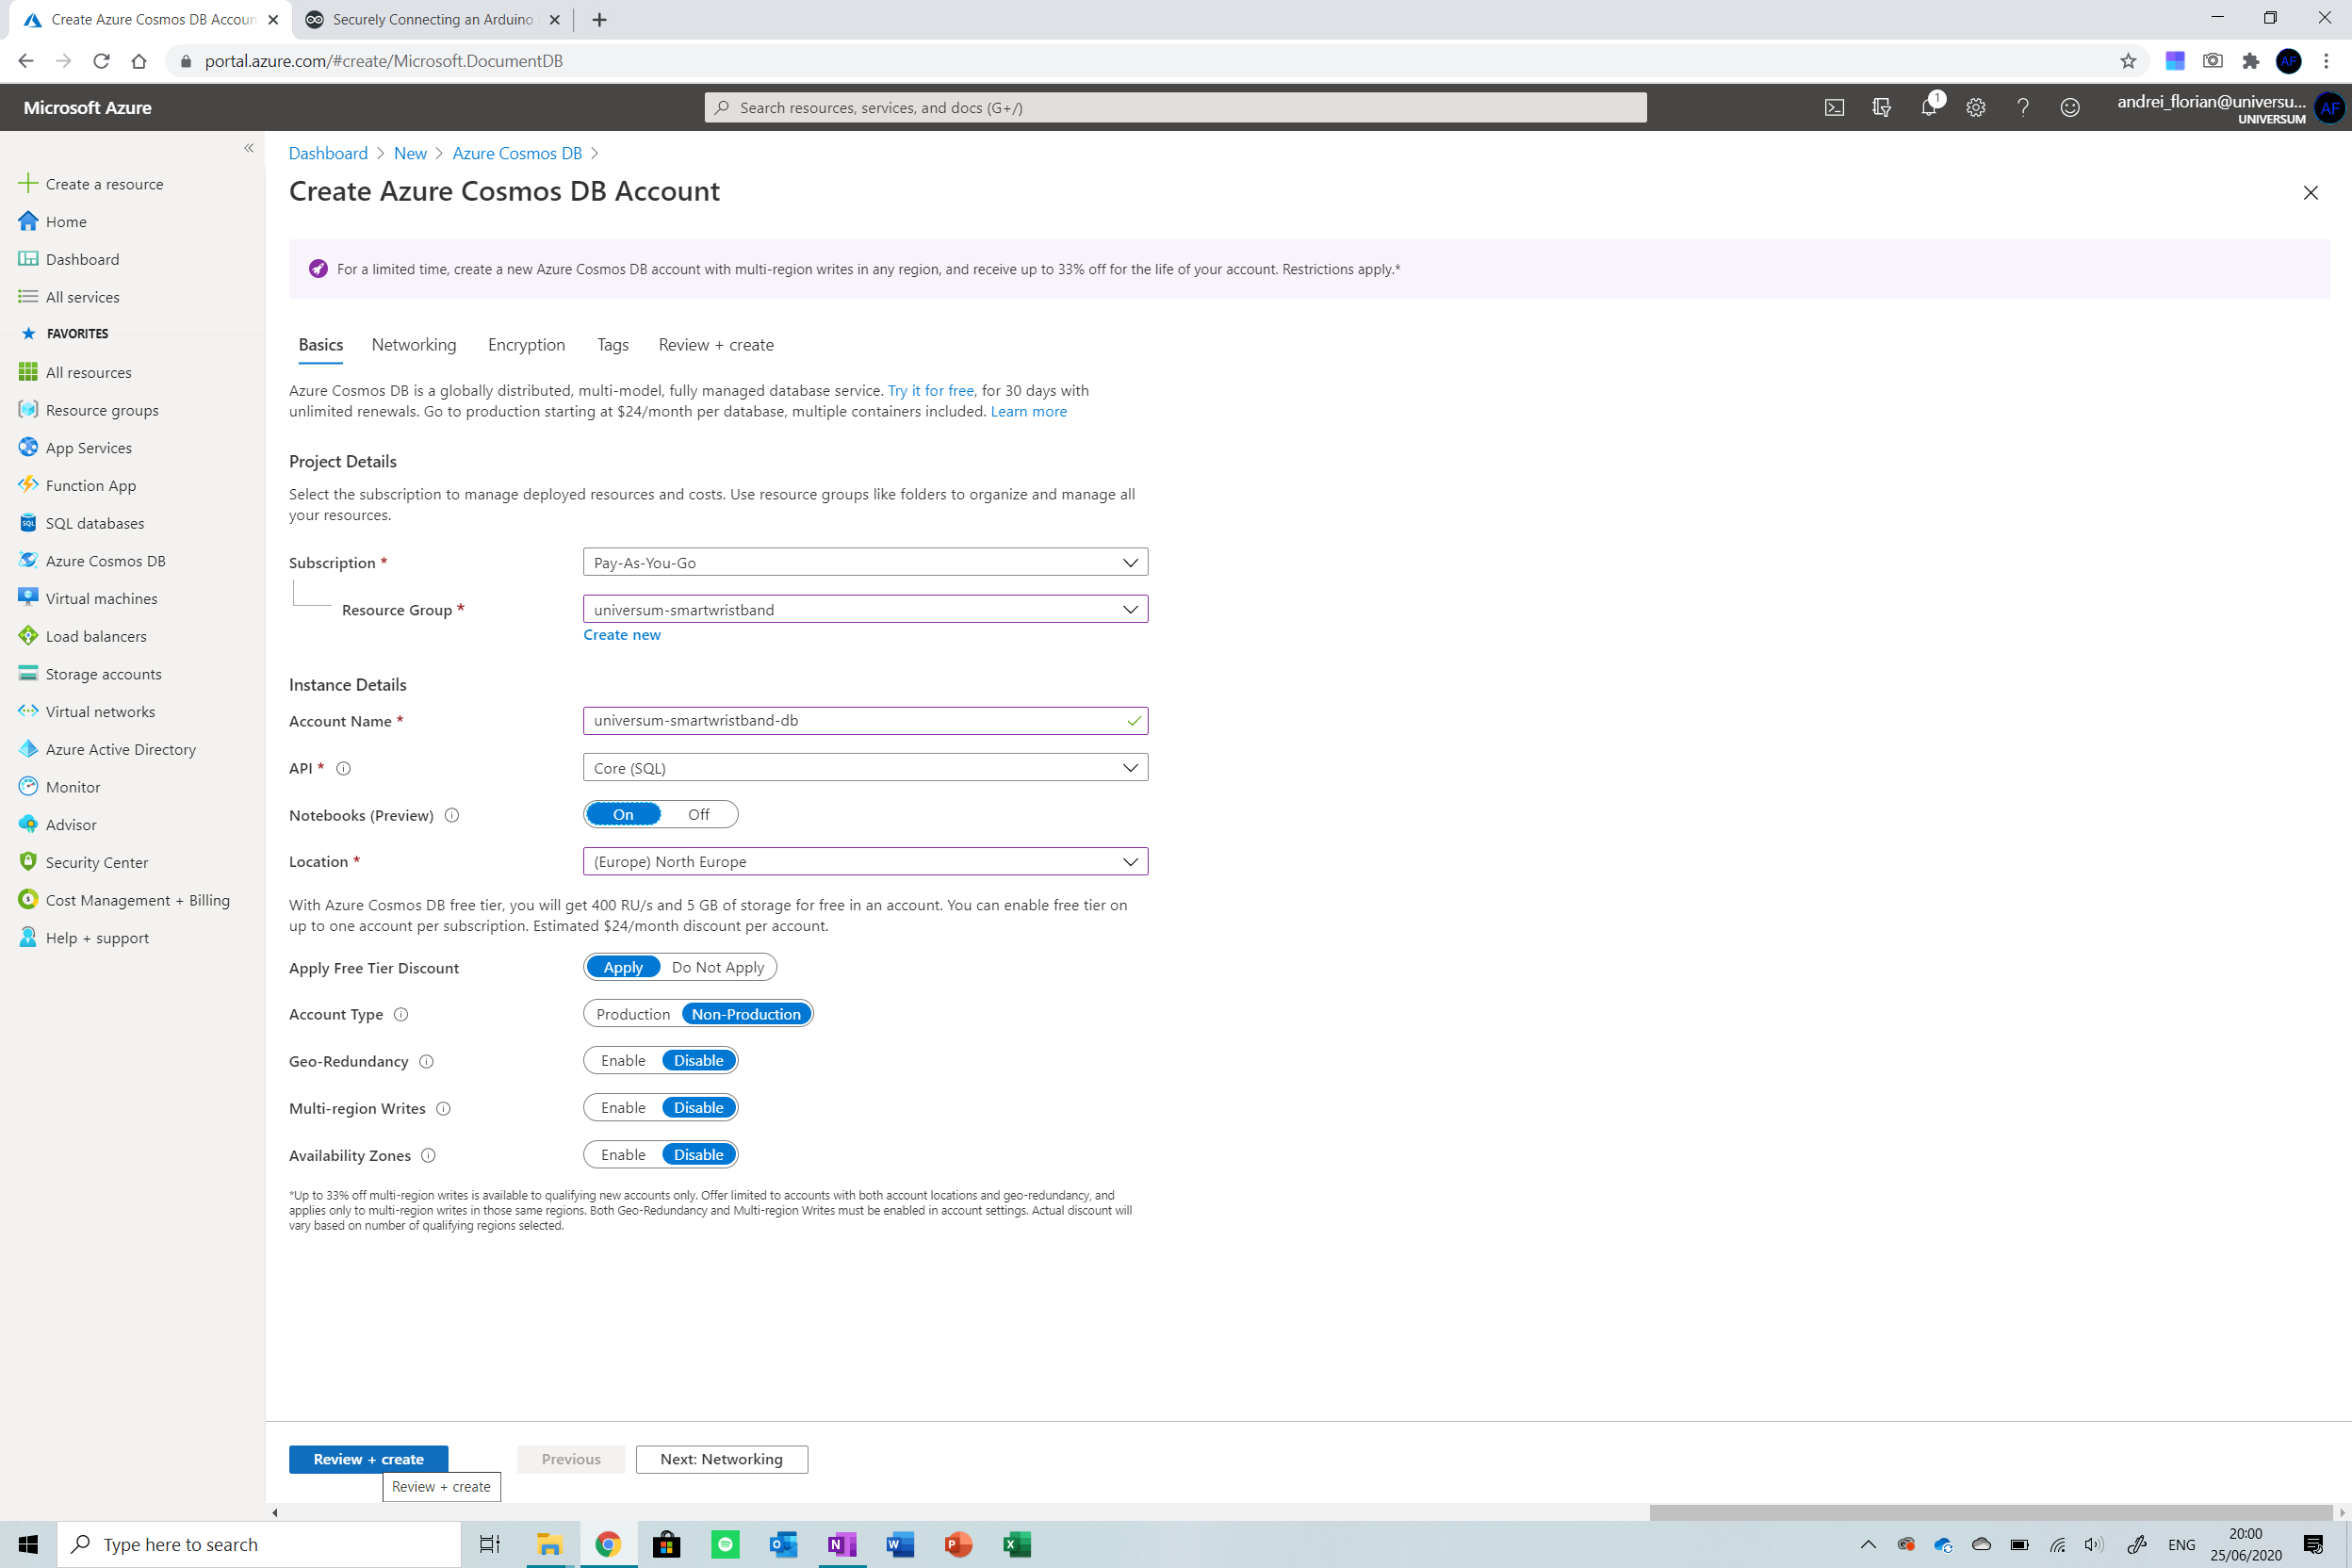
IoT Hub로 생성된 리소스 그룹 선택 이름을 지정하고 나머지 설정은 동일하게 유지합니다. 지역이 동일한지 확인하십시오. 지역 이전 비용을 방지하기 위해 IoT Hub와 데이터베이스 모두에서.
그리고 그게 다야! 리소스가 배포될 때까지 기다리면 계속 진행할 수 있습니다.
6단계:스트리밍 분석 작업 만들기
이제 IoT Hub와 데이터베이스가 설정되었으므로 두 가지를 함께 연결해야 합니다. IoT Hub에 입력된 데이터가 수신되는 대로 데이터베이스로 스트리밍되도록 합니다.

Start off by creating a new resource by typing Stream Analytics Job . Now select the resource group used up until now and ensure that the number of streaming units is set to 1. If delivering a high quantity of devices, you may want to consider creating more streaming units to handle the greater number of devices.
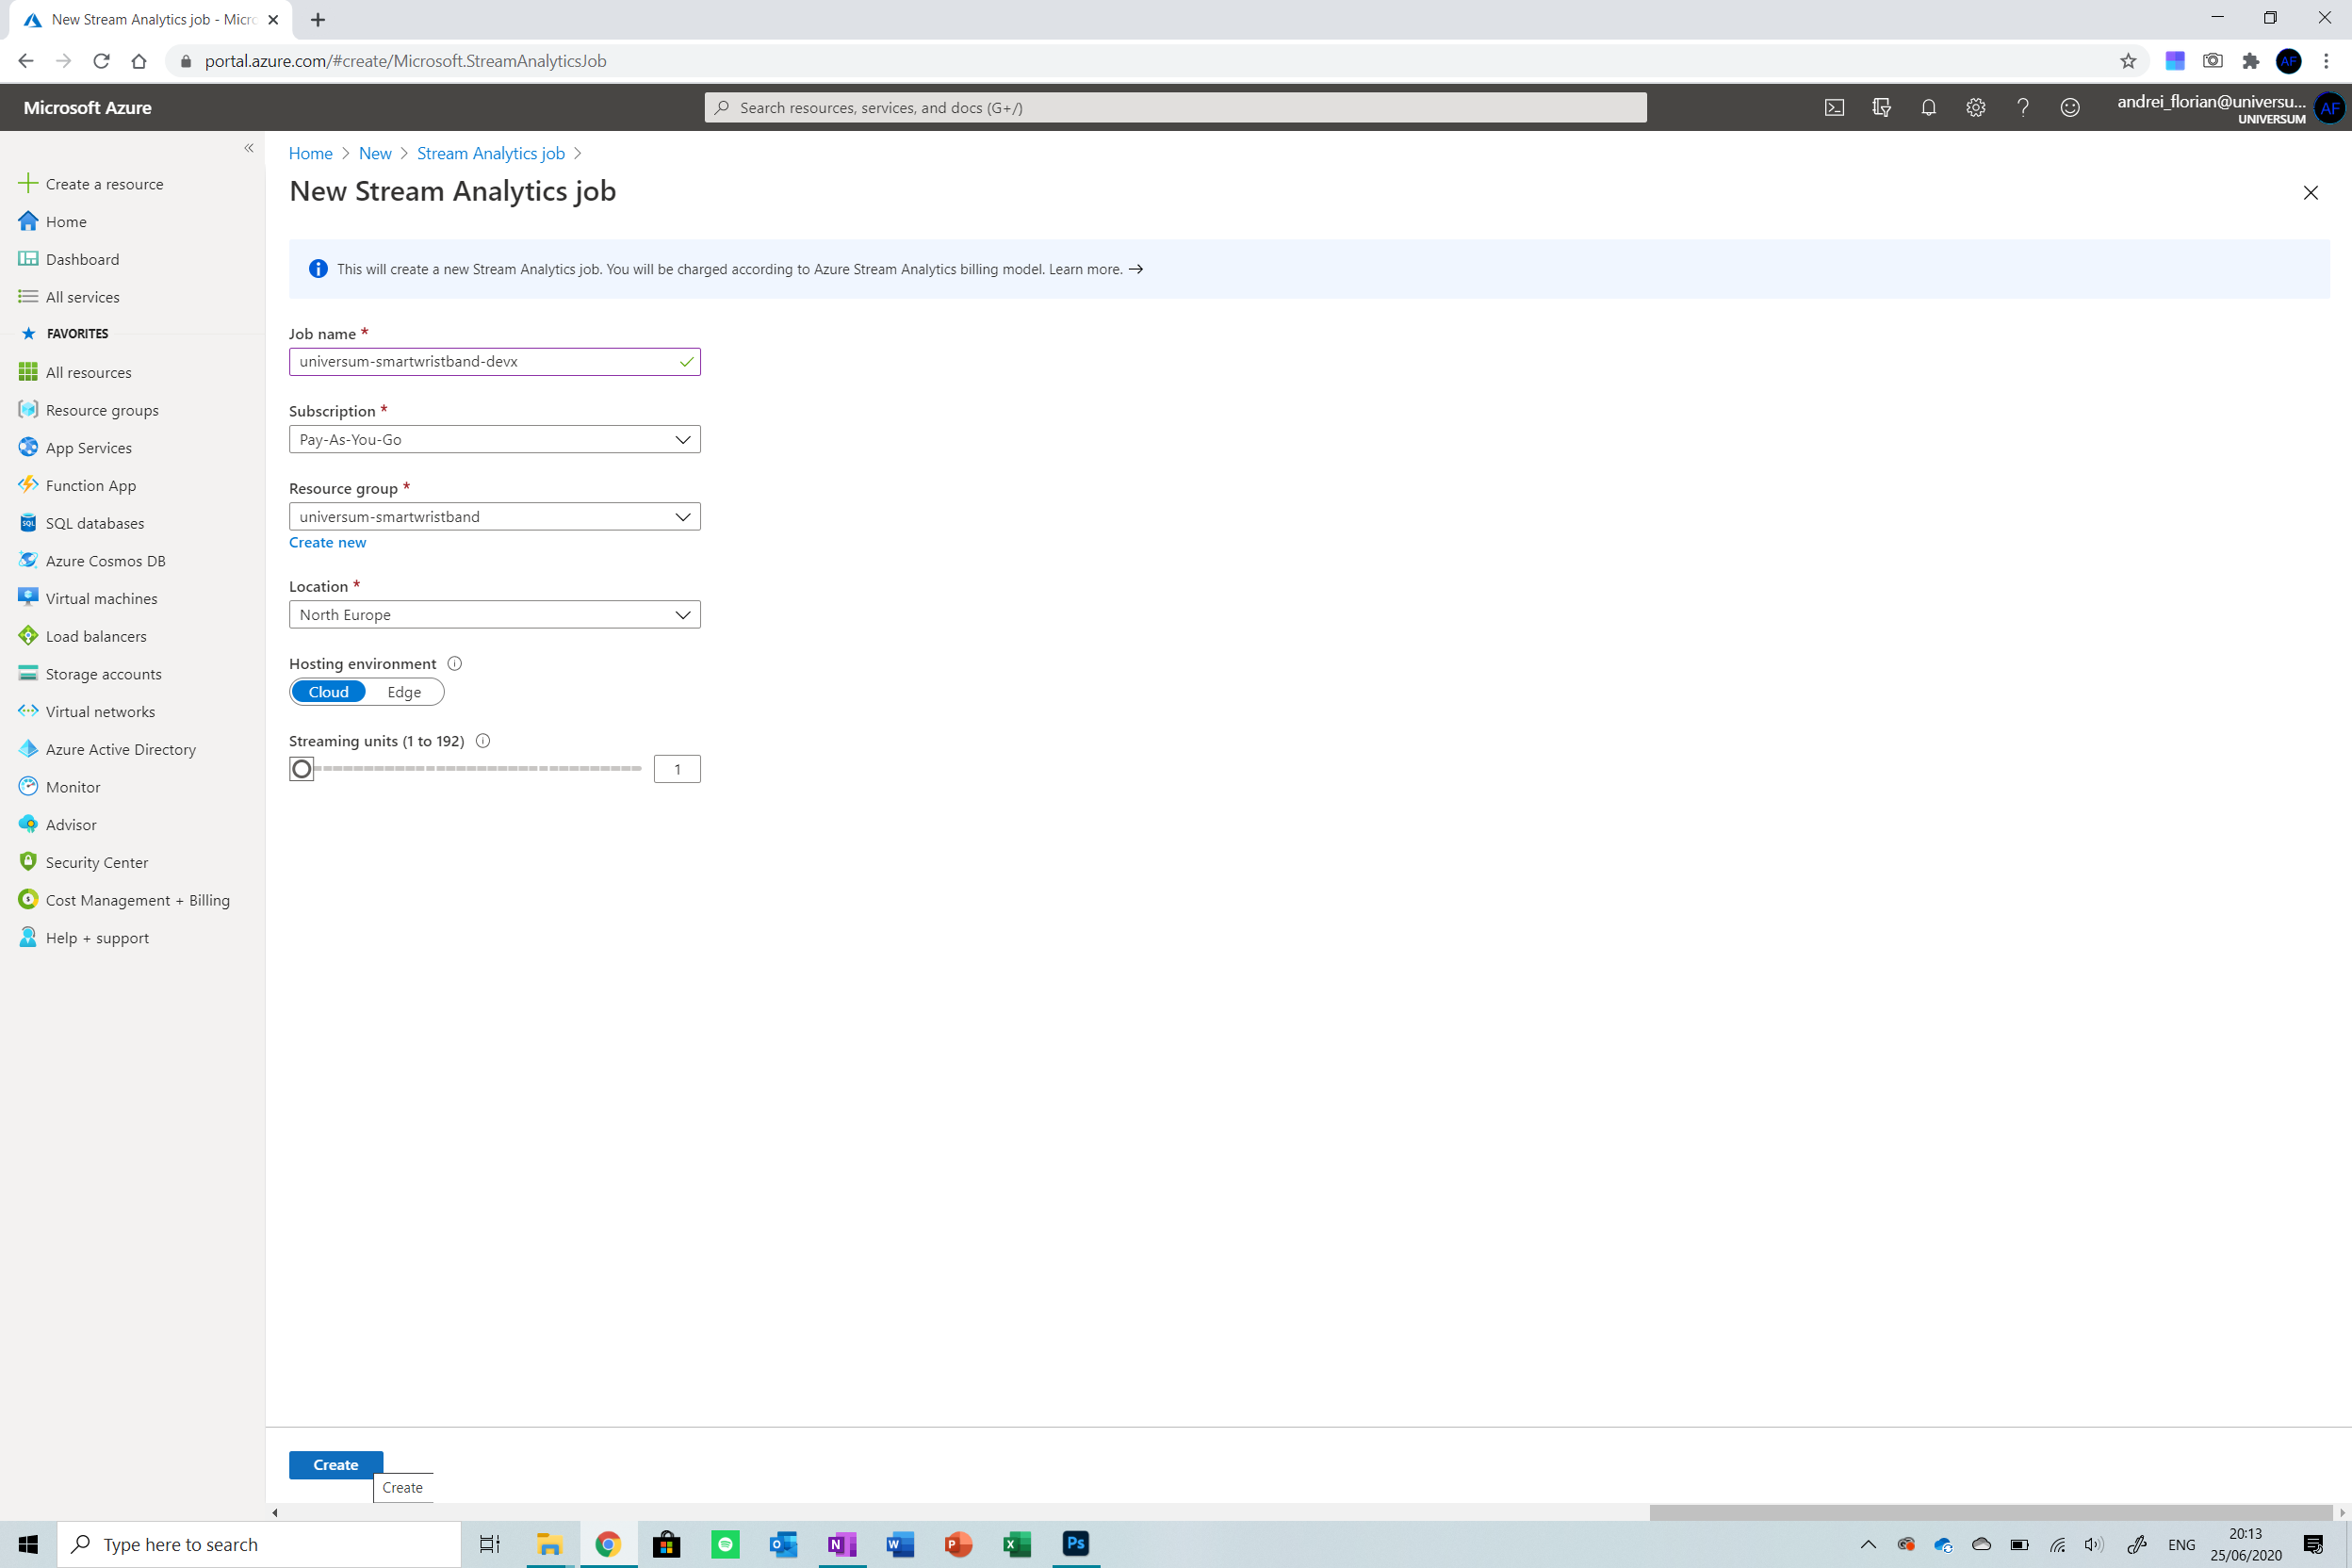
Wait for the resource to deploy and then select it from the All Resources button on the menu on the left.
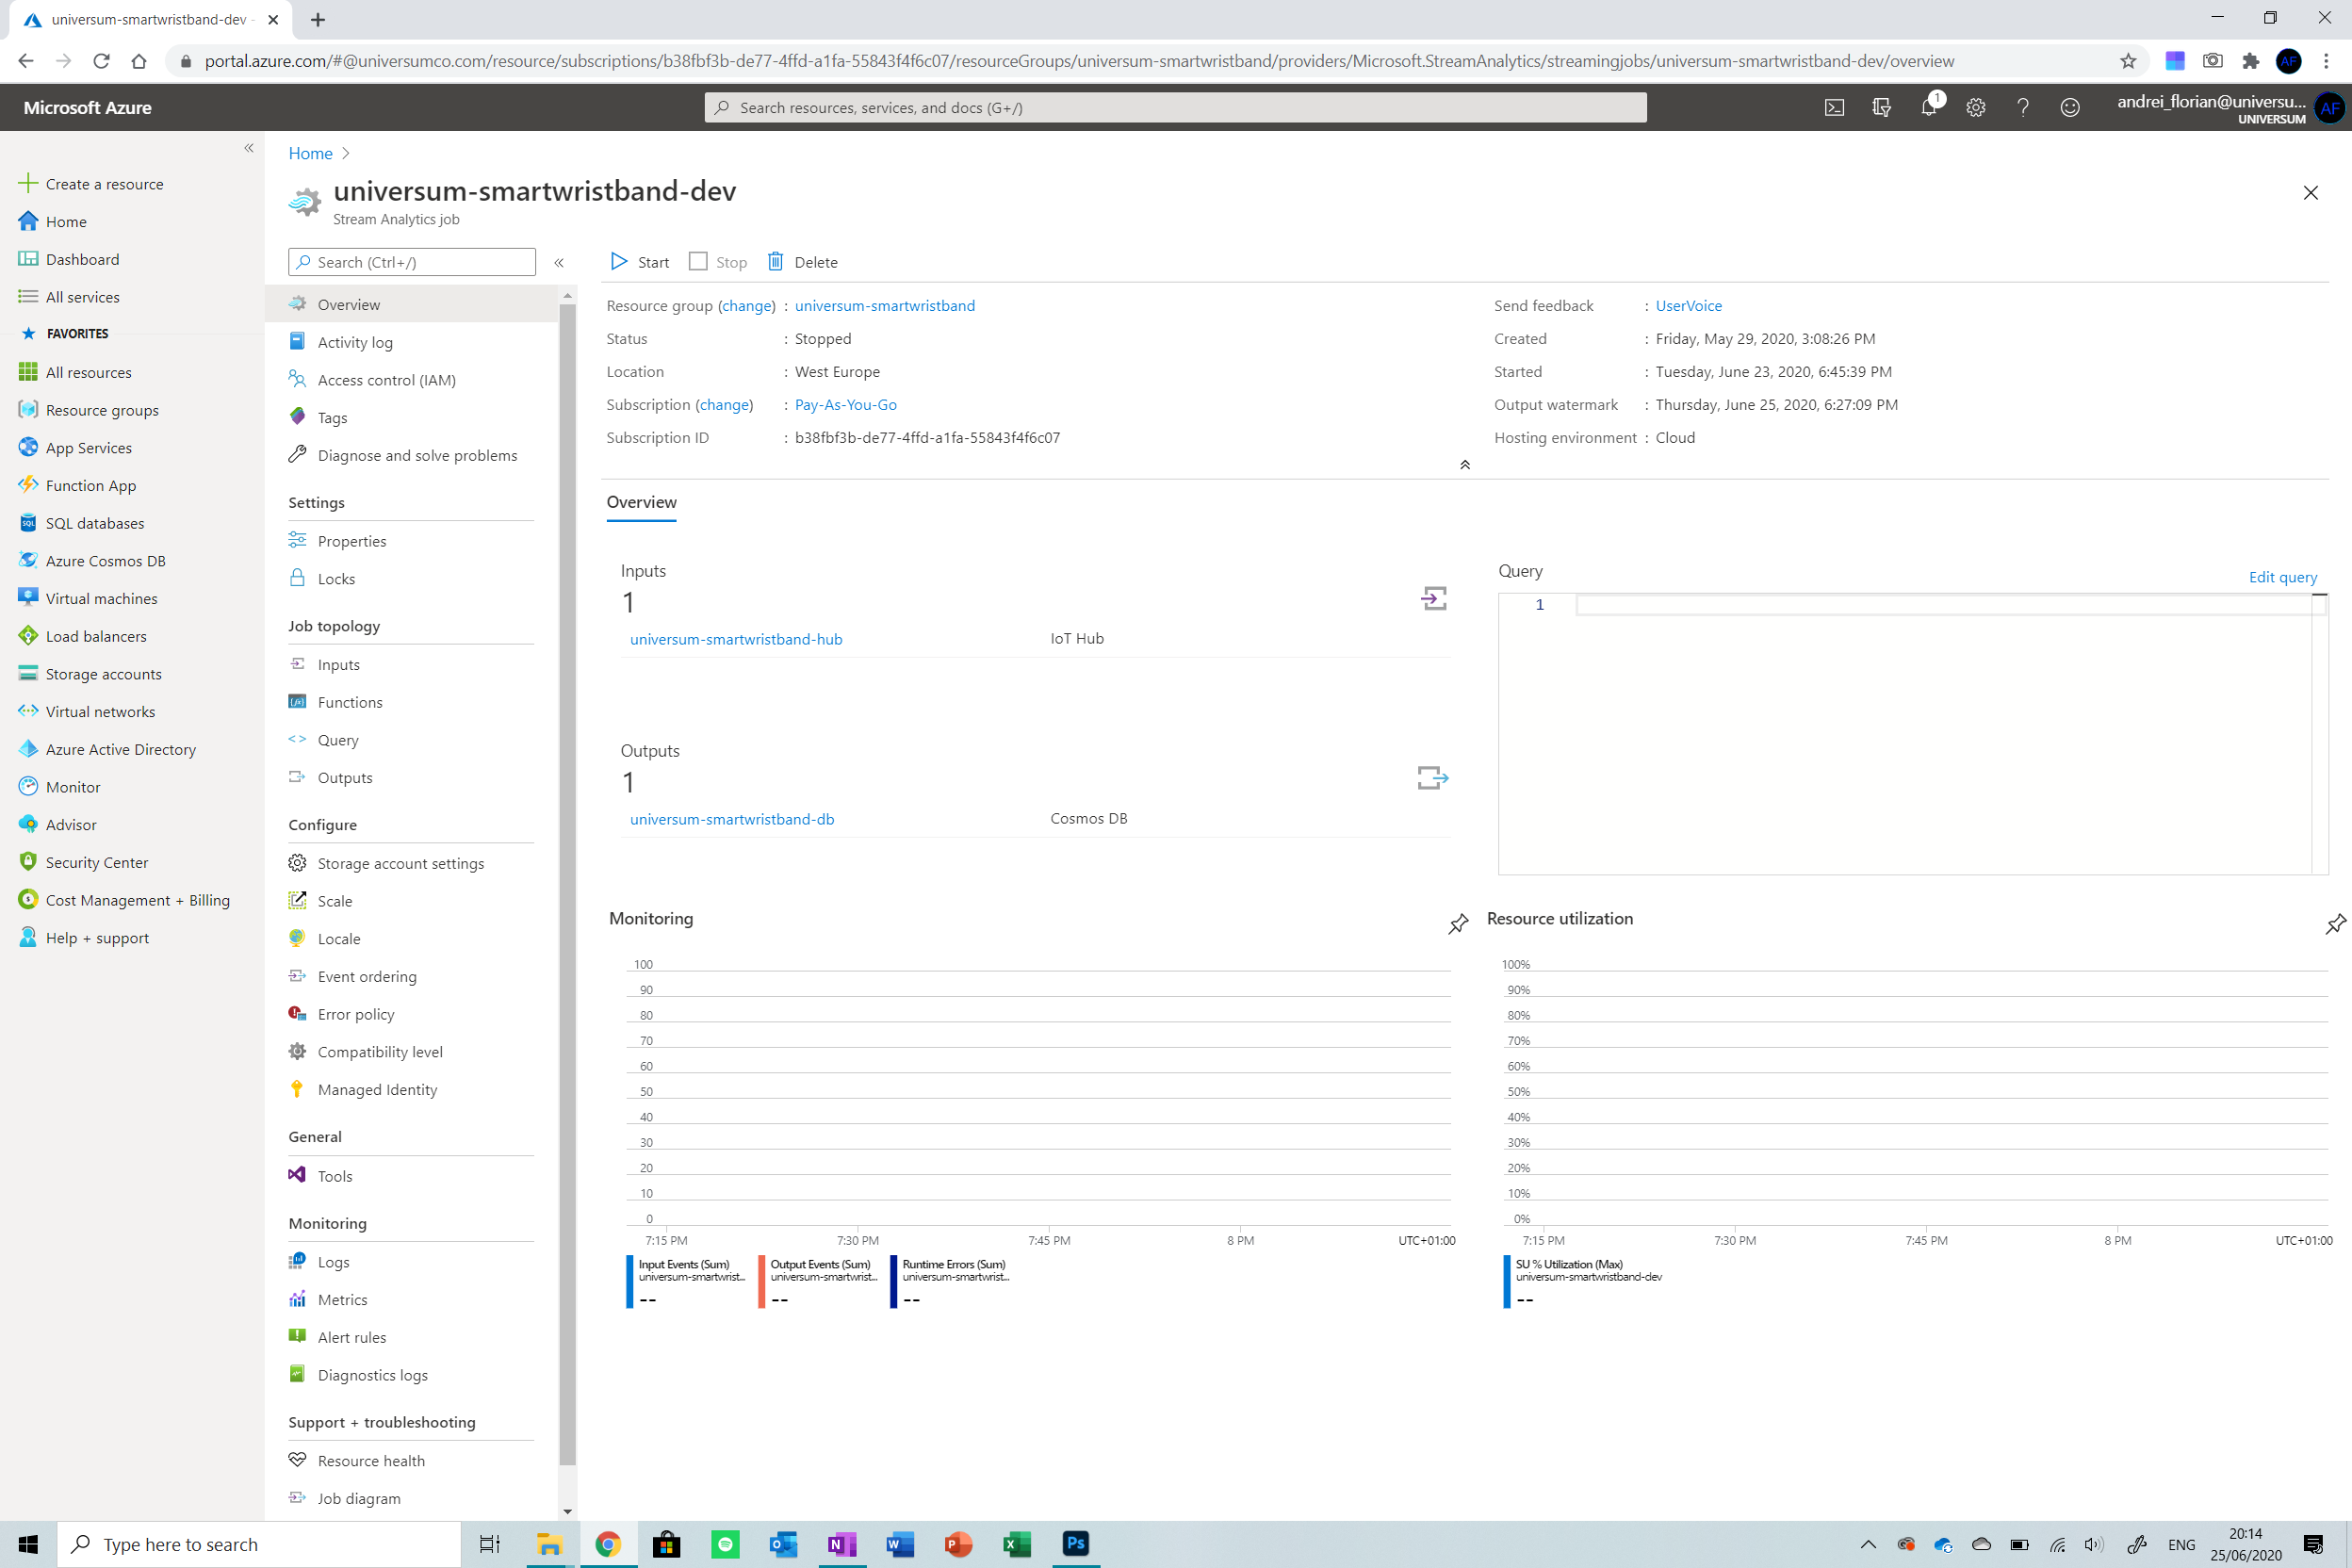
Now that we are in the resource, select the Inputsbutton from the menu on the left to select our input. Click on Add Stream Input and then select IoT Hub from the list of options.
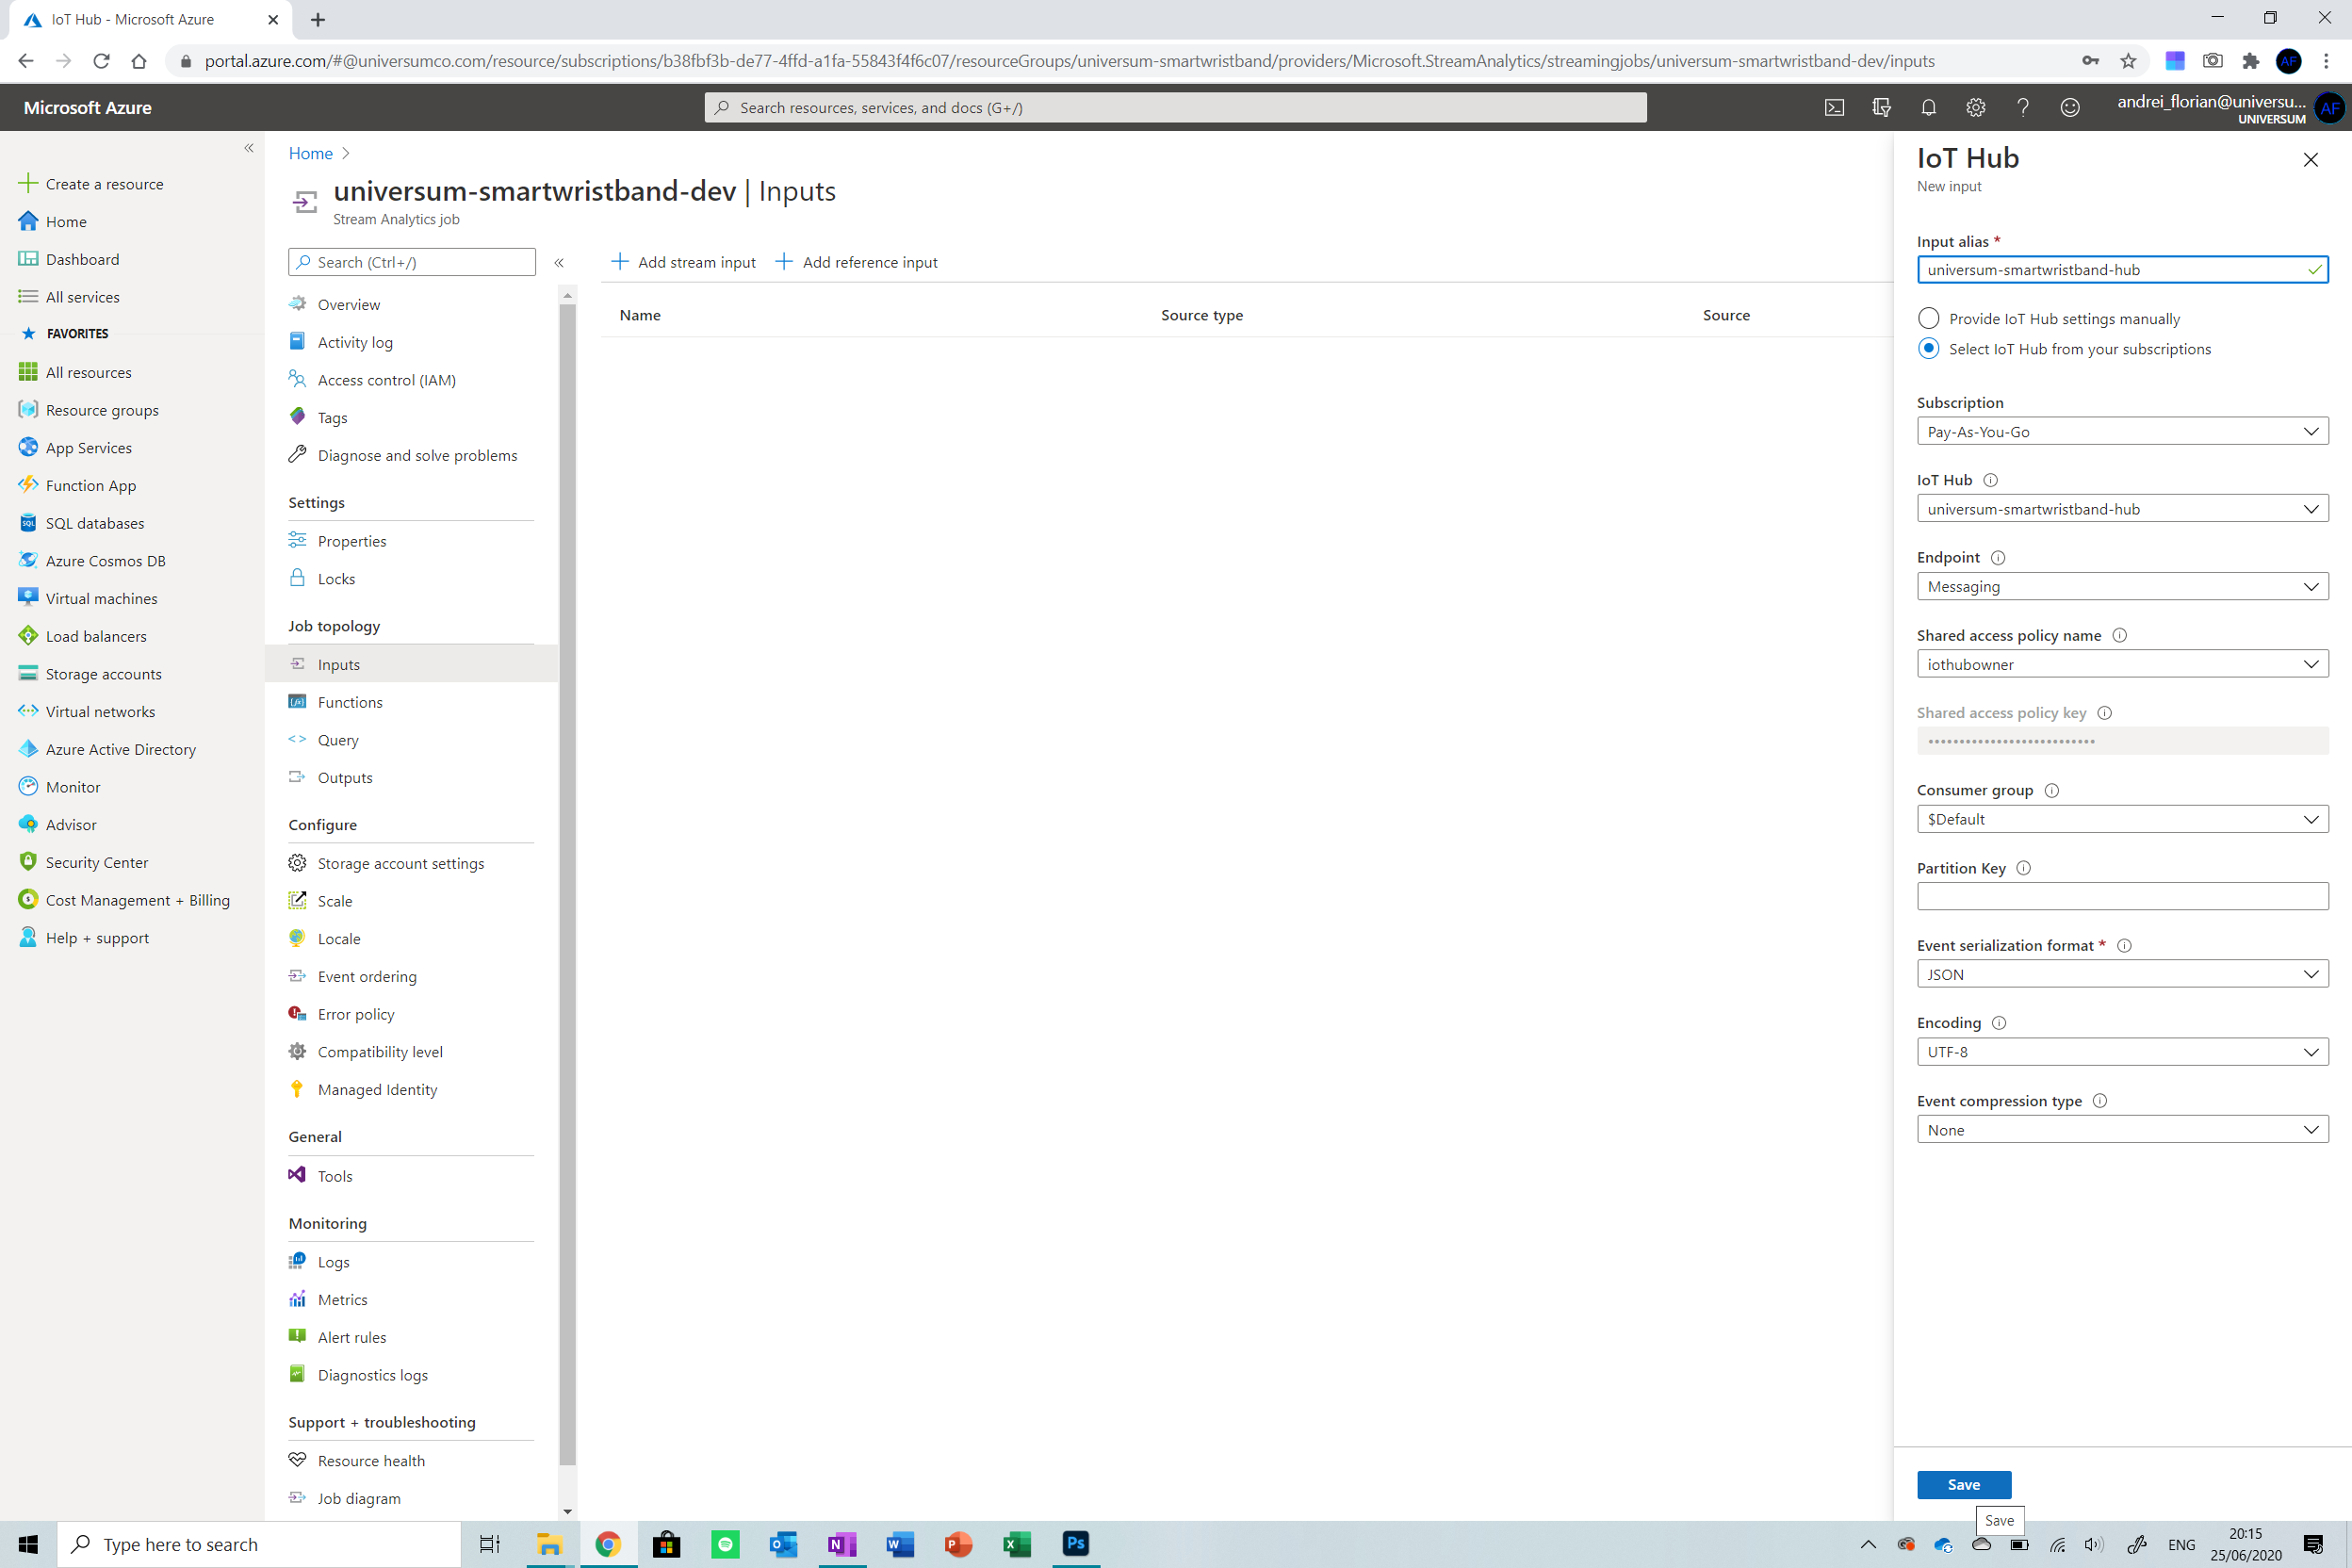
Enter the name of your IoT hub and then select it from the menu shown. Do not change any other settings. Click Save. Now click on the Outputs option from the menu on the left of the screen and select the Cosmos DB option from the list provided.
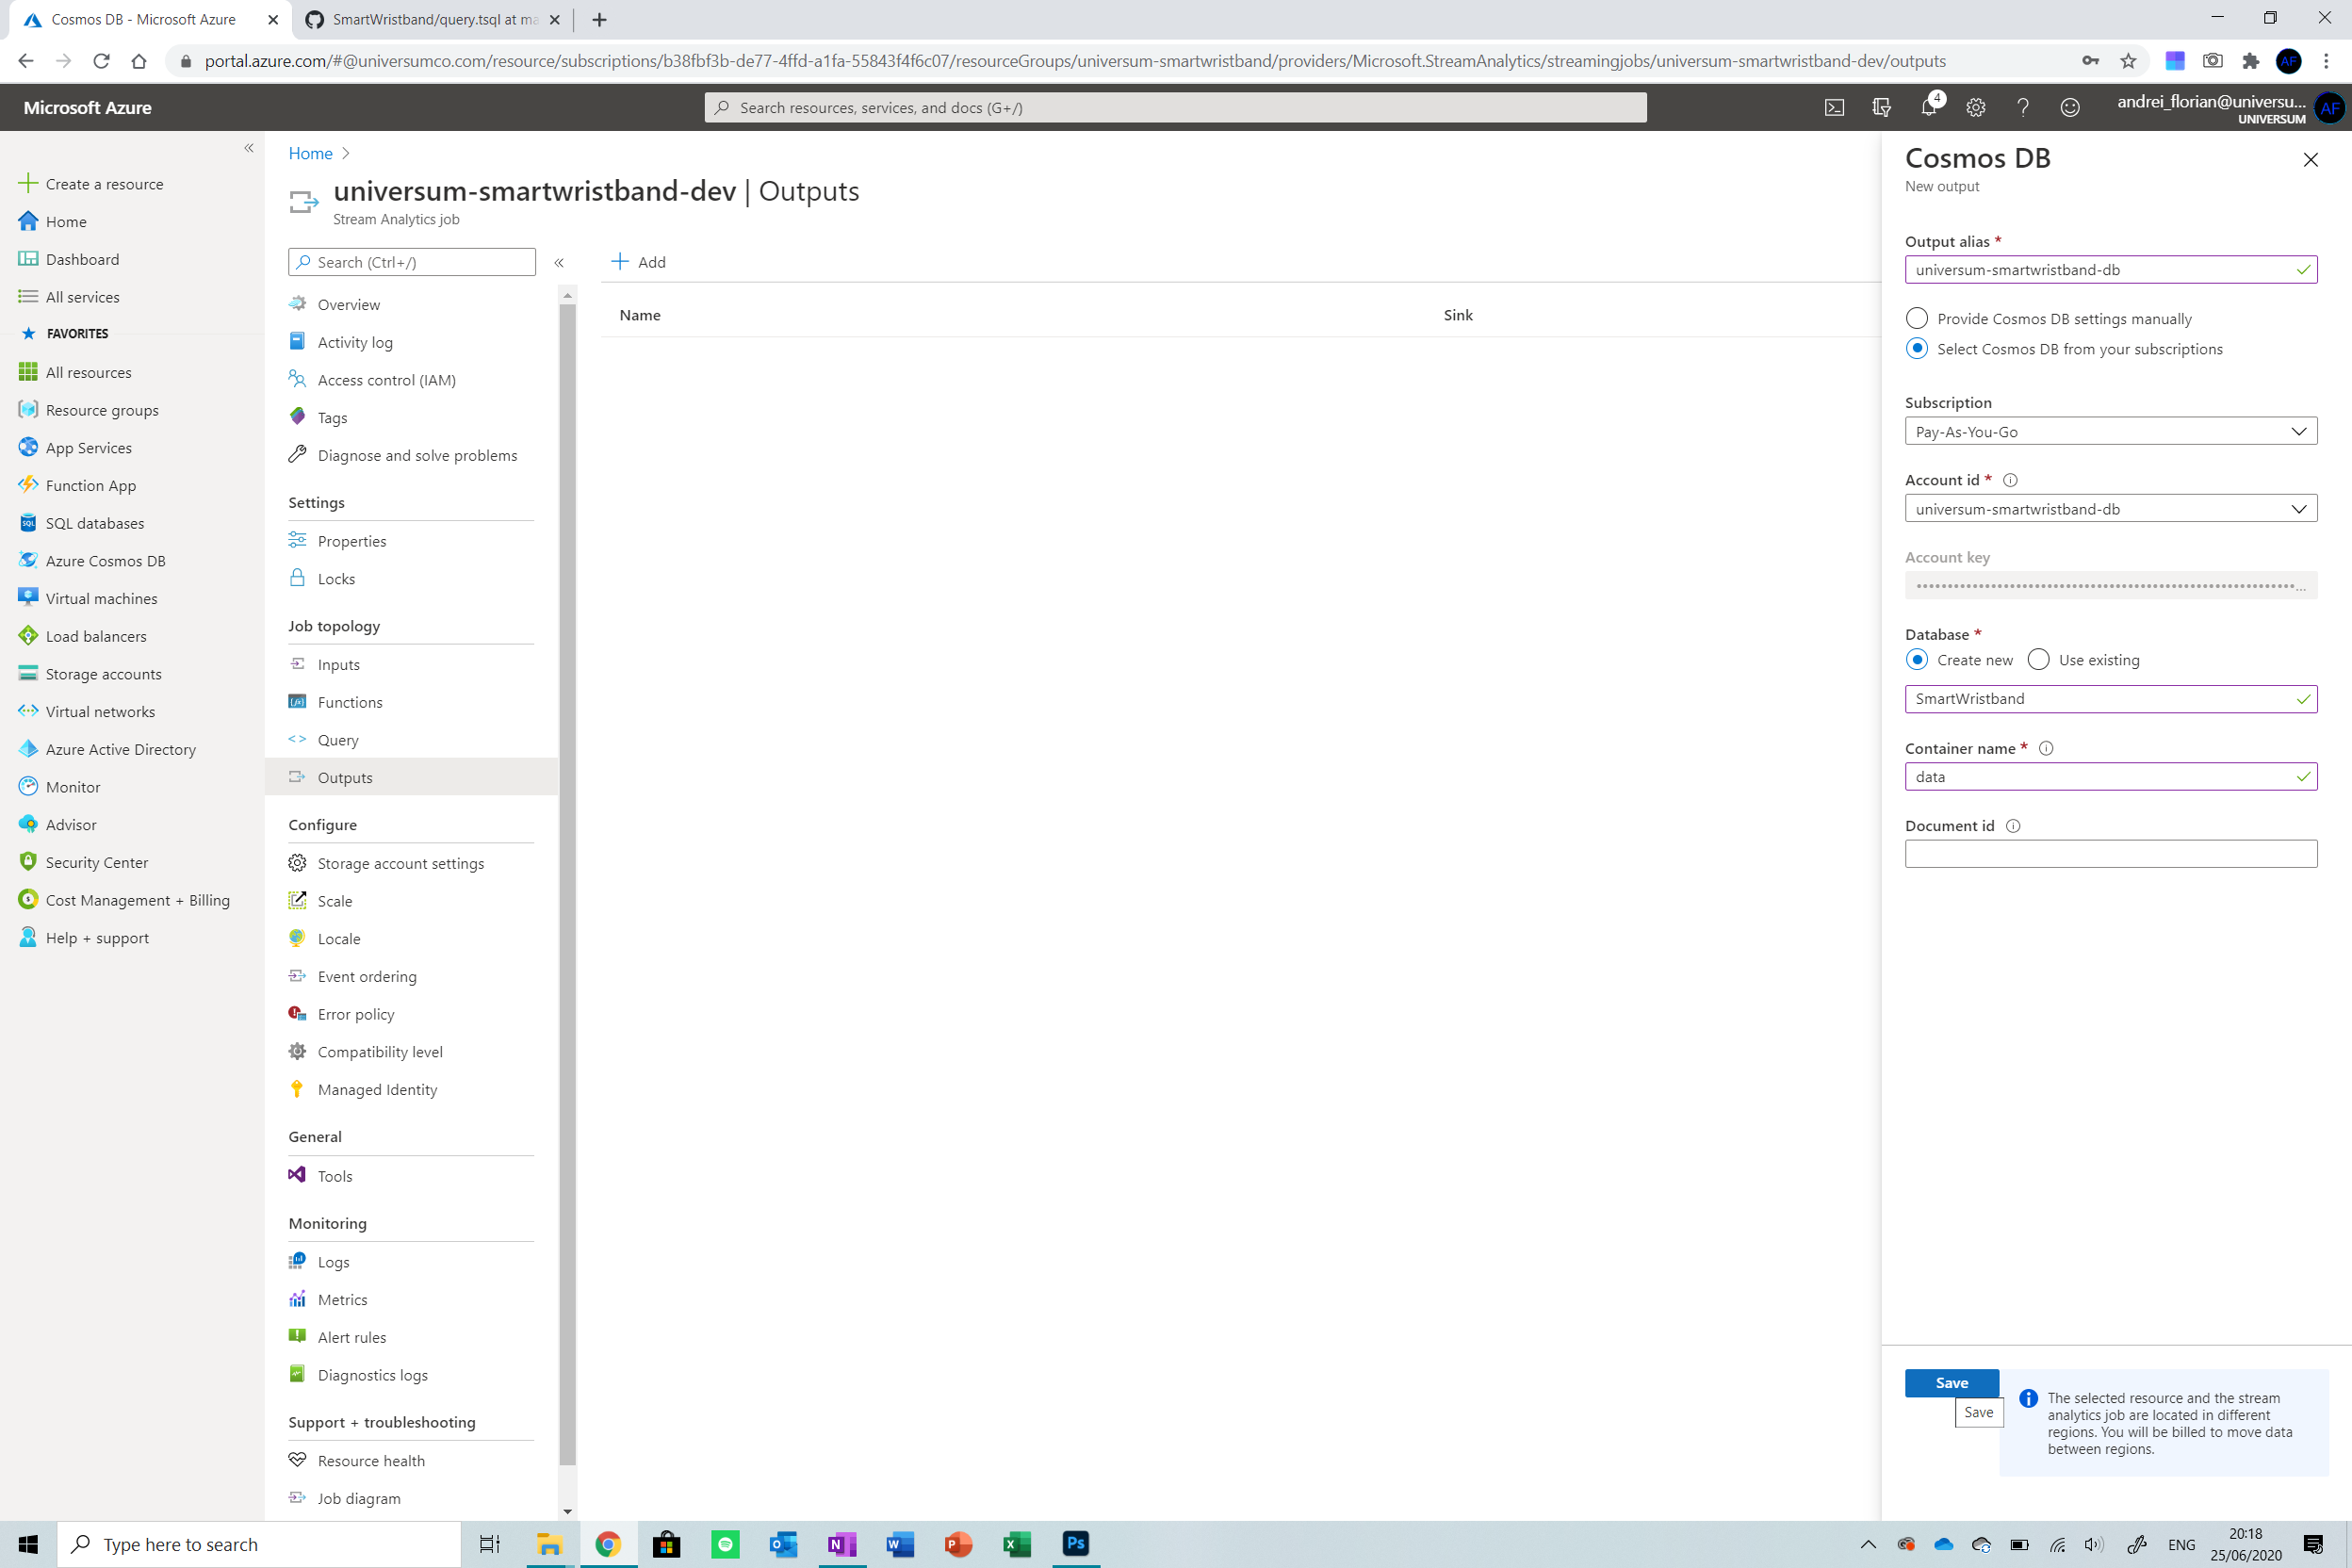
Name the output and then select the database from the options provided. Select Create New under Database and set the database name to SmartWristband and the container name to data . Leave the document ID empty. Now click Save .
The final thing we need to do is click on Query from the options. We need to supply the service with code to route all the data from the IoT hub into the database. Copy and paste the code below into the space provided. The code will map all inputted values to outputs which will then be stored in a JSON format in the Cosmos DB.
SELECT
time as time,
id as name,
geoLat as latitude,
geoLng as longitude,
isWorn as isWorn,
heartrate as heartrate,
temperature as temperature,
battery as battery
INTO
[universum-smartwristband-db]
FROM
[universum-smartwristband-hub] 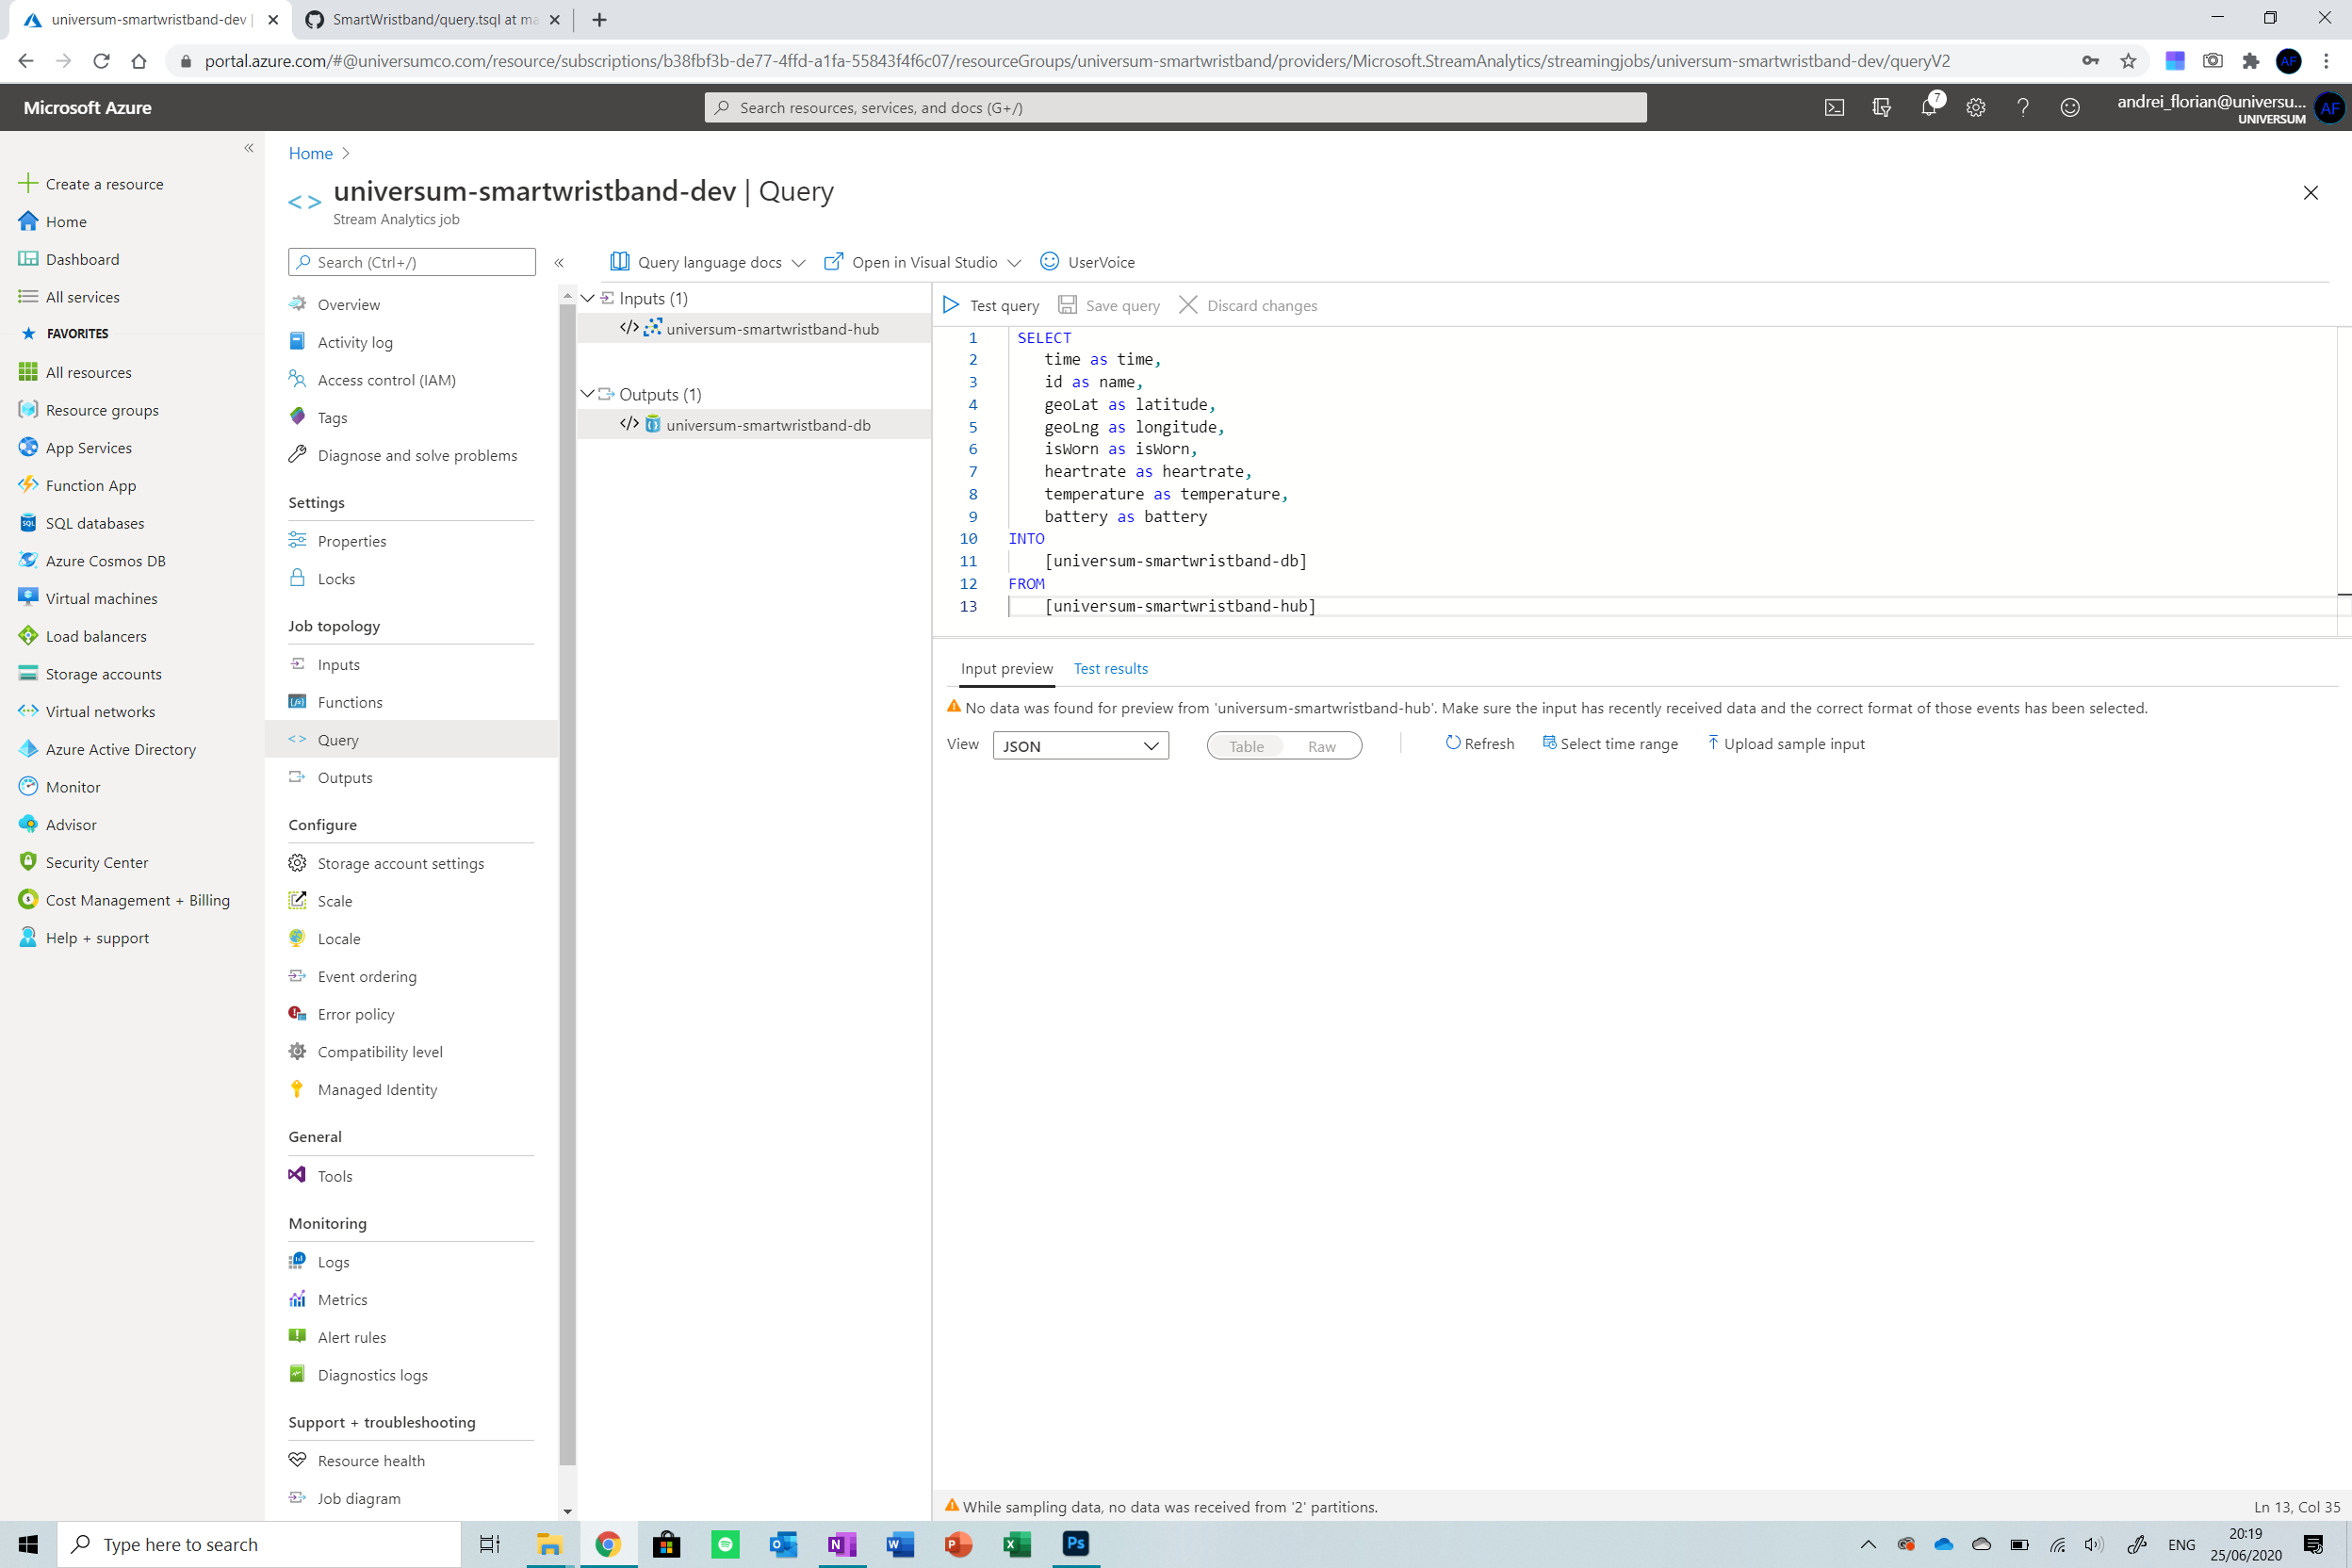
After that is done, click on the Save Query button from the menu at the top of the screen and we are ready to go. Now all we need to do is click back on Overview from the menu on the left and then start the streaming by pressing the Start button.
Step 7:Libraries Required
All libraries used in this project are open source. Below is the list of all libraries used and the links to their GitHub repositories. Please make sure you download and install them before moving on.
<울>
Step 8:Preparing the Variables
Now we can focus on the frontend of the application . Open the code from the GitHub repo in the Arduino IDE or web IDE and follow along with the steps below to edit the variables in the document so that the MKR GSM will be able to connect to Azure IoT.
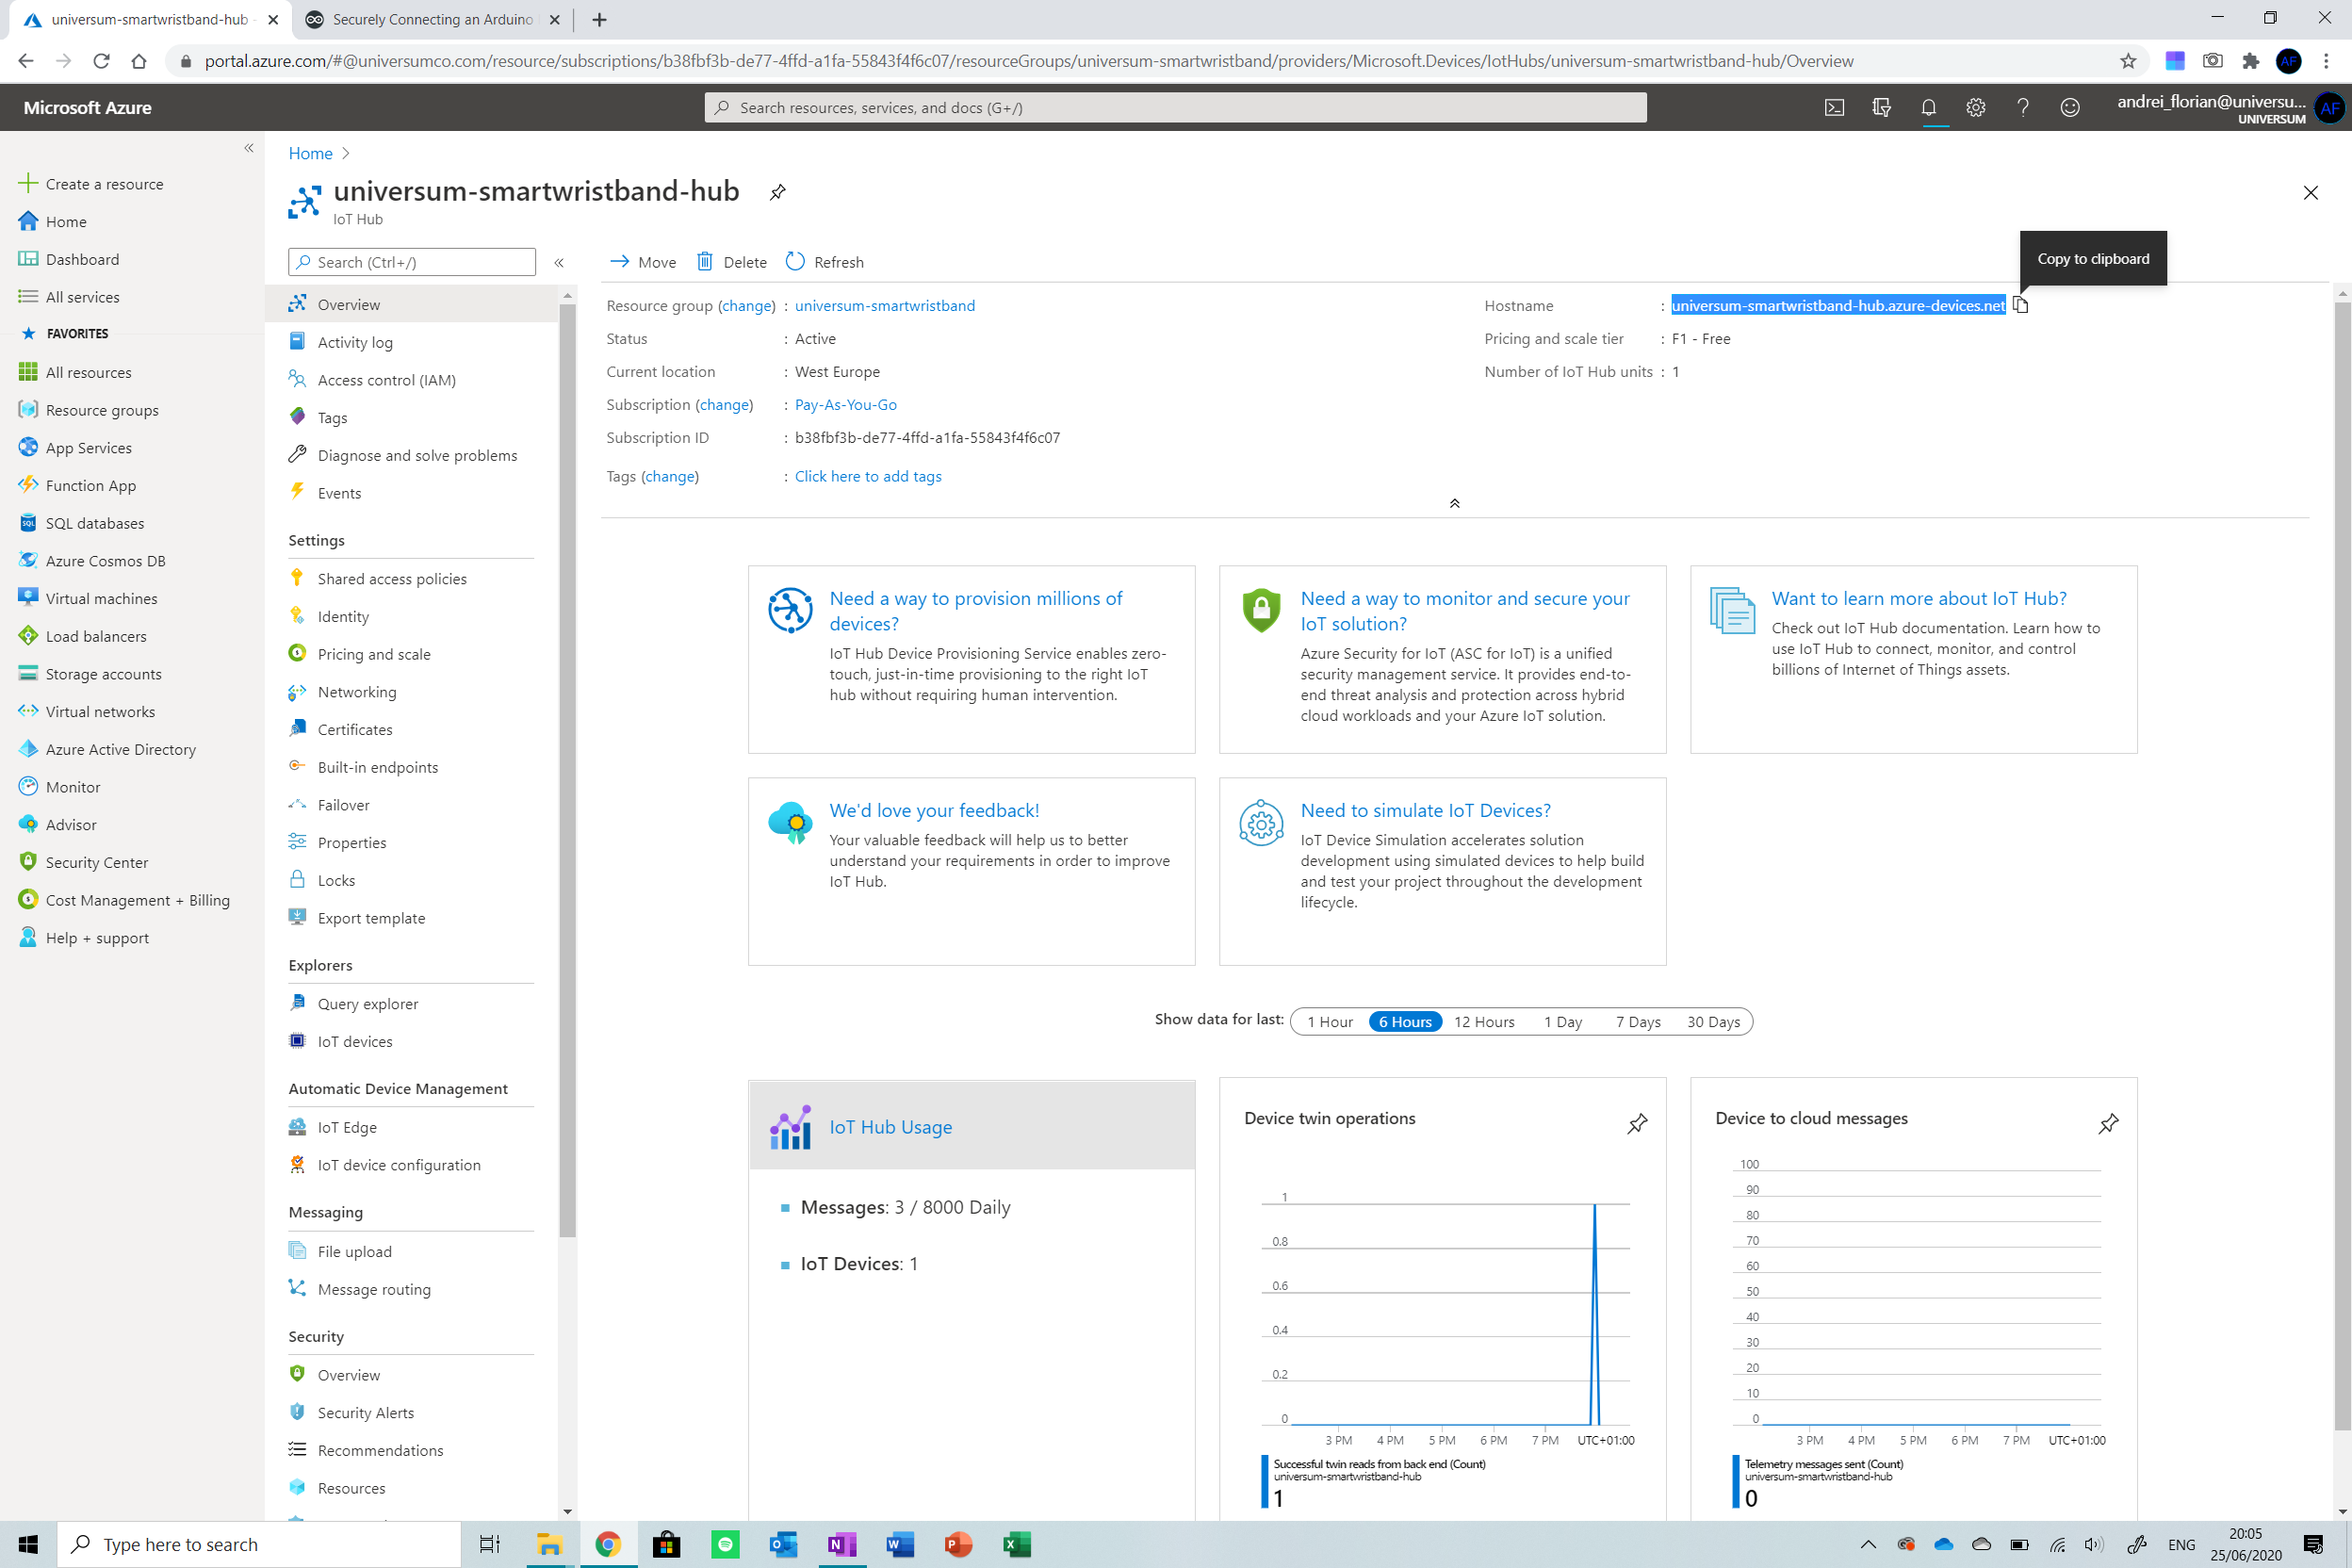
The first thing we will need to do is navigate to the IoT hub created and copy the hostname shown. Now open the secrets.h file from the project and input this string into the SECRET_BROKER field.
The next thing is getting the device name. This is simply the name given to the device in the IoT Hub. Copy the name displayed and then paste it in the SECRET_DEVICEID field in the secrets.h 파일. At the end, your file should look something like this.
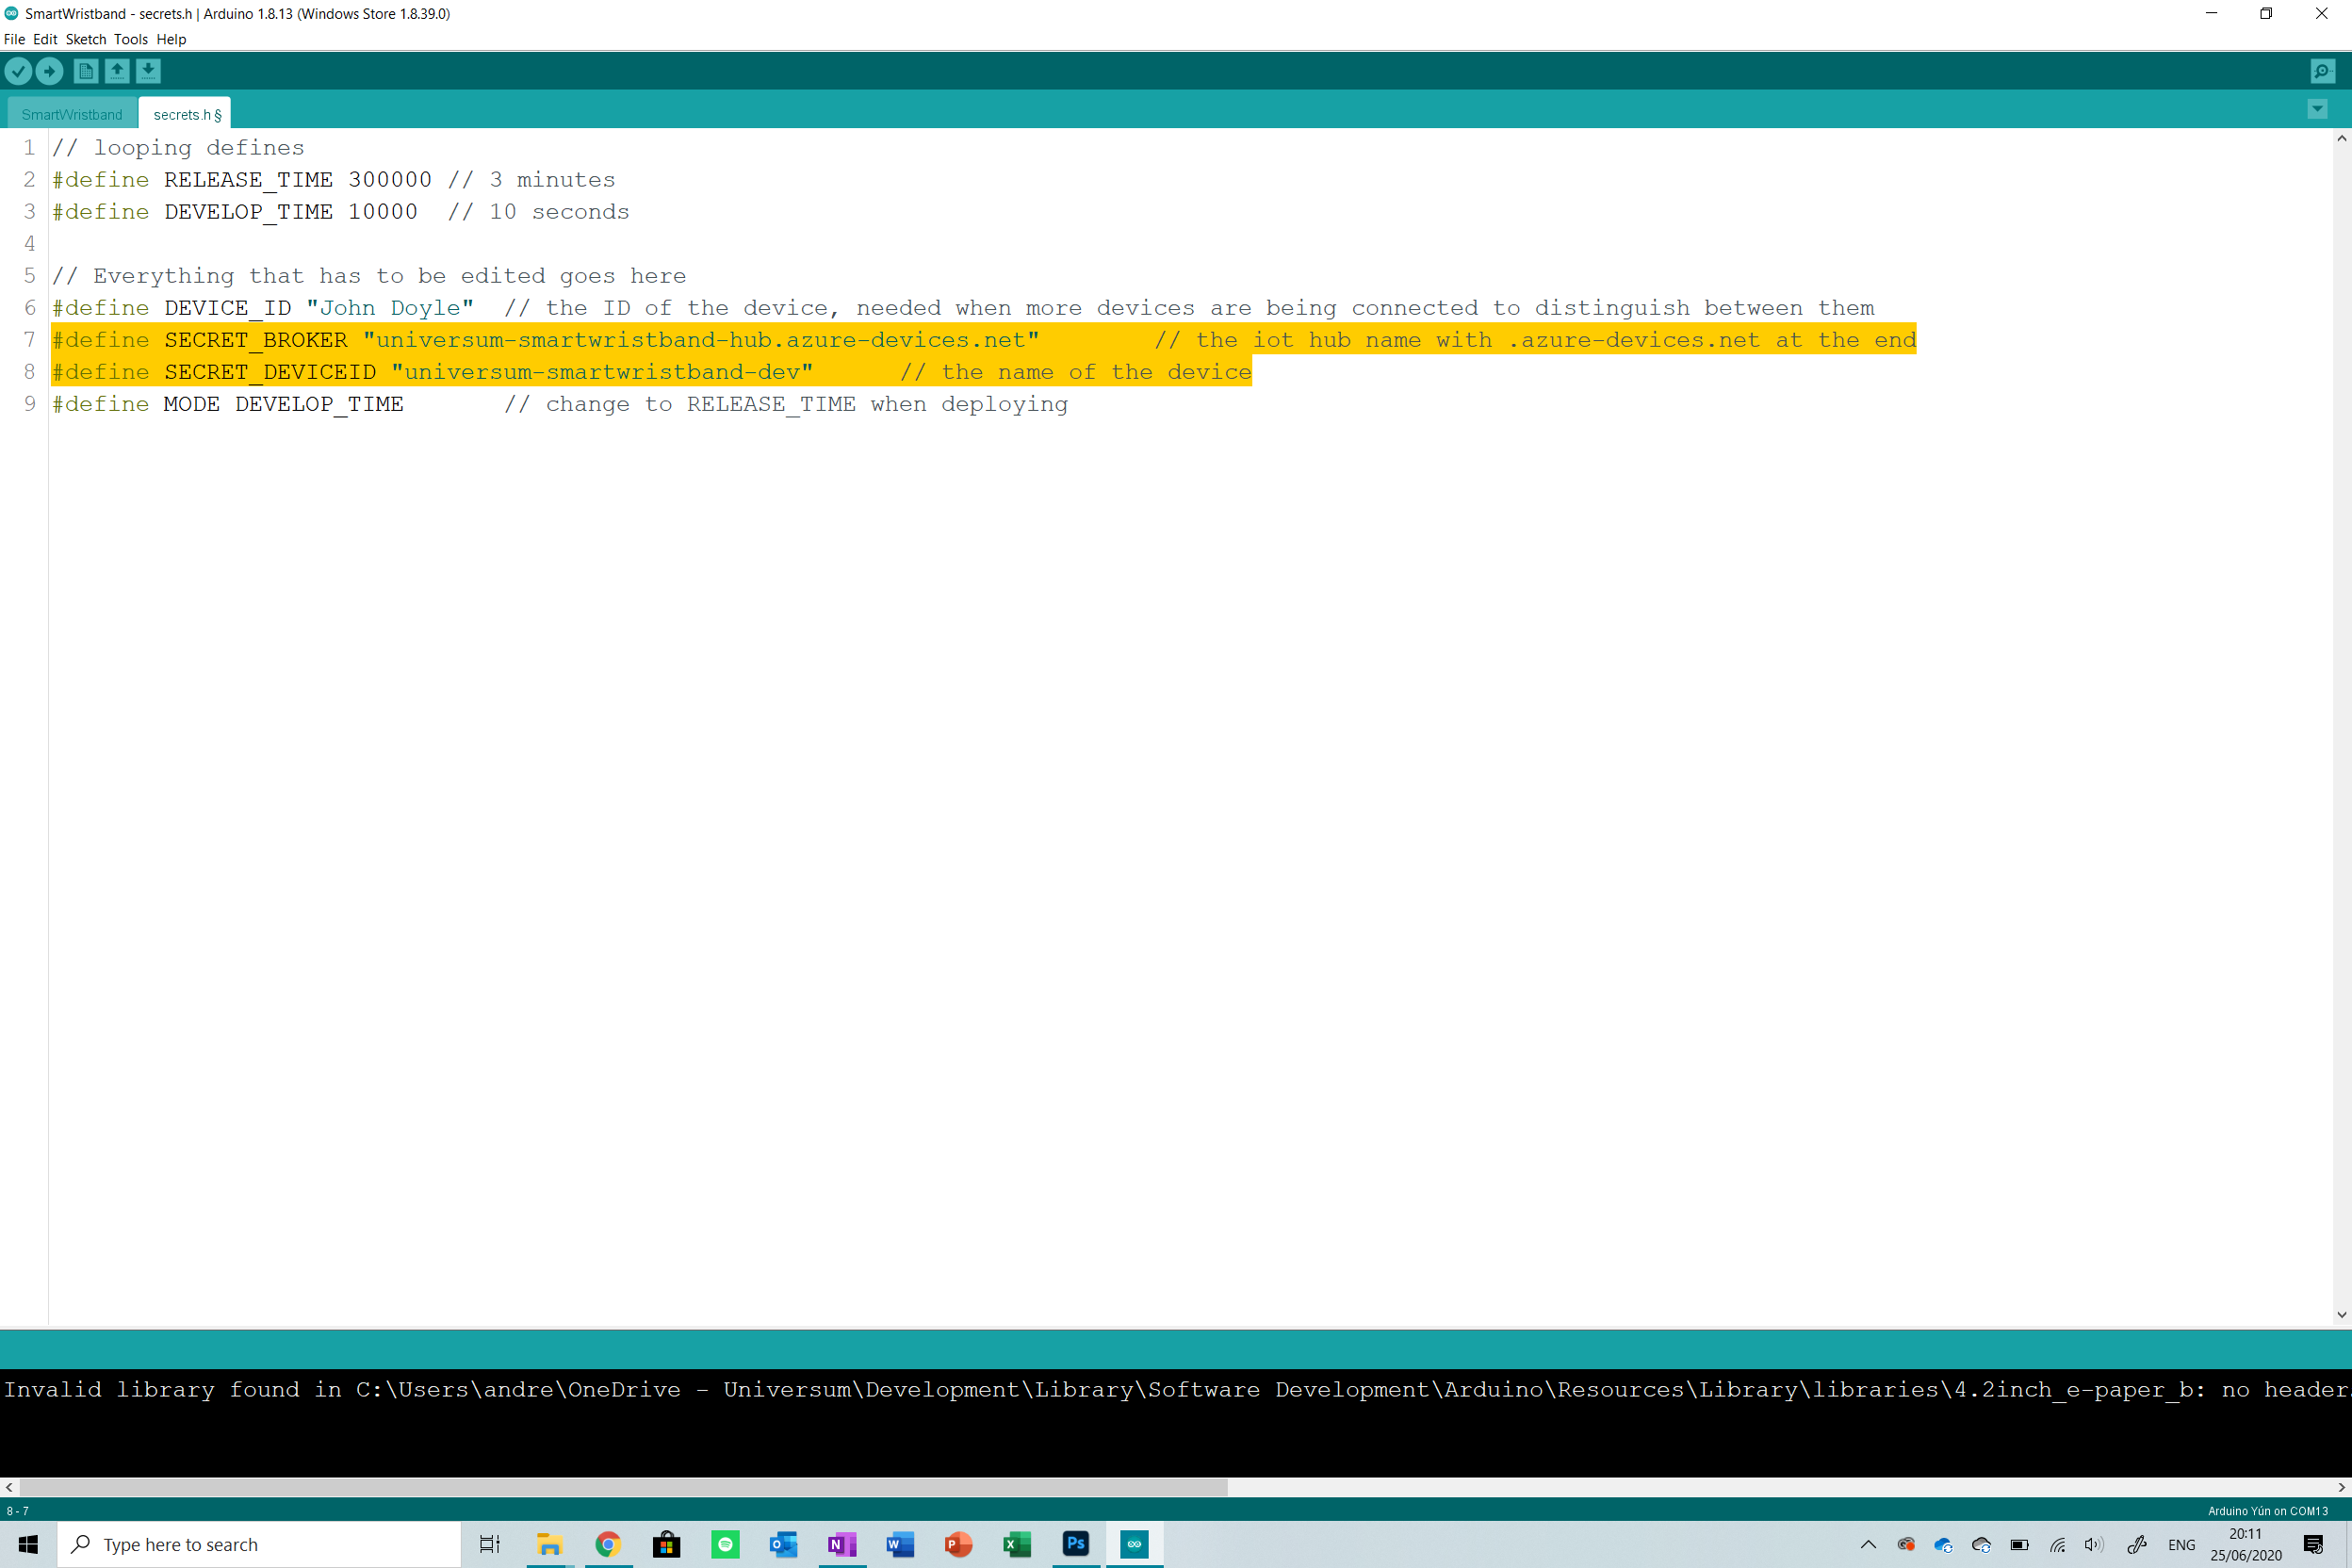
The last thing you need to do is change the DEVICE_ID . I included this feature so that all devices would have a specific ID when deployed . You can set the ID to the name of the patient or a string to be able to identify the devices and distinguish them.
Finally, I want to talk about the MODE option . When I created this project, I needed to have a way to easily test and troubleshoot the application before deploying it. The mode of the application solves this. There are two modes in which the application can be set:
<울>We will toggle between these modes later, for now, leave it in DEVELOP_MODE .
Step 9:Flashing the Developer Version
Now that all the setup is done, we need to test the code out to ensure it is running in the DEVELOP_MODE. To do this, ensure that you followed all the steps above and then connect your device to your PC or mac via USB and then upload the sketch.
Open the serial monitor (ctrl/cmd-shift-m) and view the verbose. It will take a while to configure the first time, ensure that the data is being sent to the IoT Hub correctly. Then visit the IoT Hub and check the graphs to see if data was received. You are now ready to deploy the application! If you need help troubleshooting, you can contact me through Hackster.
Step 10:Shipping the release version
To change to the release version, all you need to do is change the MODE definition in the secrets.h file to RELEASE_TIME . Now upload this code to the device, ensure the LiPo battery is connected and then unplug it from the computer.
You should see the onboard LED of the device flashing every 10 minuets indicating that a cycle is running. Check the IoT Hub and Cosmos DB database to ensure that the data is going through. Now you are ready to deploy the device!
Ensure you send some data to the backend before continuing as we will need this when creating the dashboard.
Step 11:Onto the Dashboard
Creating the dashboard is meticulous work and takes a long amount of time. In this section I will explain working with the data in the Power Bi dashboards and reports , I will not go over how to design the dashboard because this is up to personal preference but will link tutorials that show you how to do this in detail.
Doctor Dashboard
I will start with the doctor dashboard. Make sure you have Power Bi desktop installed on your PC. Mac users can use the Power Bi online version to create this report, everything is basically the same.
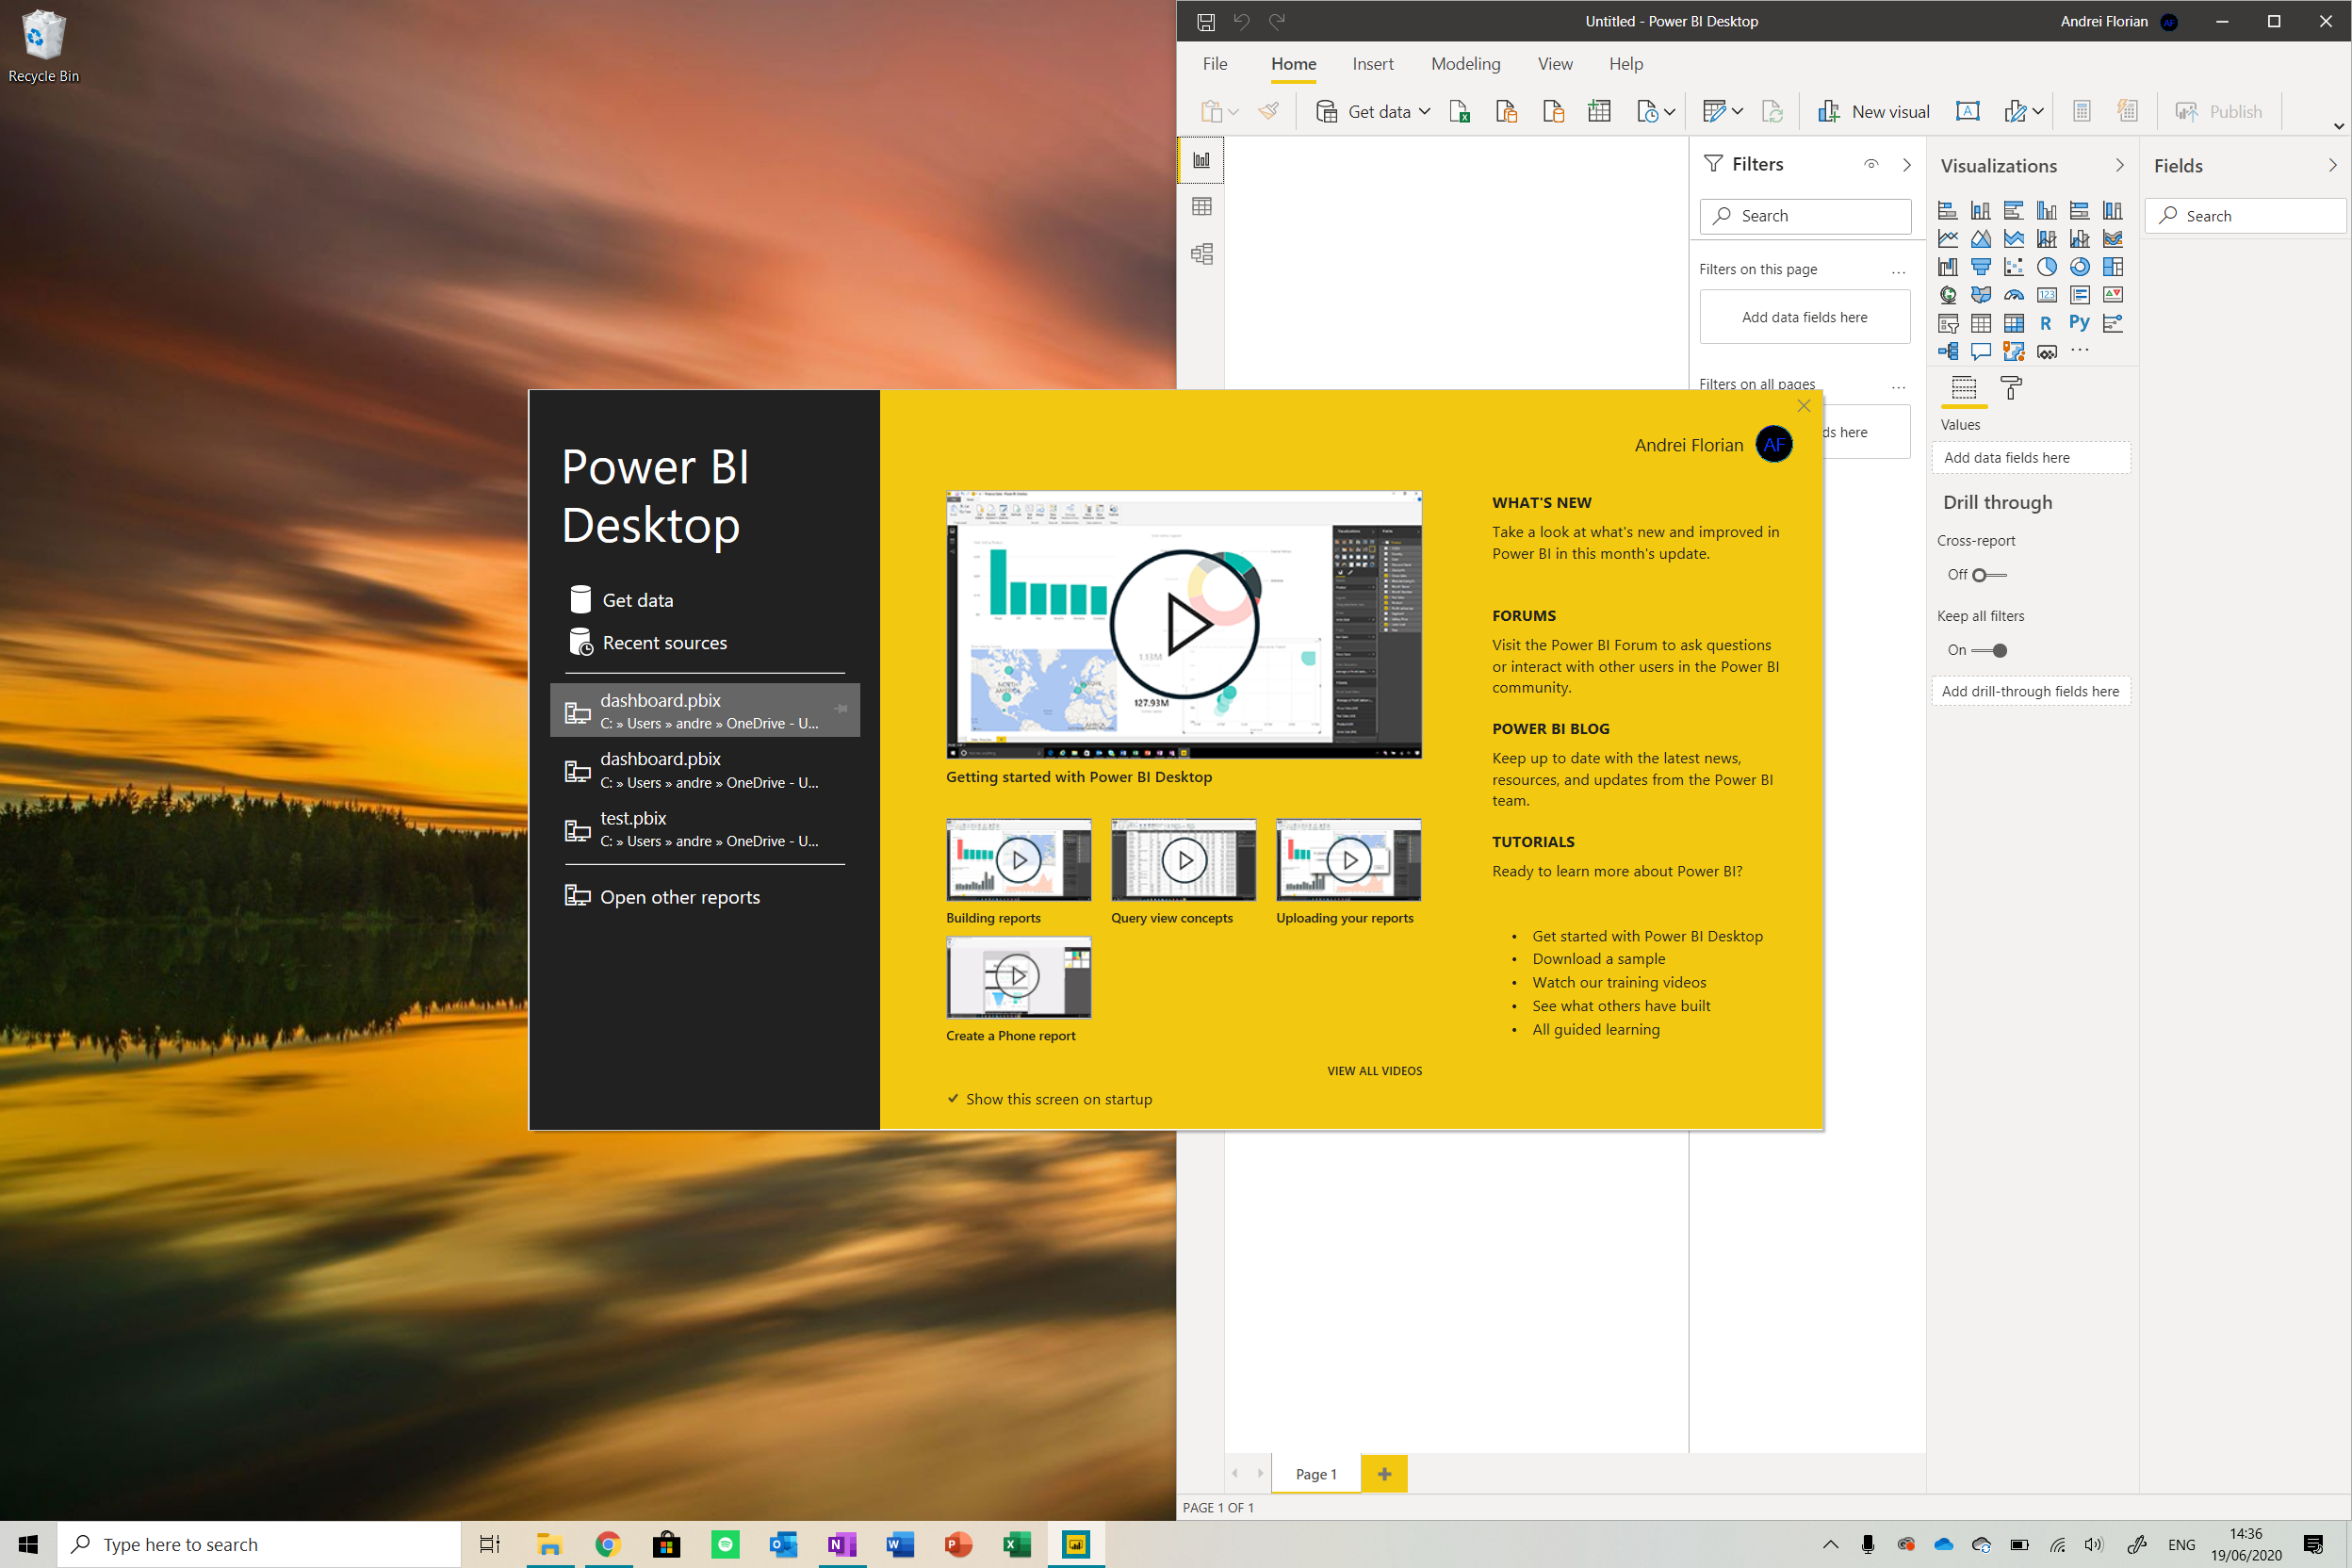
Launch the application and click on the Get Databutton . Now navigate to the Azure option and select Cosmos DB from the options.

Now go to your Cosmos DB resource and copy the URI link and paste it in the field in Power Bi. Sign in if this is required.
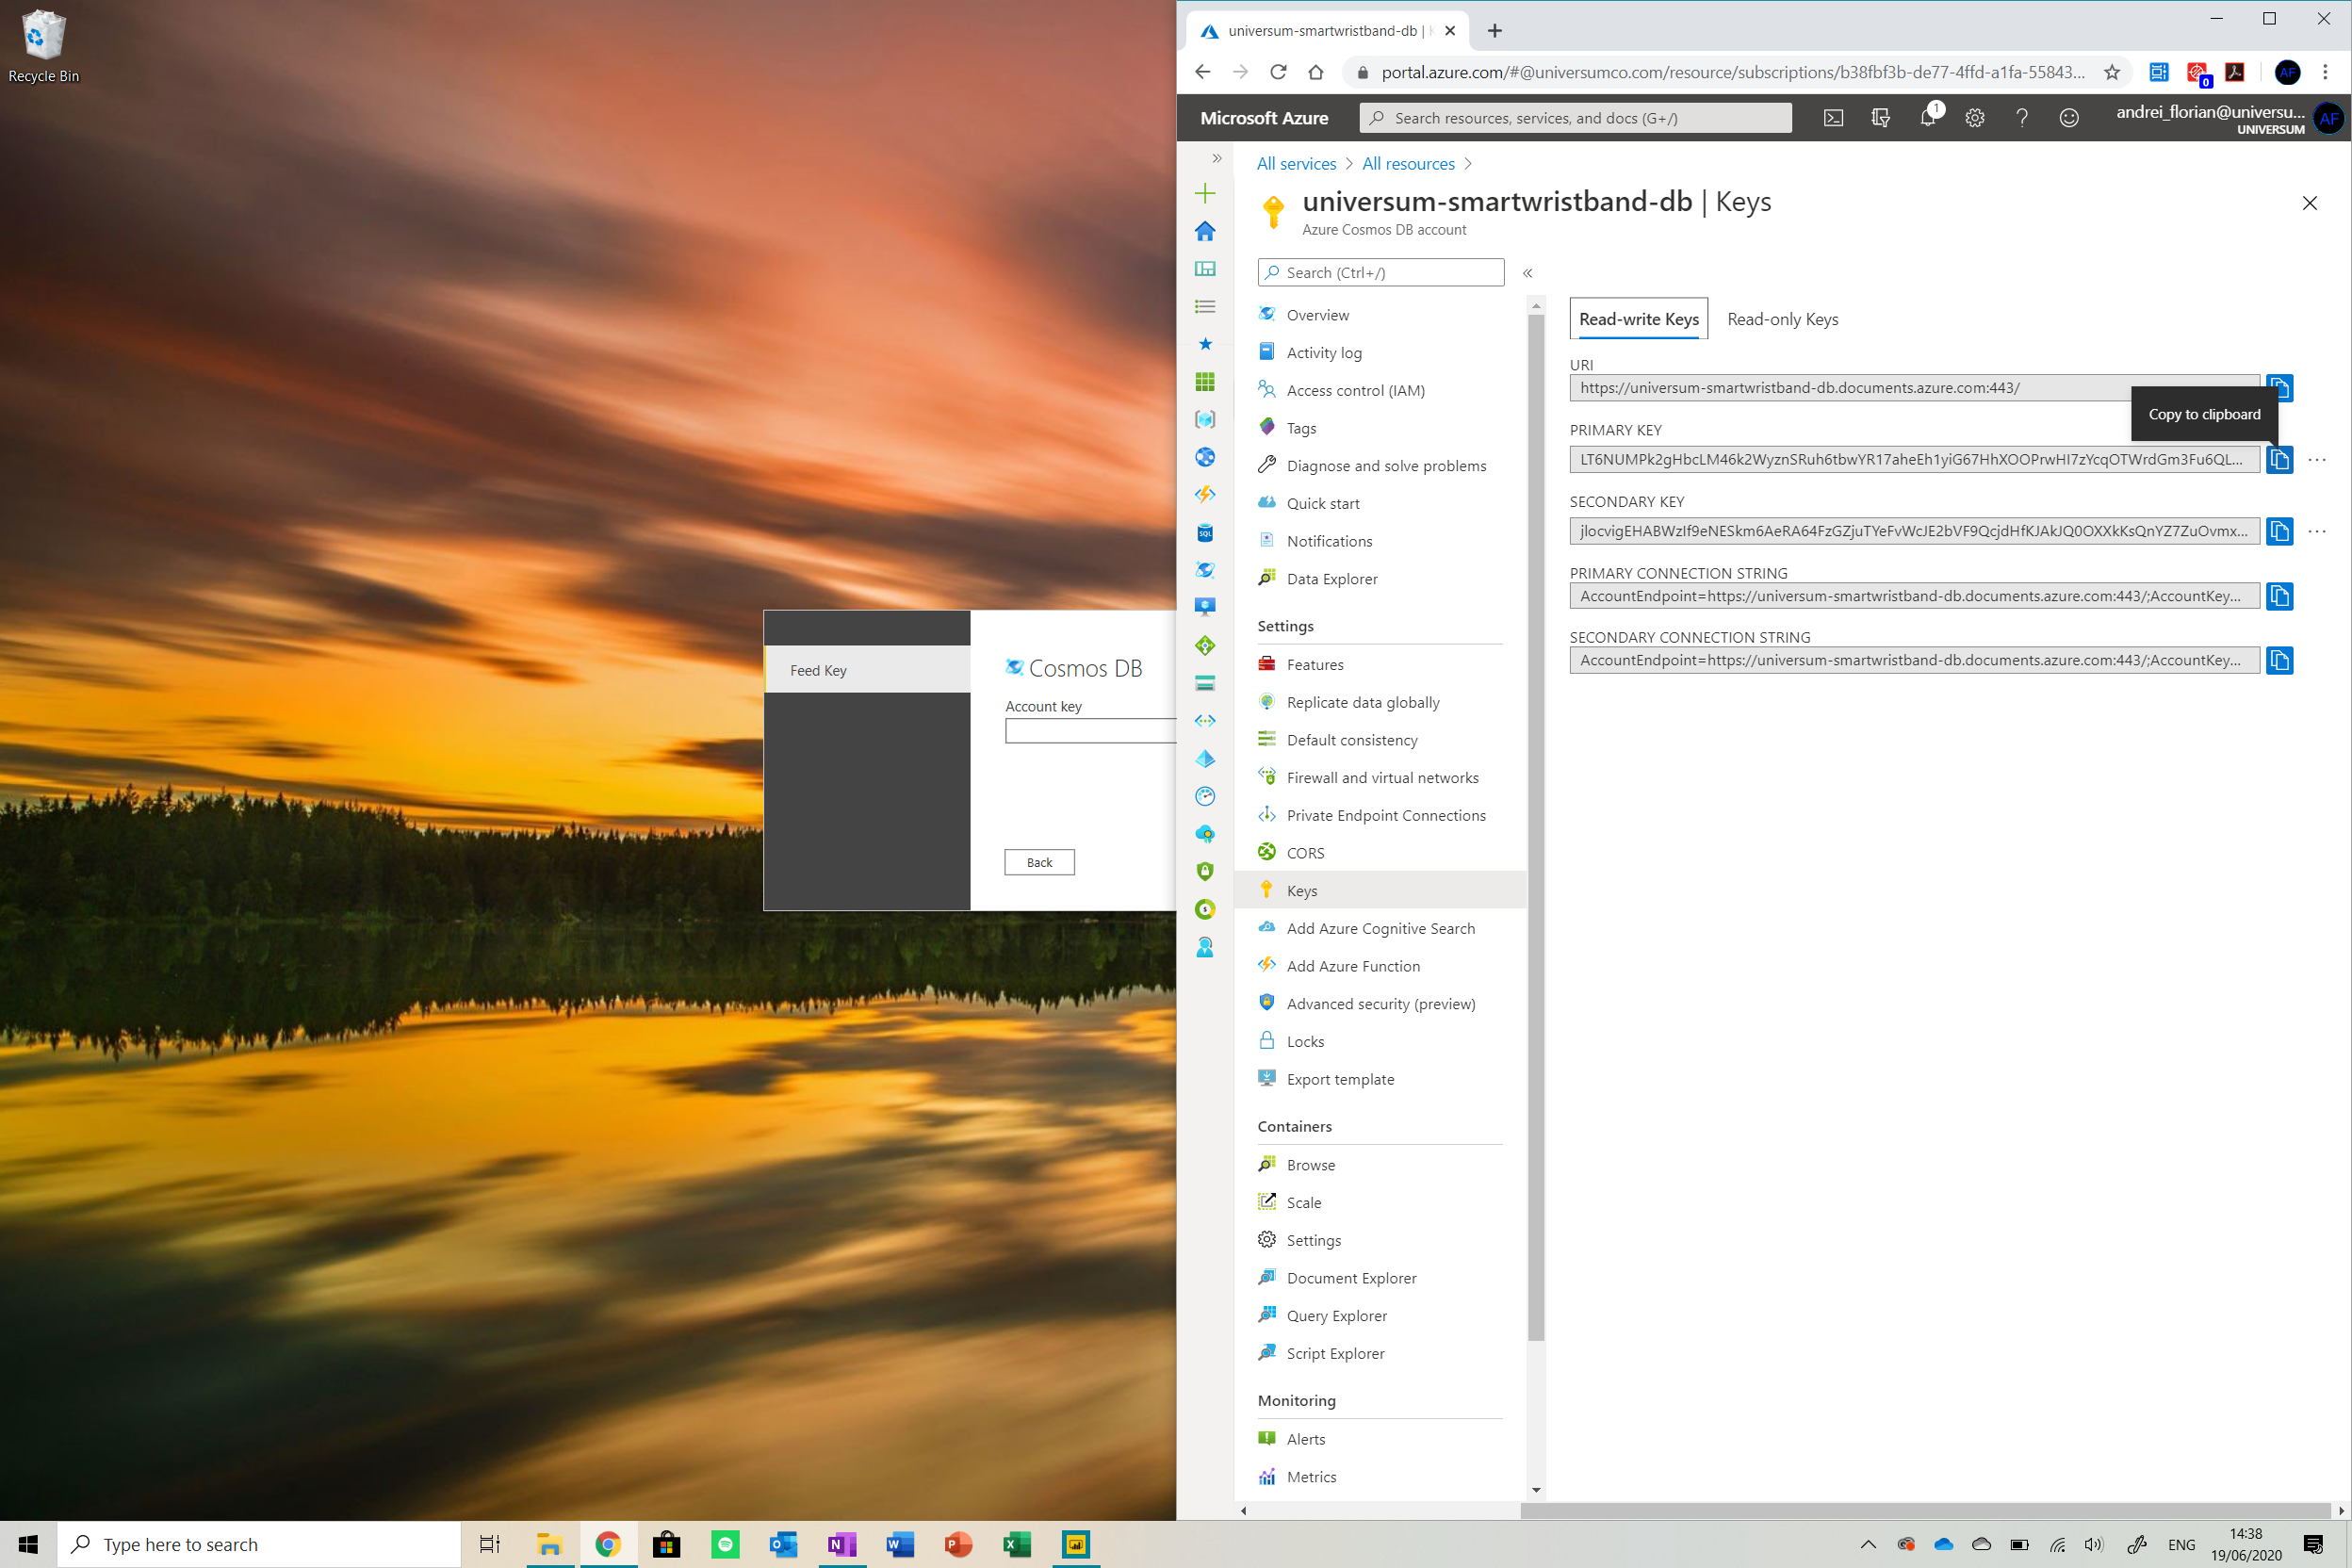
Now we need to go to the keys window in the Cosmos DB dashboard and copy the PRIMARY KEY and paste it into the Account Key field . Now navigate through the database and ensure that the datafile is checked. Click load and then we are ready to go!
Now that you are in the report, find the Transform databutton from the menu at the top of the screen. Click it to get a table with data.
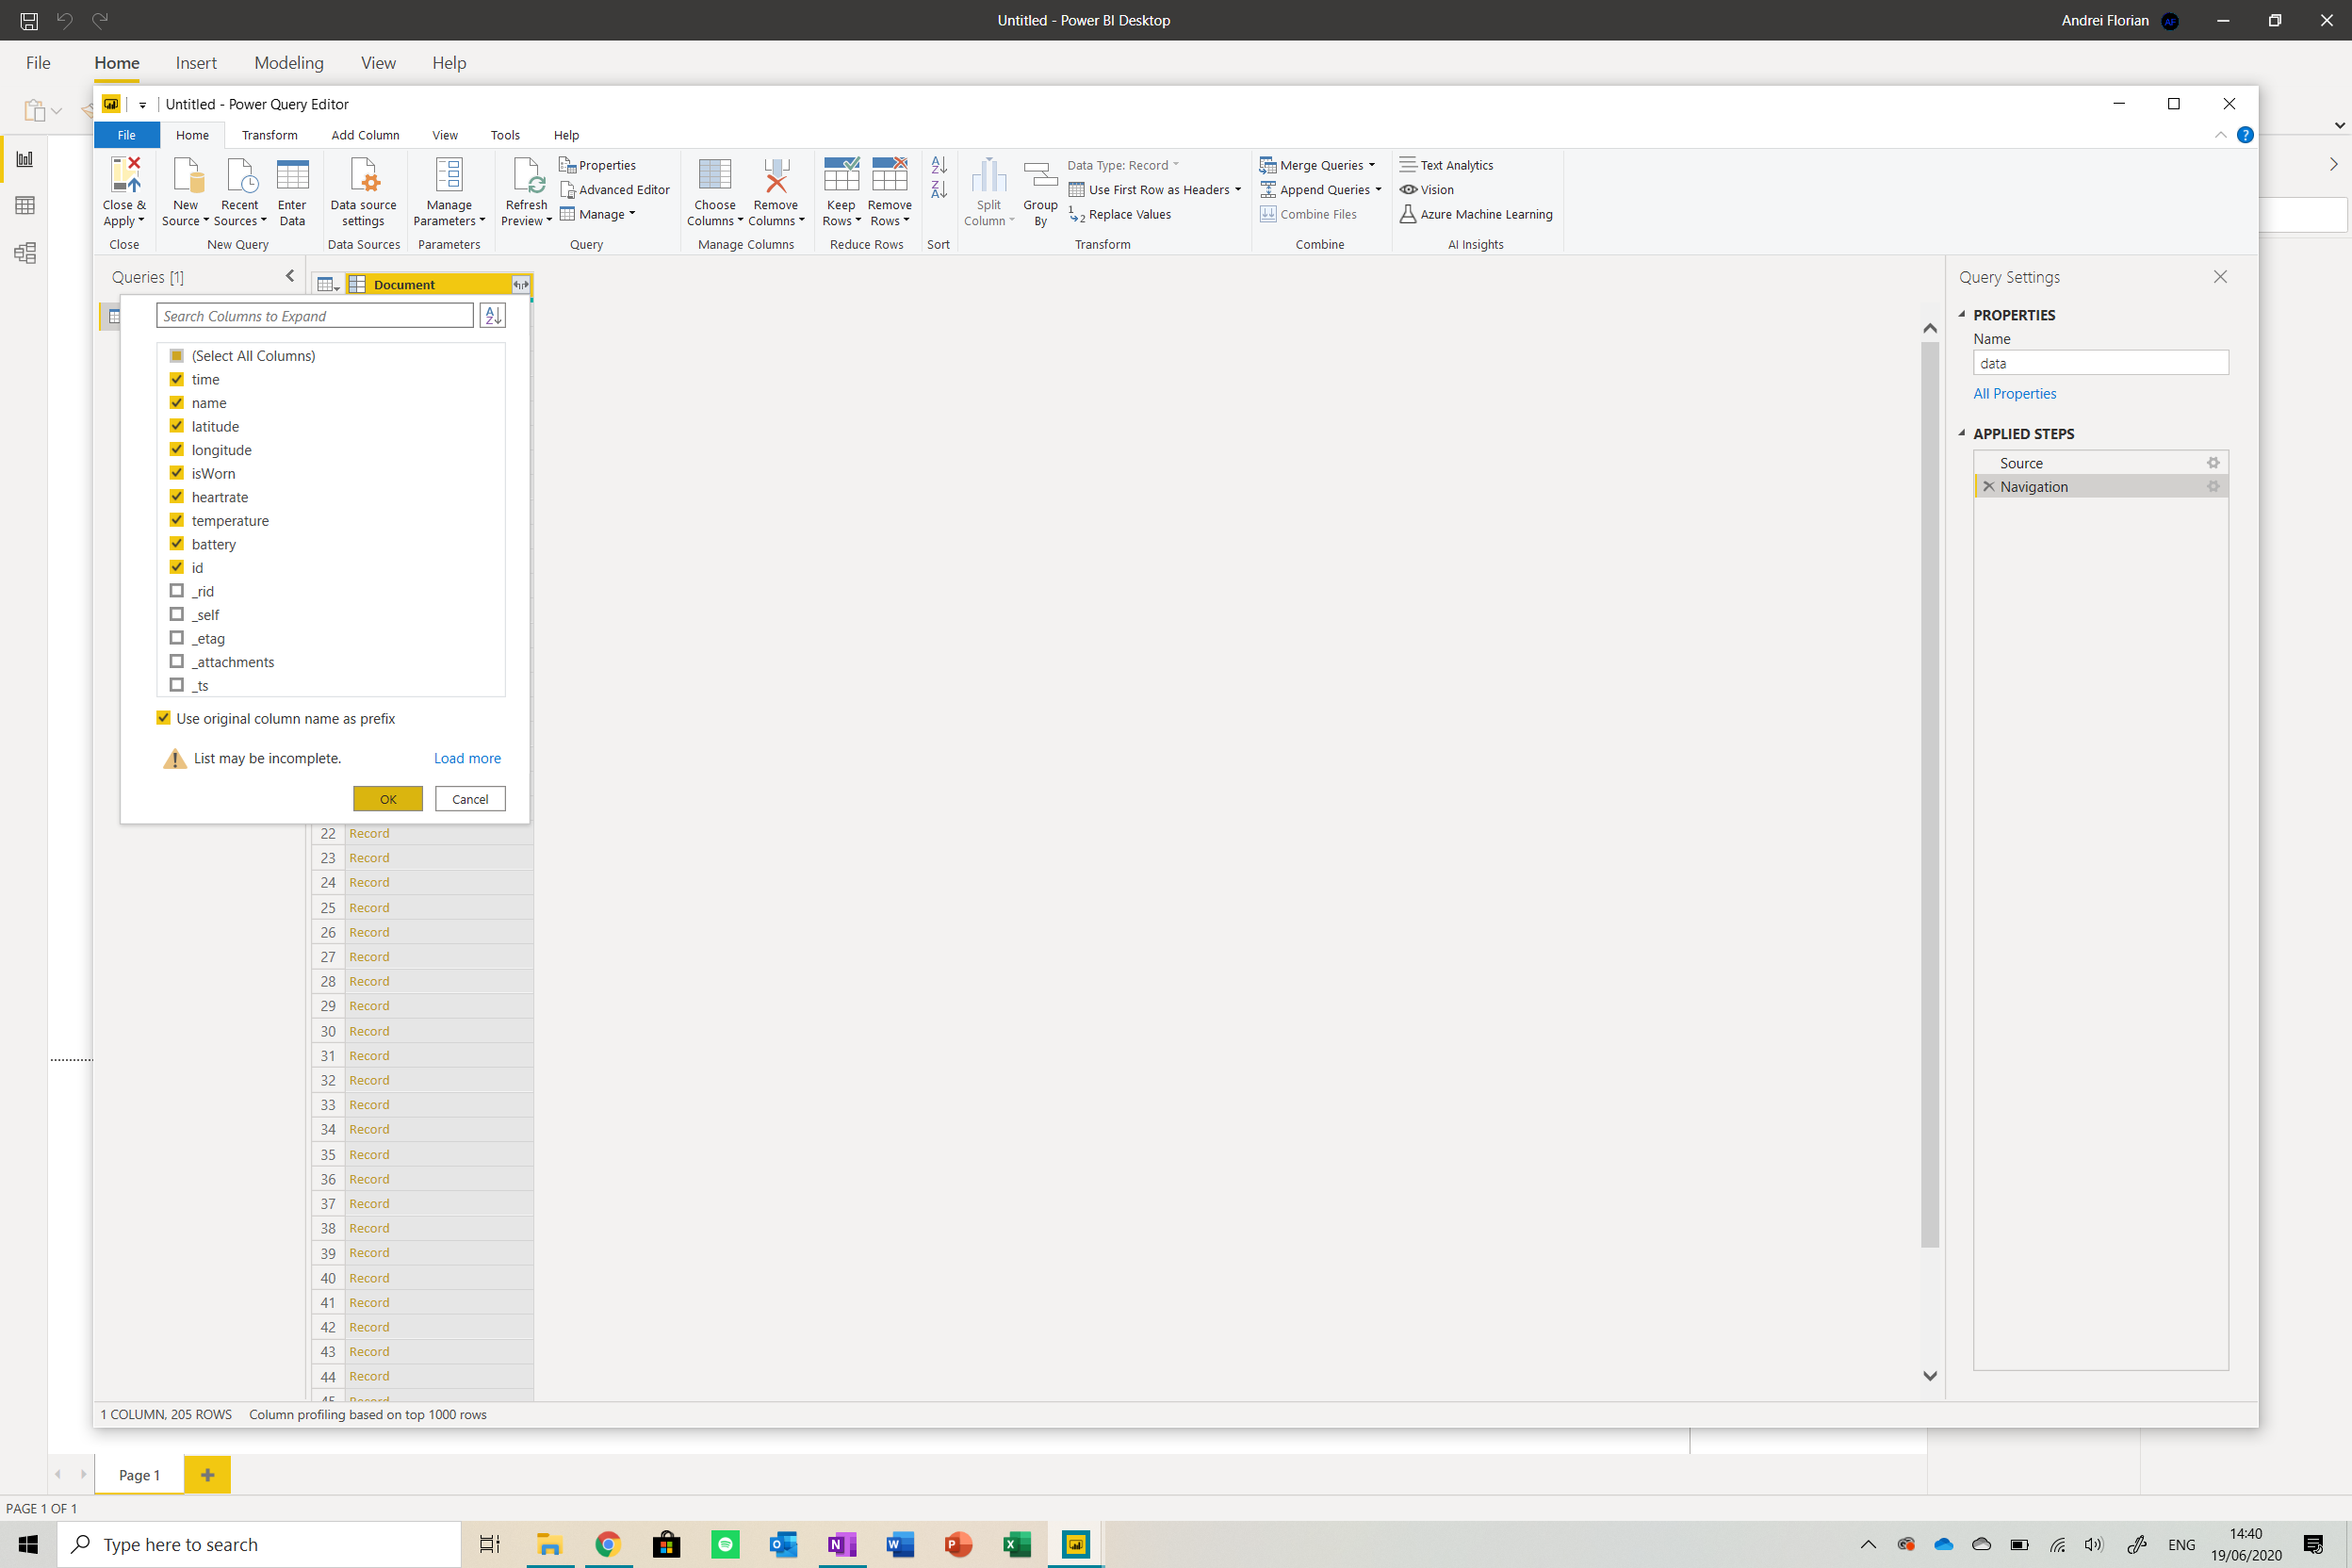
Click on the button next to the title of the table and select the fields shown above. You should see your table expand.

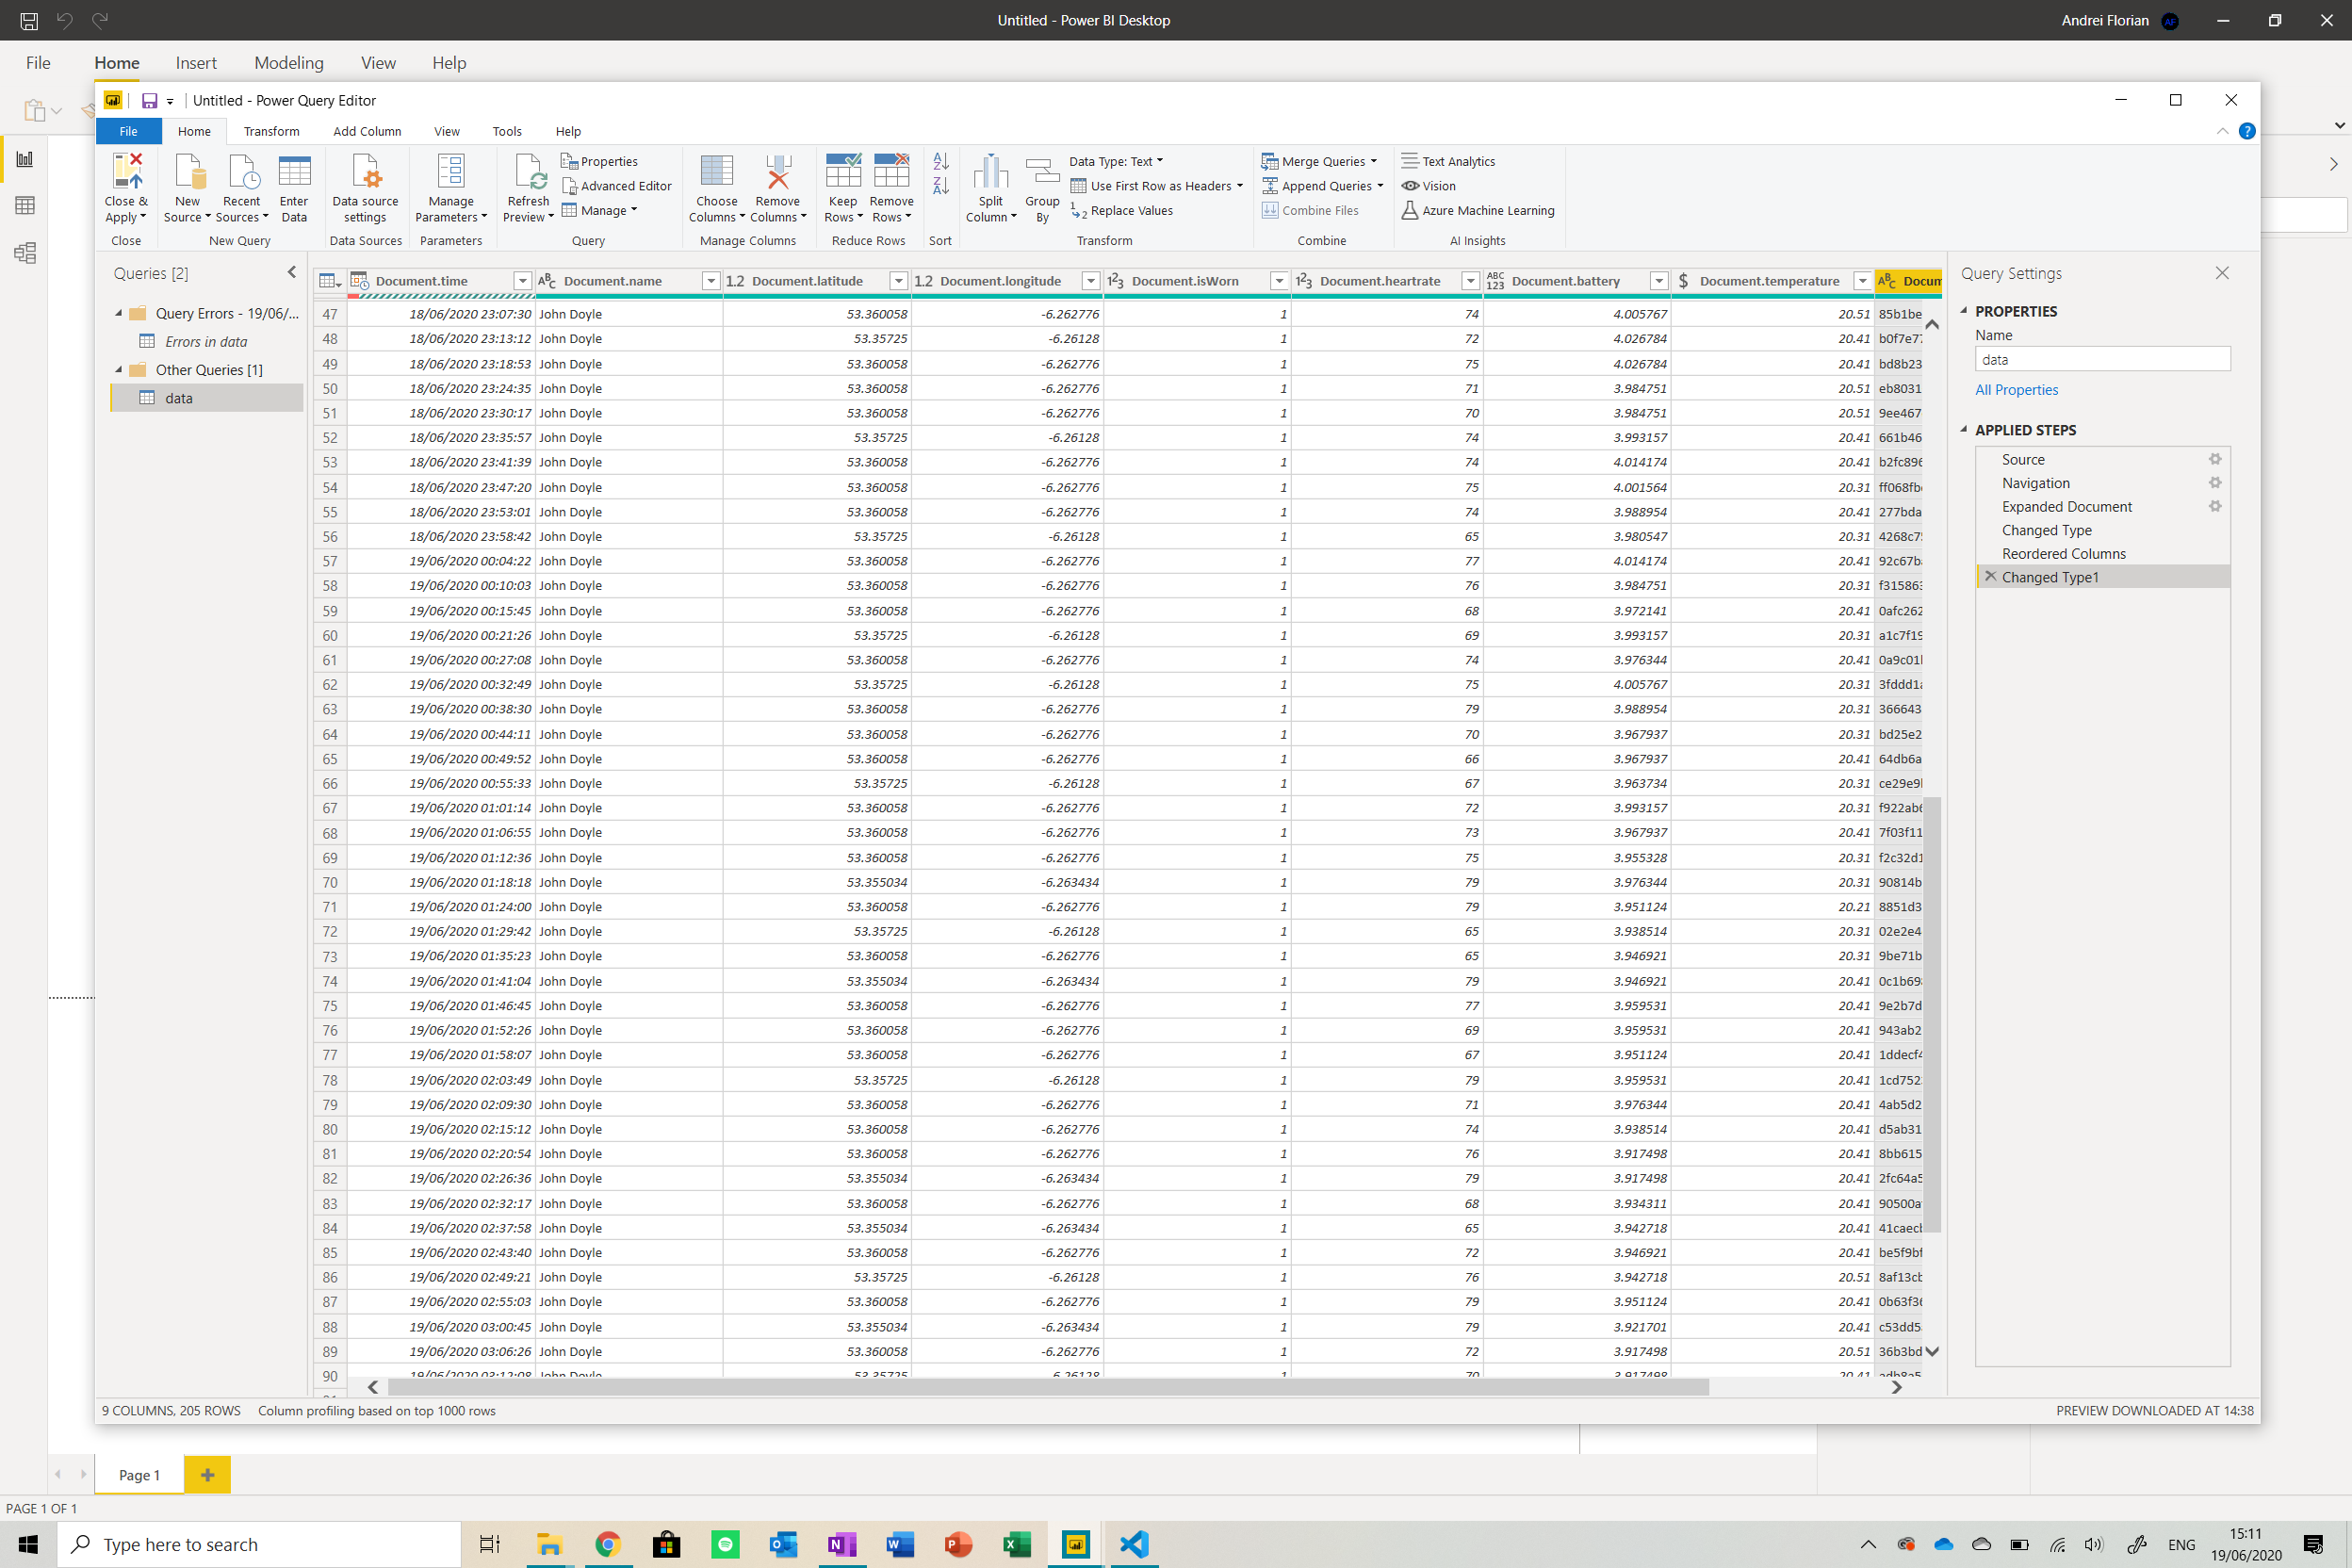
Now we need to change the data types of the rows. Identify the Data Type button from the menu at the top of the screen and change the values accordingly.
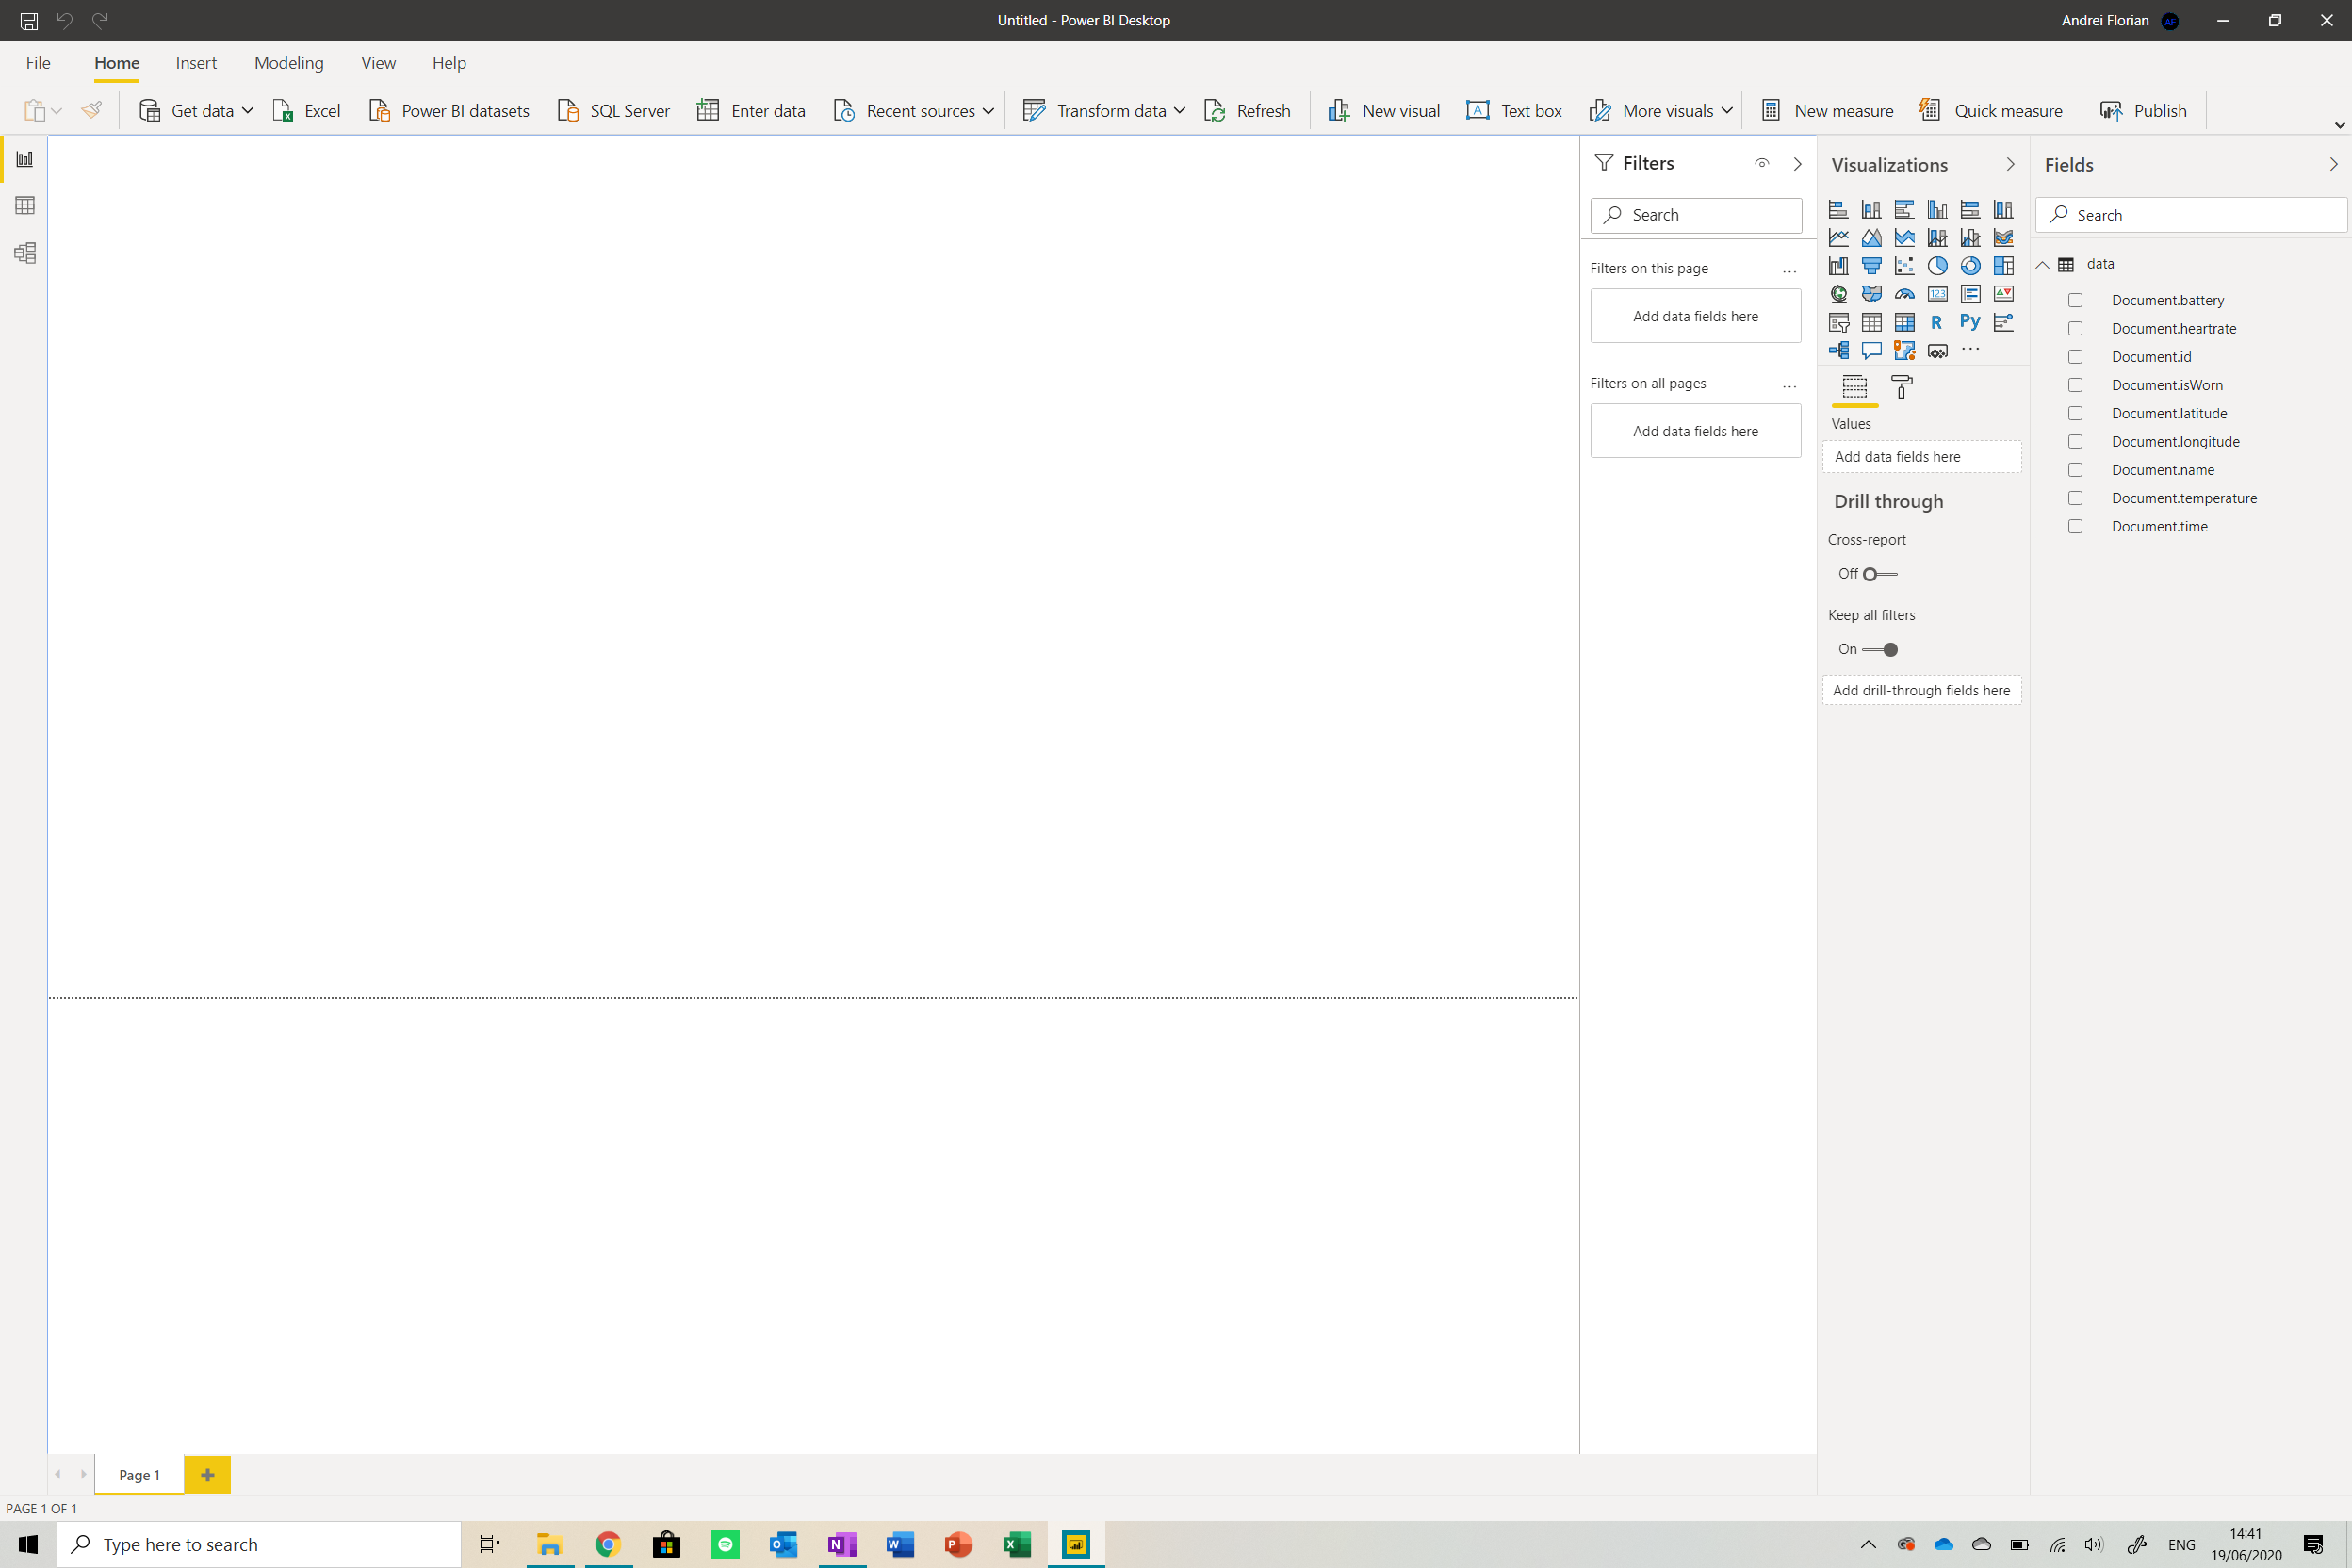
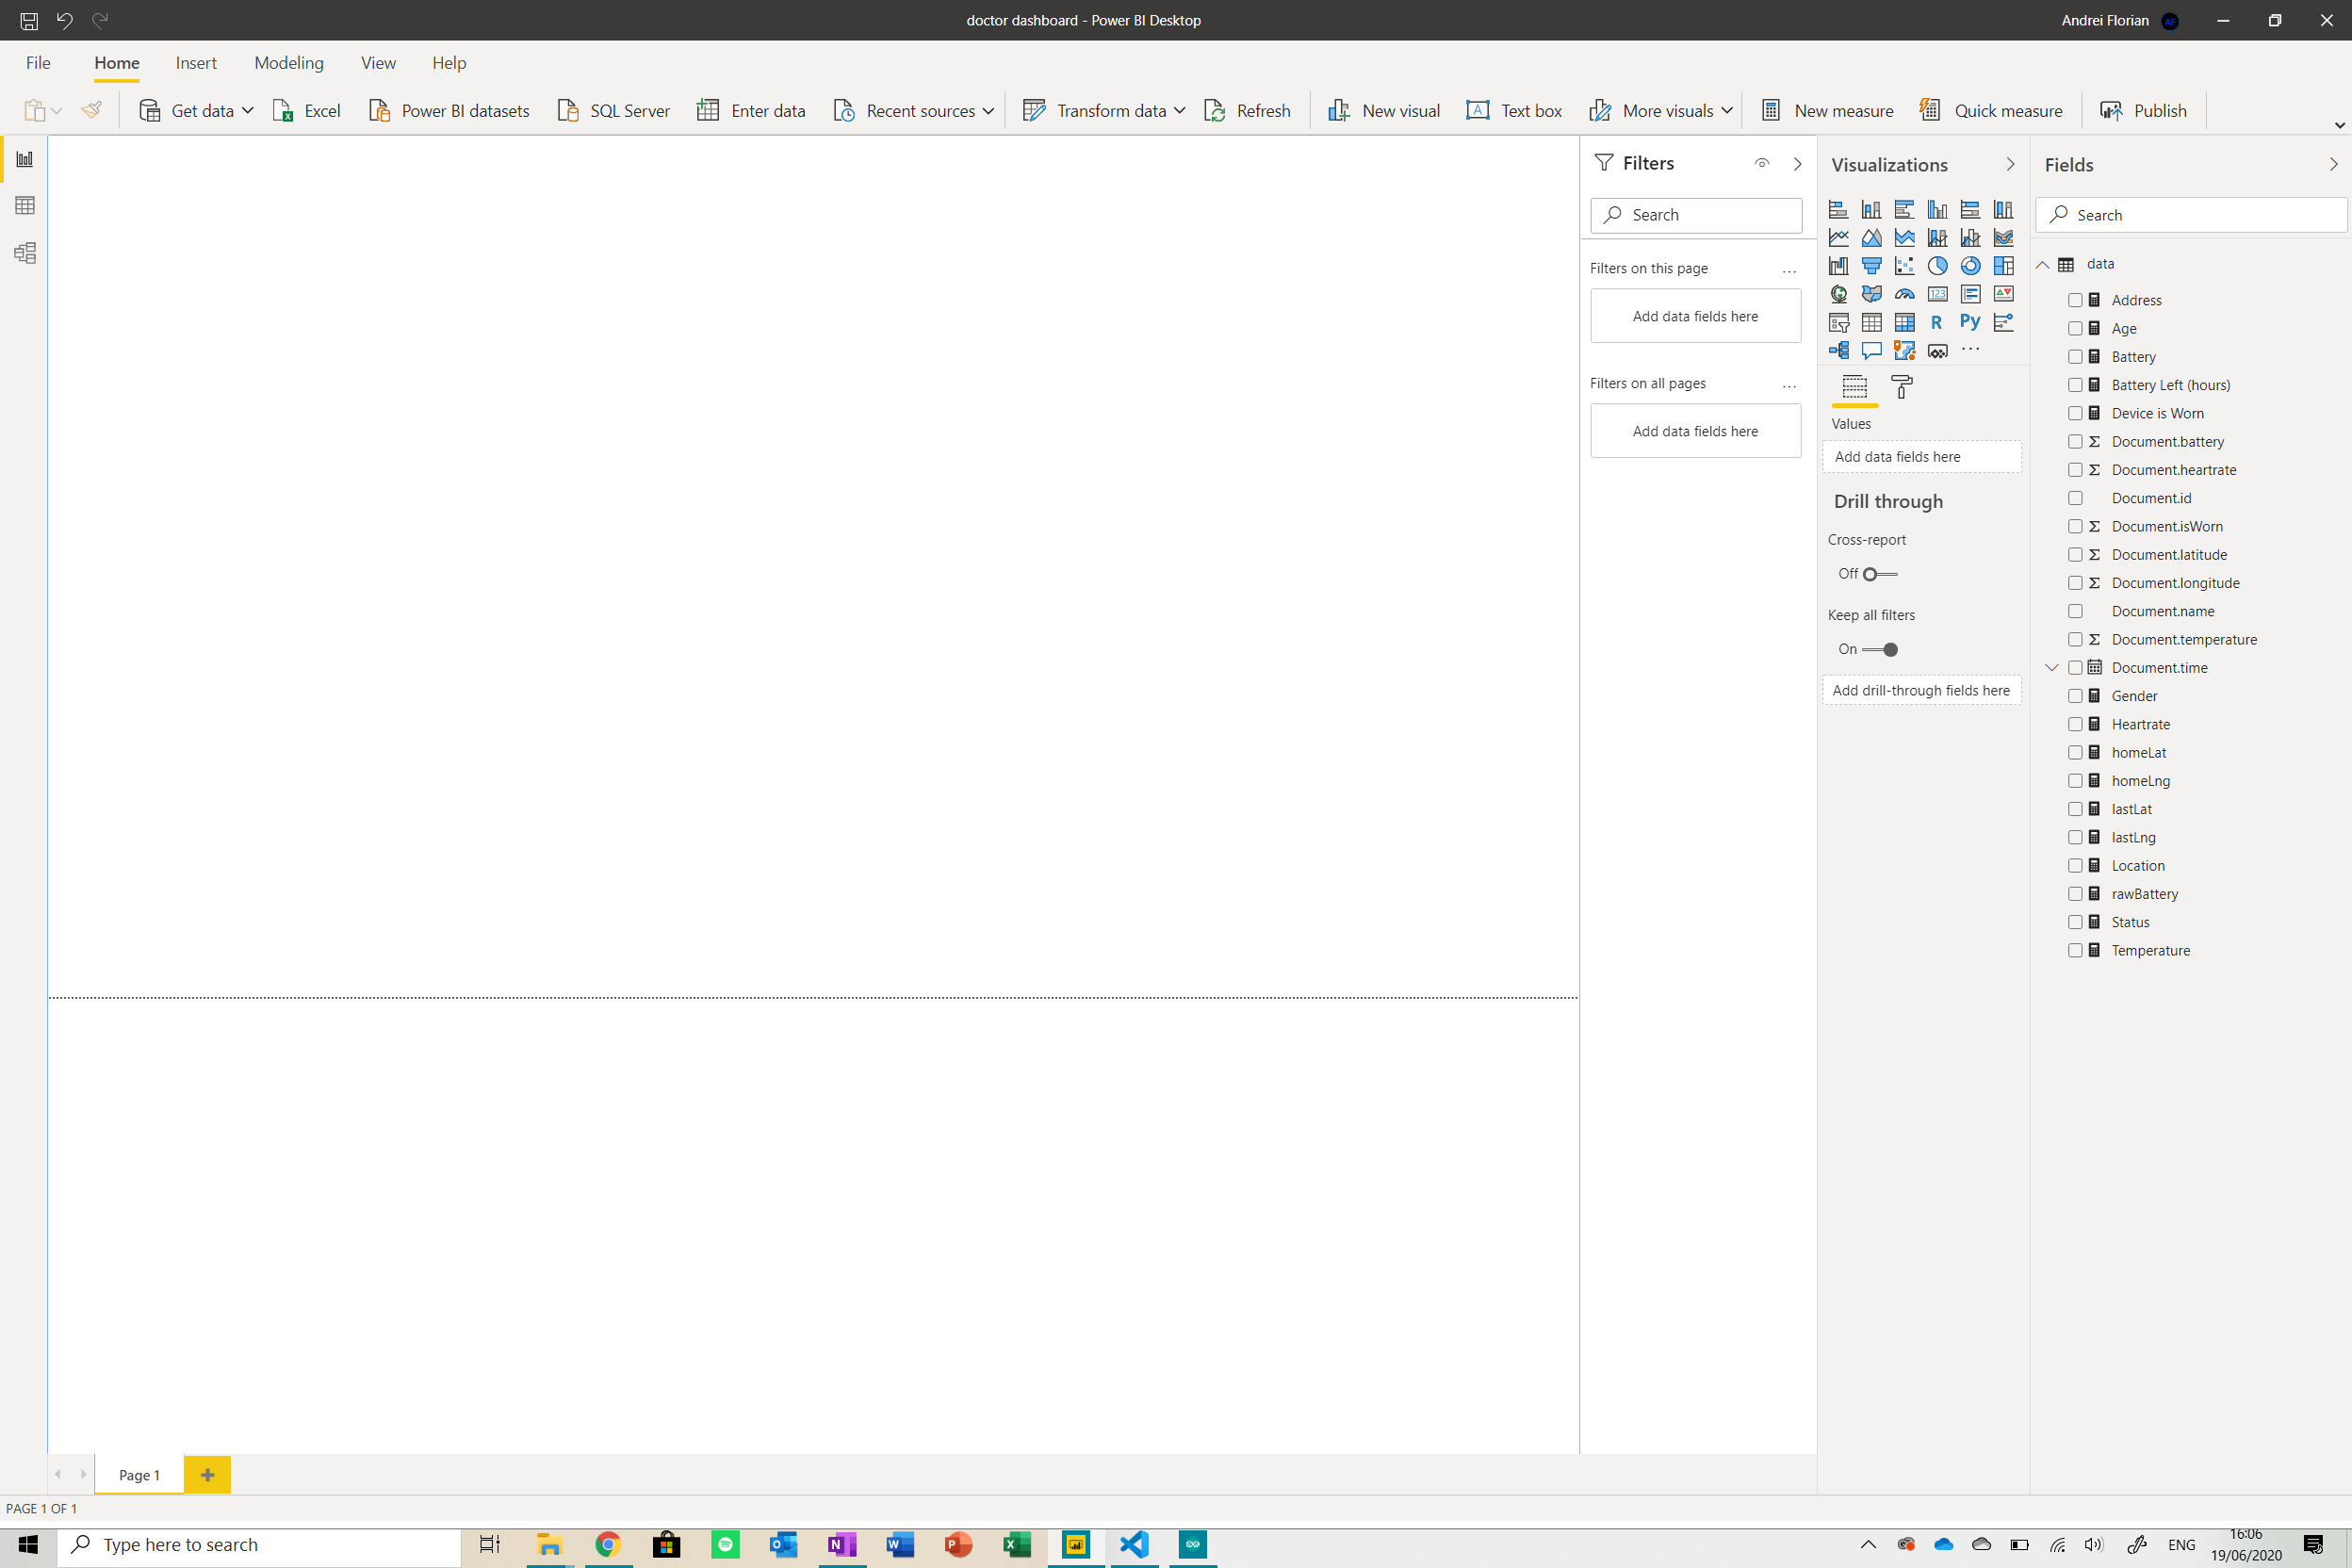
Now click on Close and Apply and you will be brought back to the dashboard. Your dashboard should look something like this.
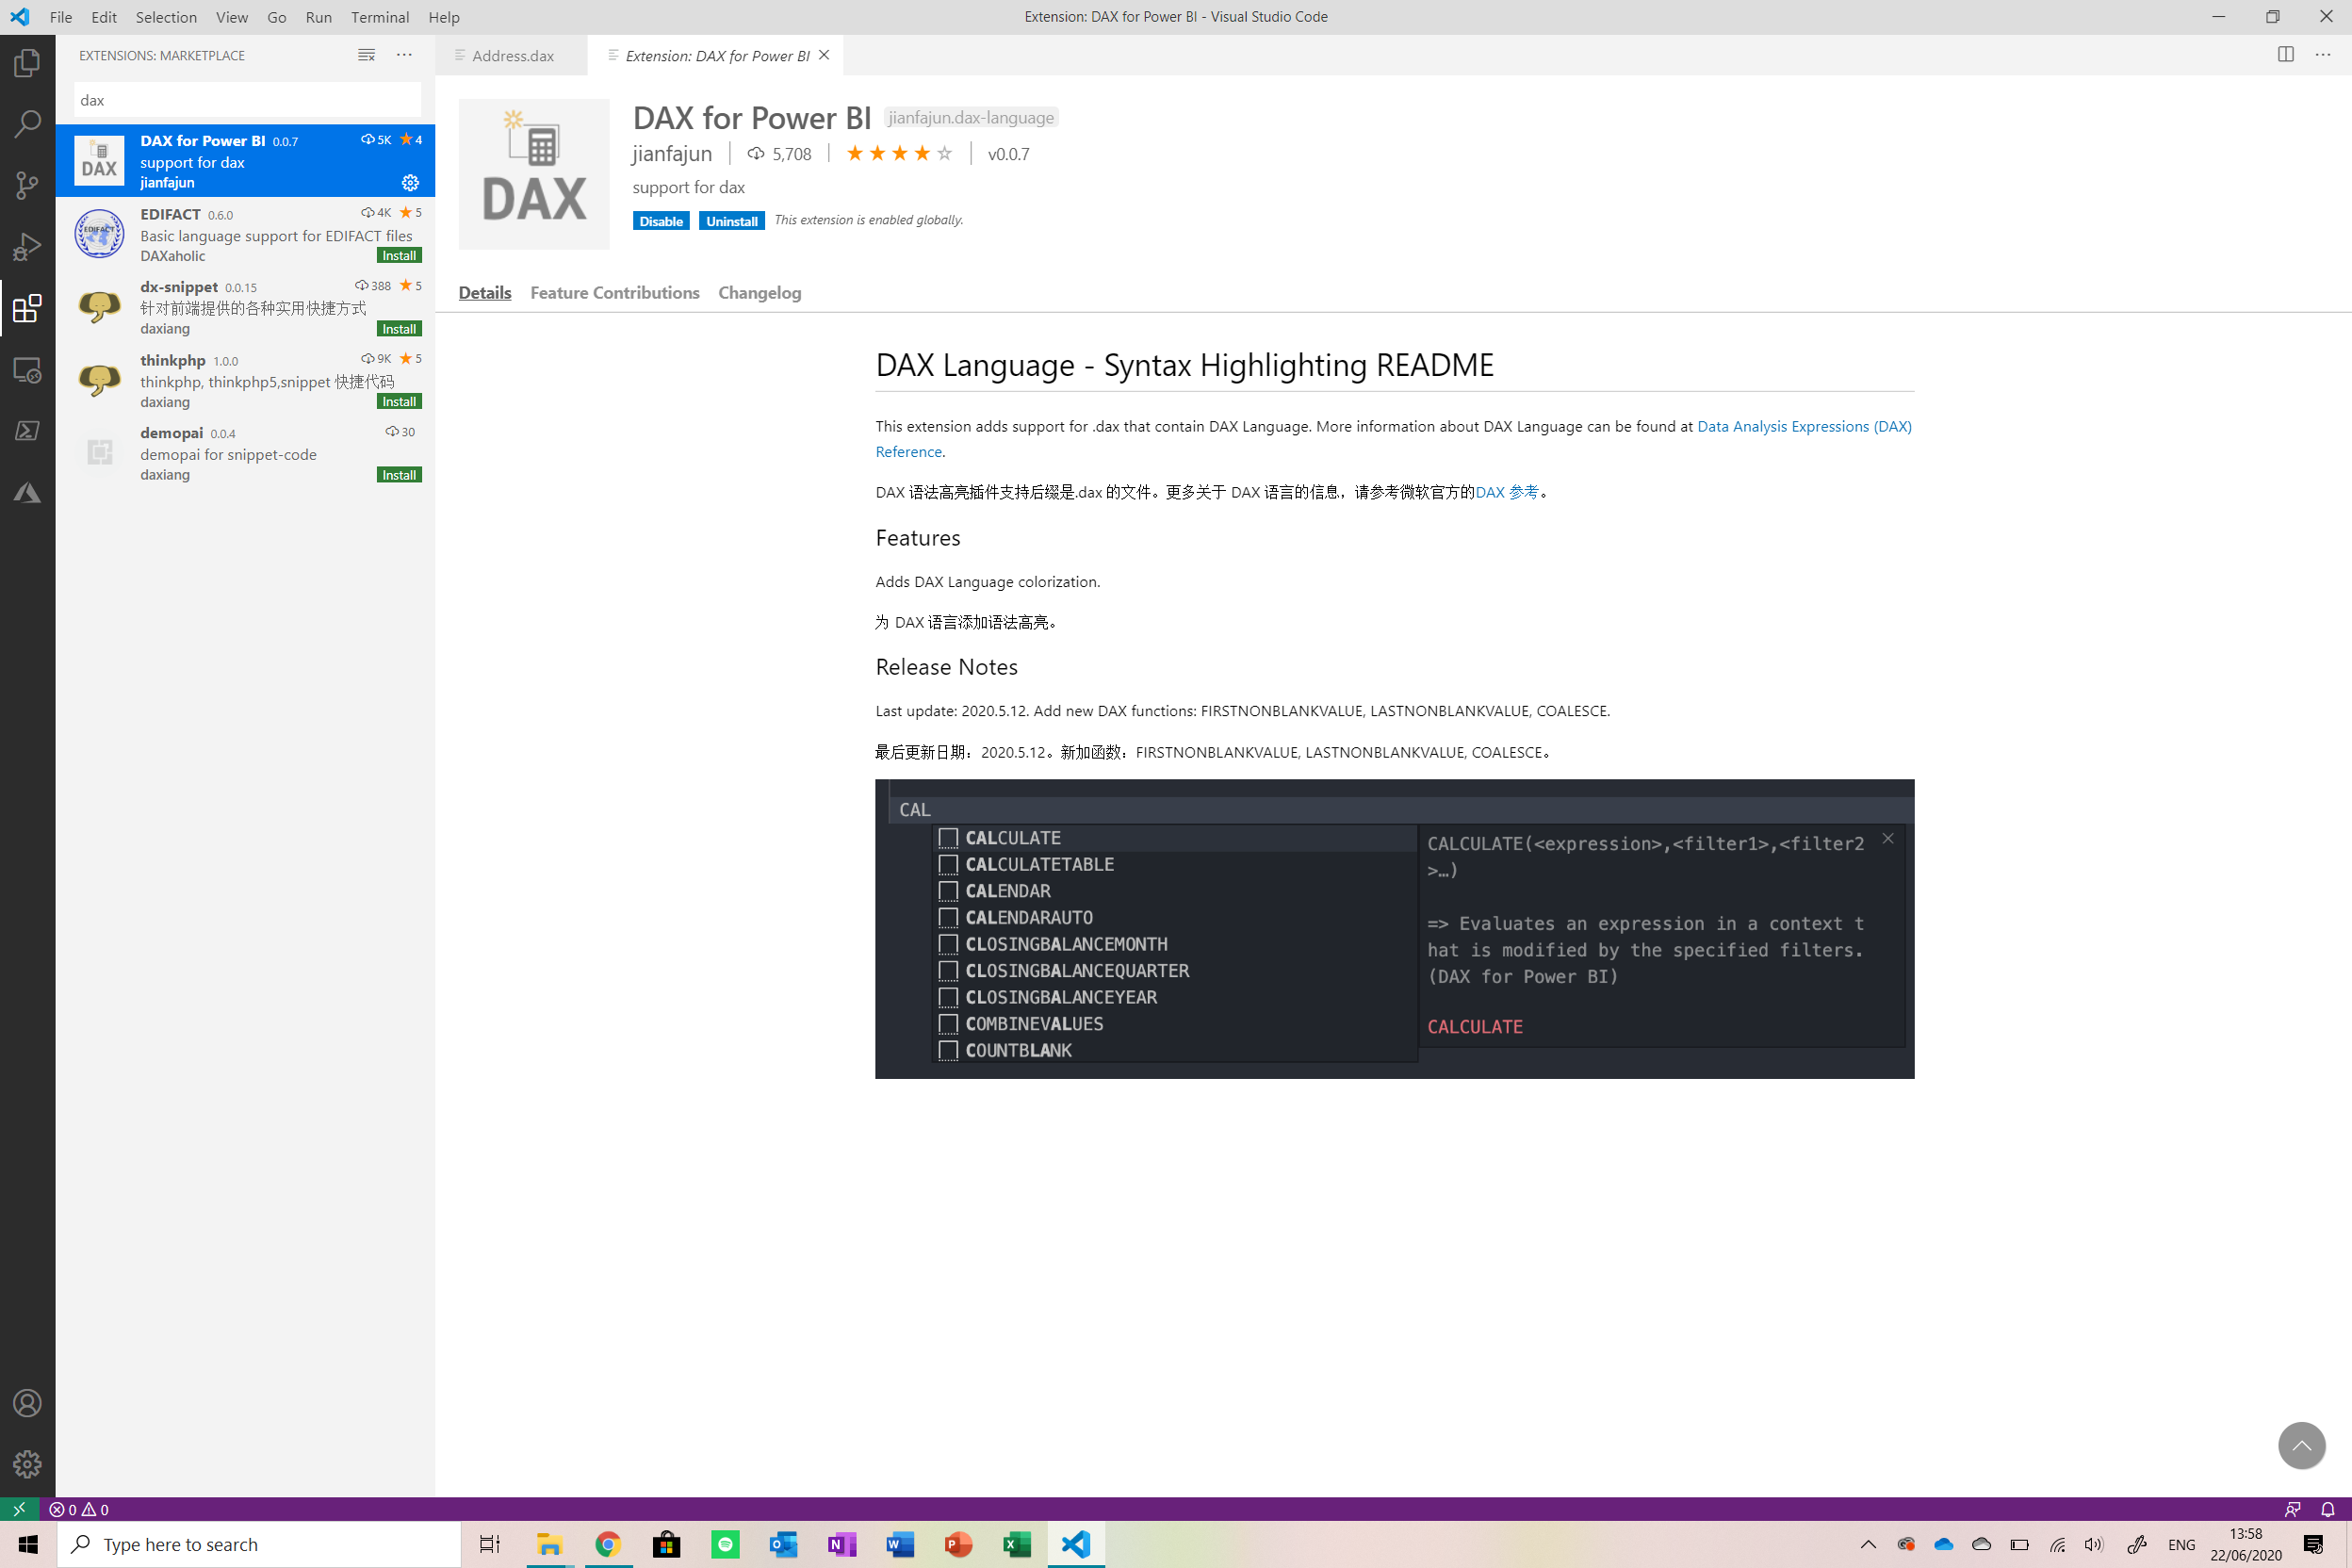
The next thing we will need to do is create measures to process data and convert it into different forms in the report. Open the Stream Analytics Script folder from the GitHub repo in Visual Studio code . I installed an extension called DAX for Power Bi to get context highlighting:
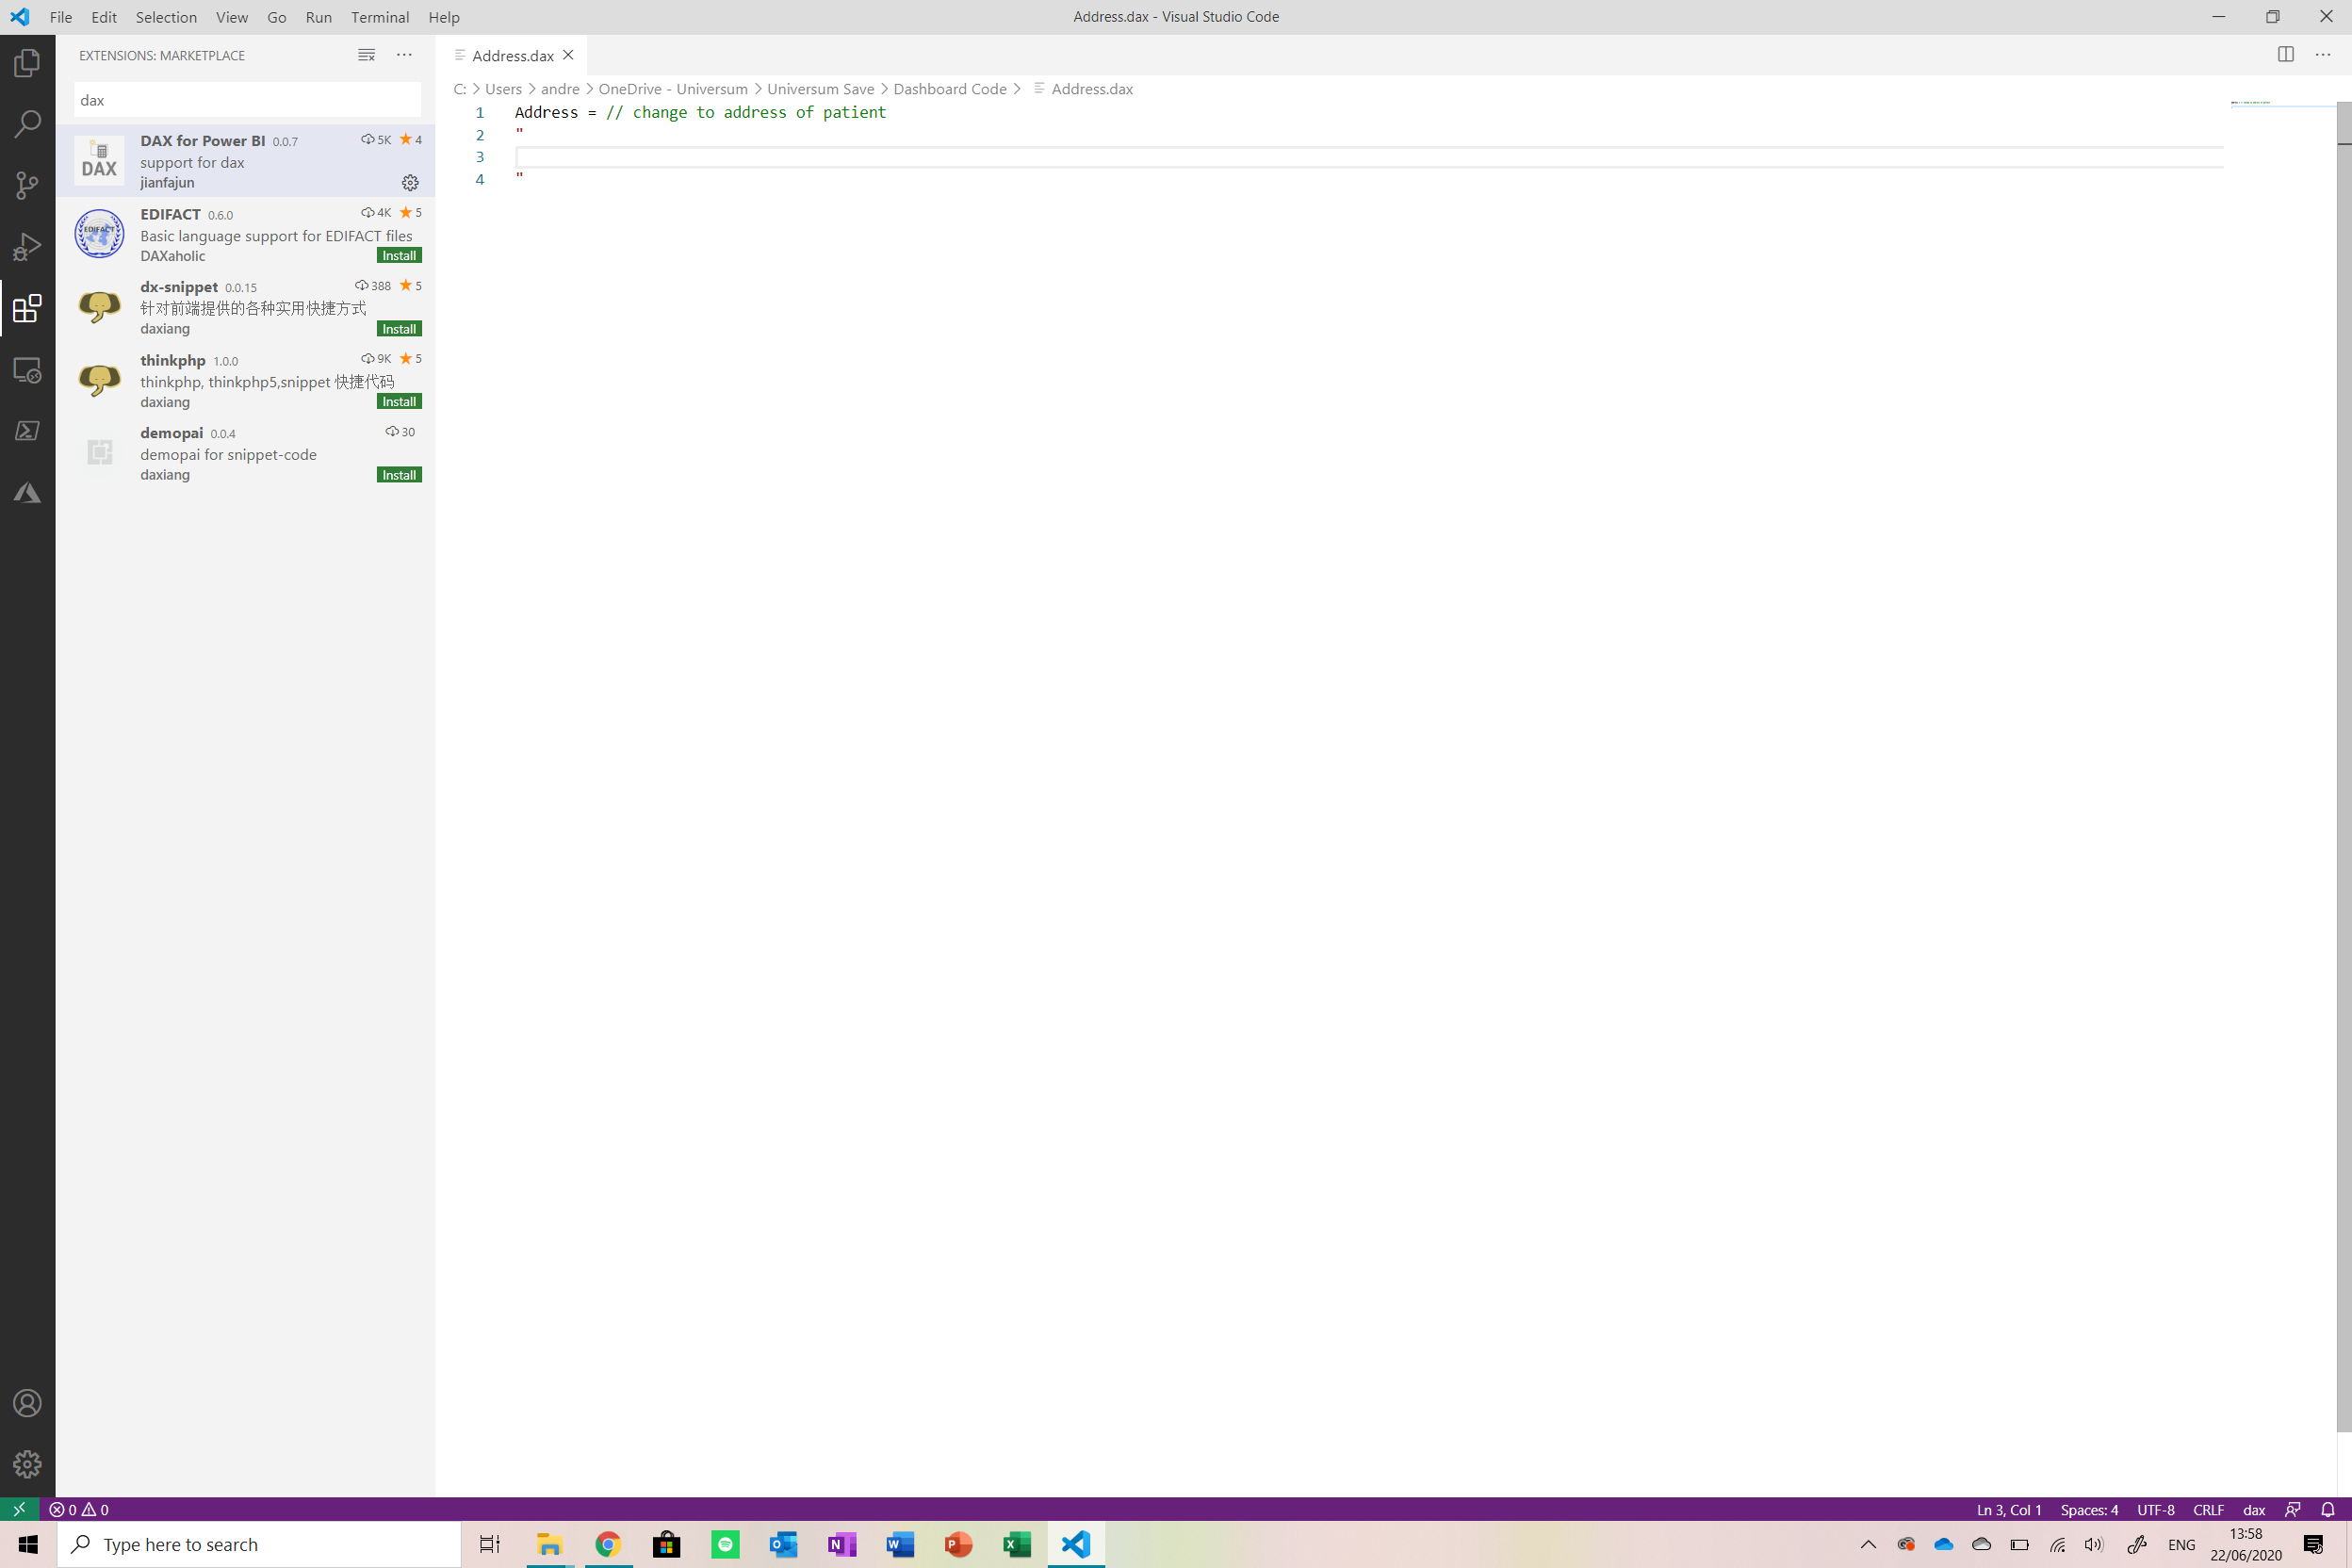
There are a number of files which have to be edited specifically for the patient as they hold the patient’s information. The list of files that must be edited is below:
<울>Open these files in VS code and edit them there.
Now we will create new measures in Power Bi using these files. To do so, open the Power Bi report and click on the New Measurebutton from the menu at the top of the screen.
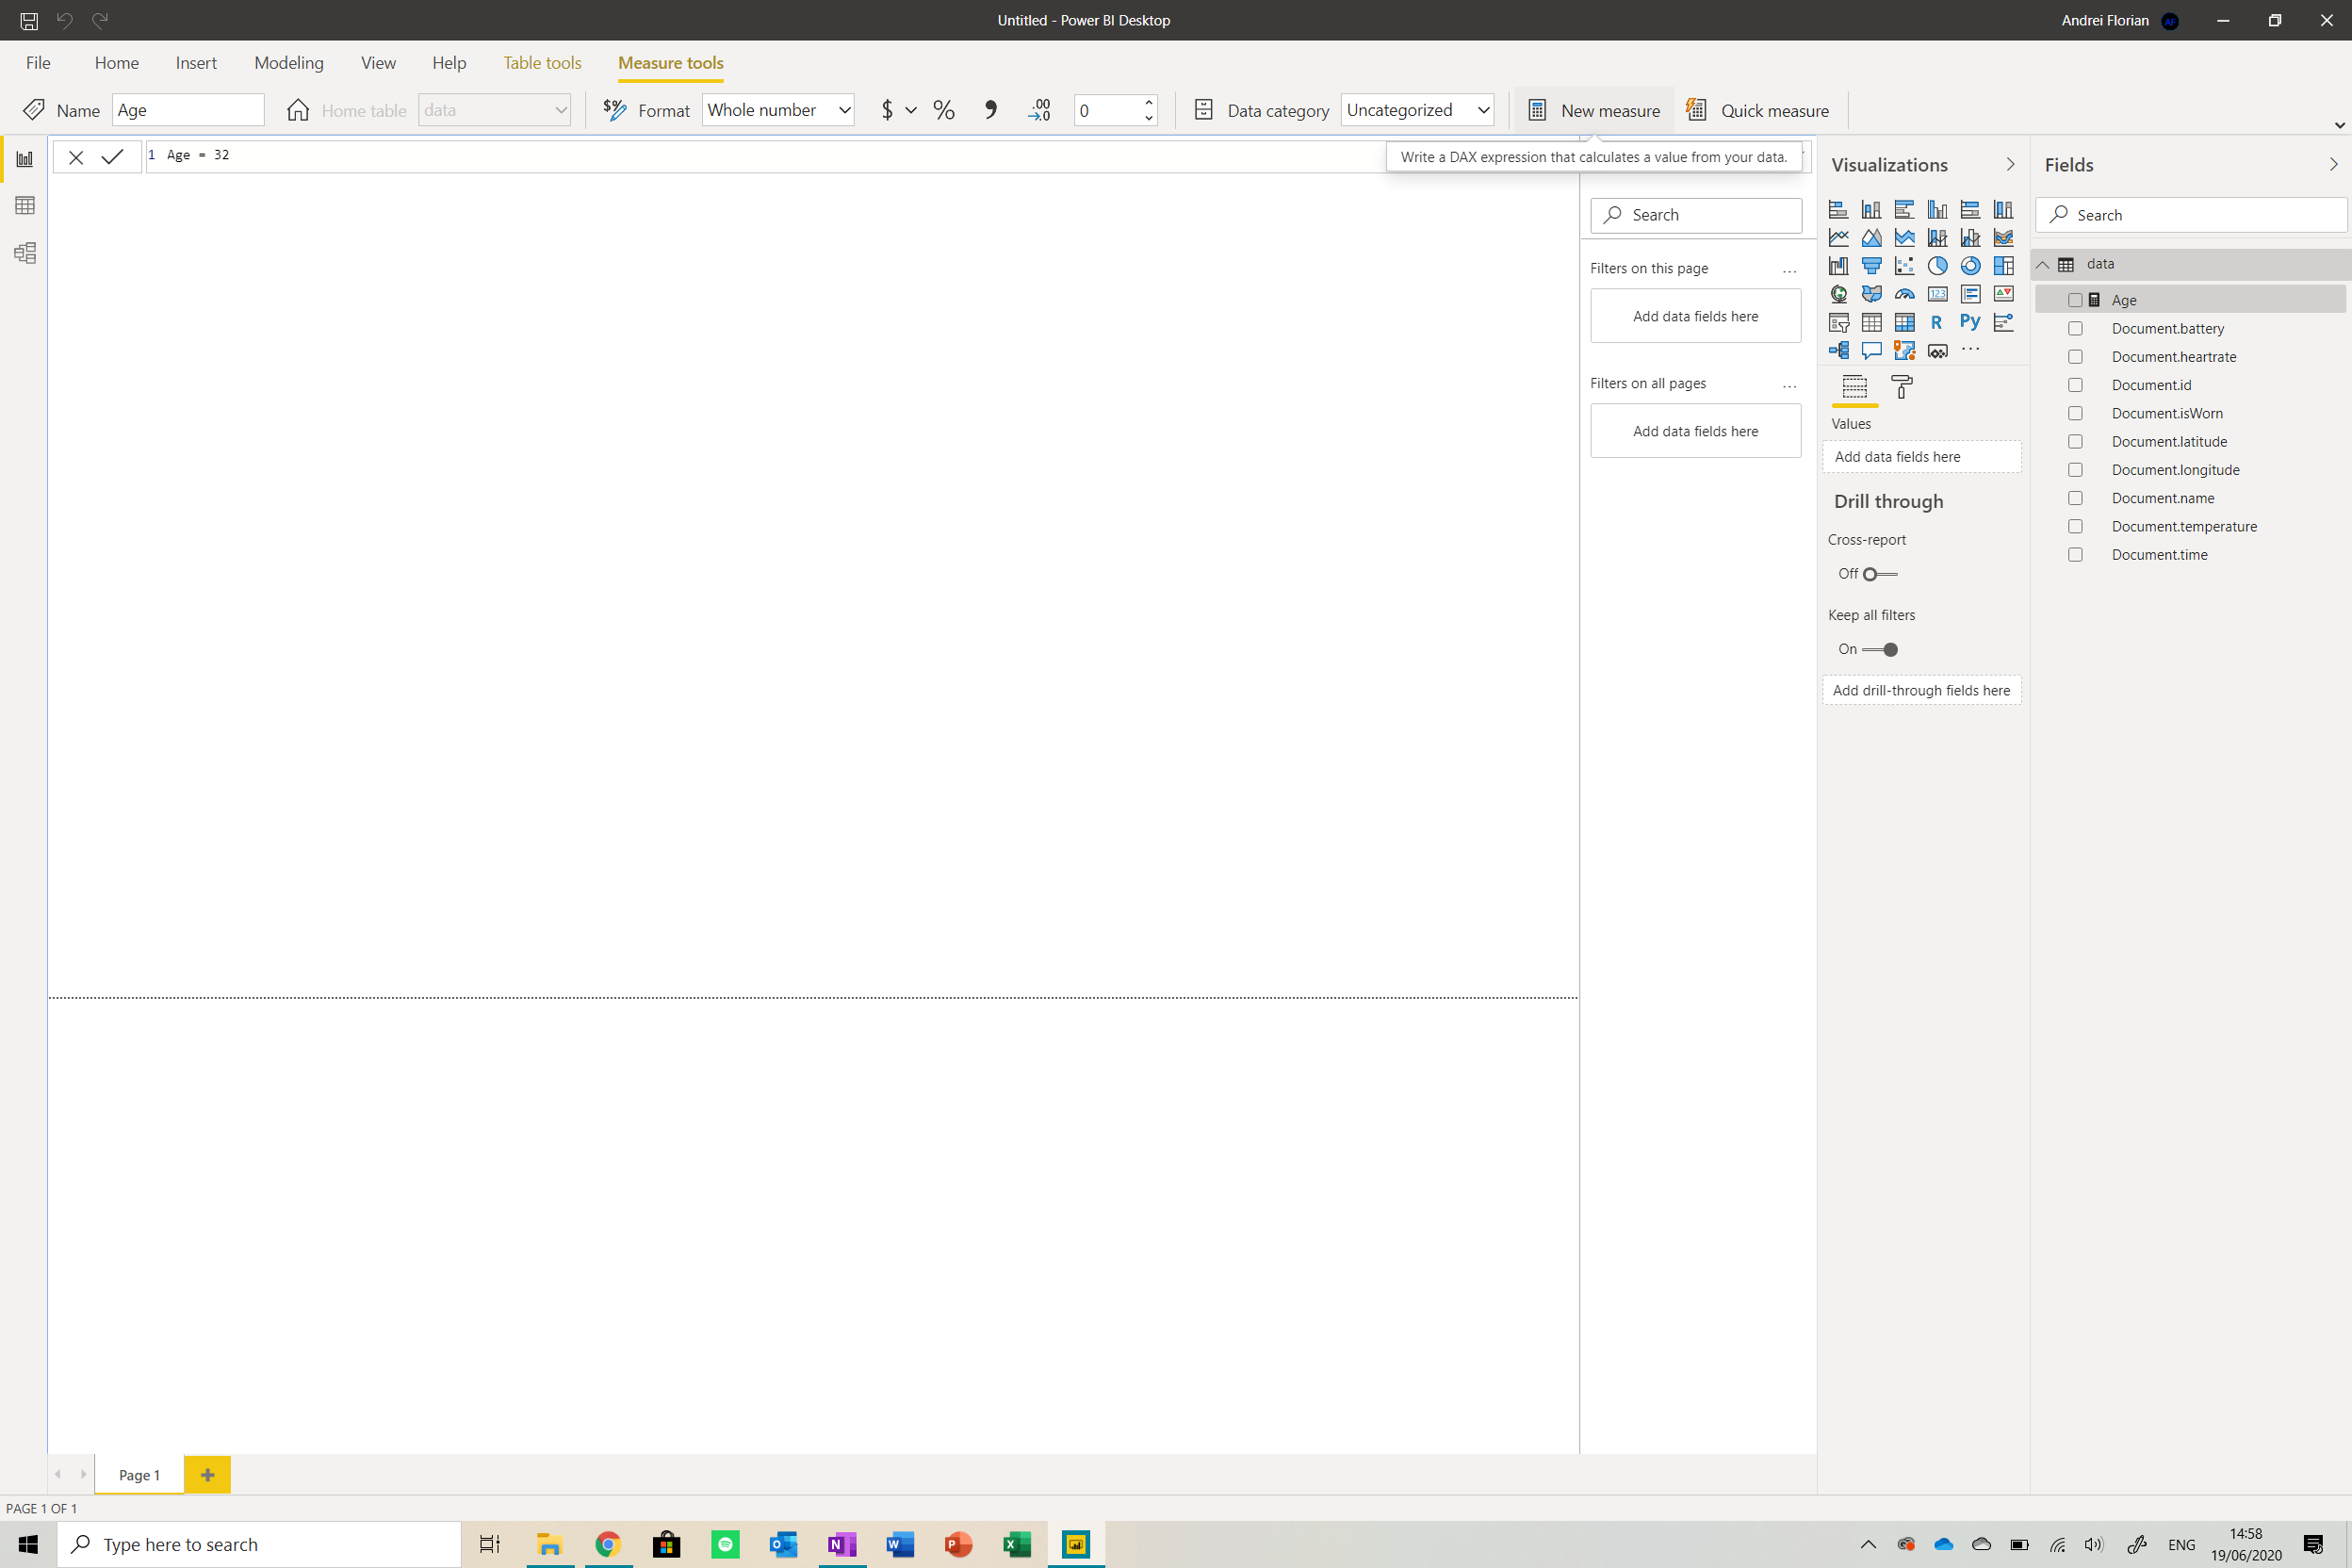
Copy and paste the first file’s content into the text bar. Ensure that the Format and Data Category are set accordingly (i.e. set the category of latitude data to latitude). Now repeat this step for all other files , creating a new measure for each . Your dashboard should look like below:
Now we are moving on to the fun part – designing the dashboard. Please look at the tutorials below to get an idea of how to create infographics and style the dashboard:
<울>This is how my dashboard looked at the end:
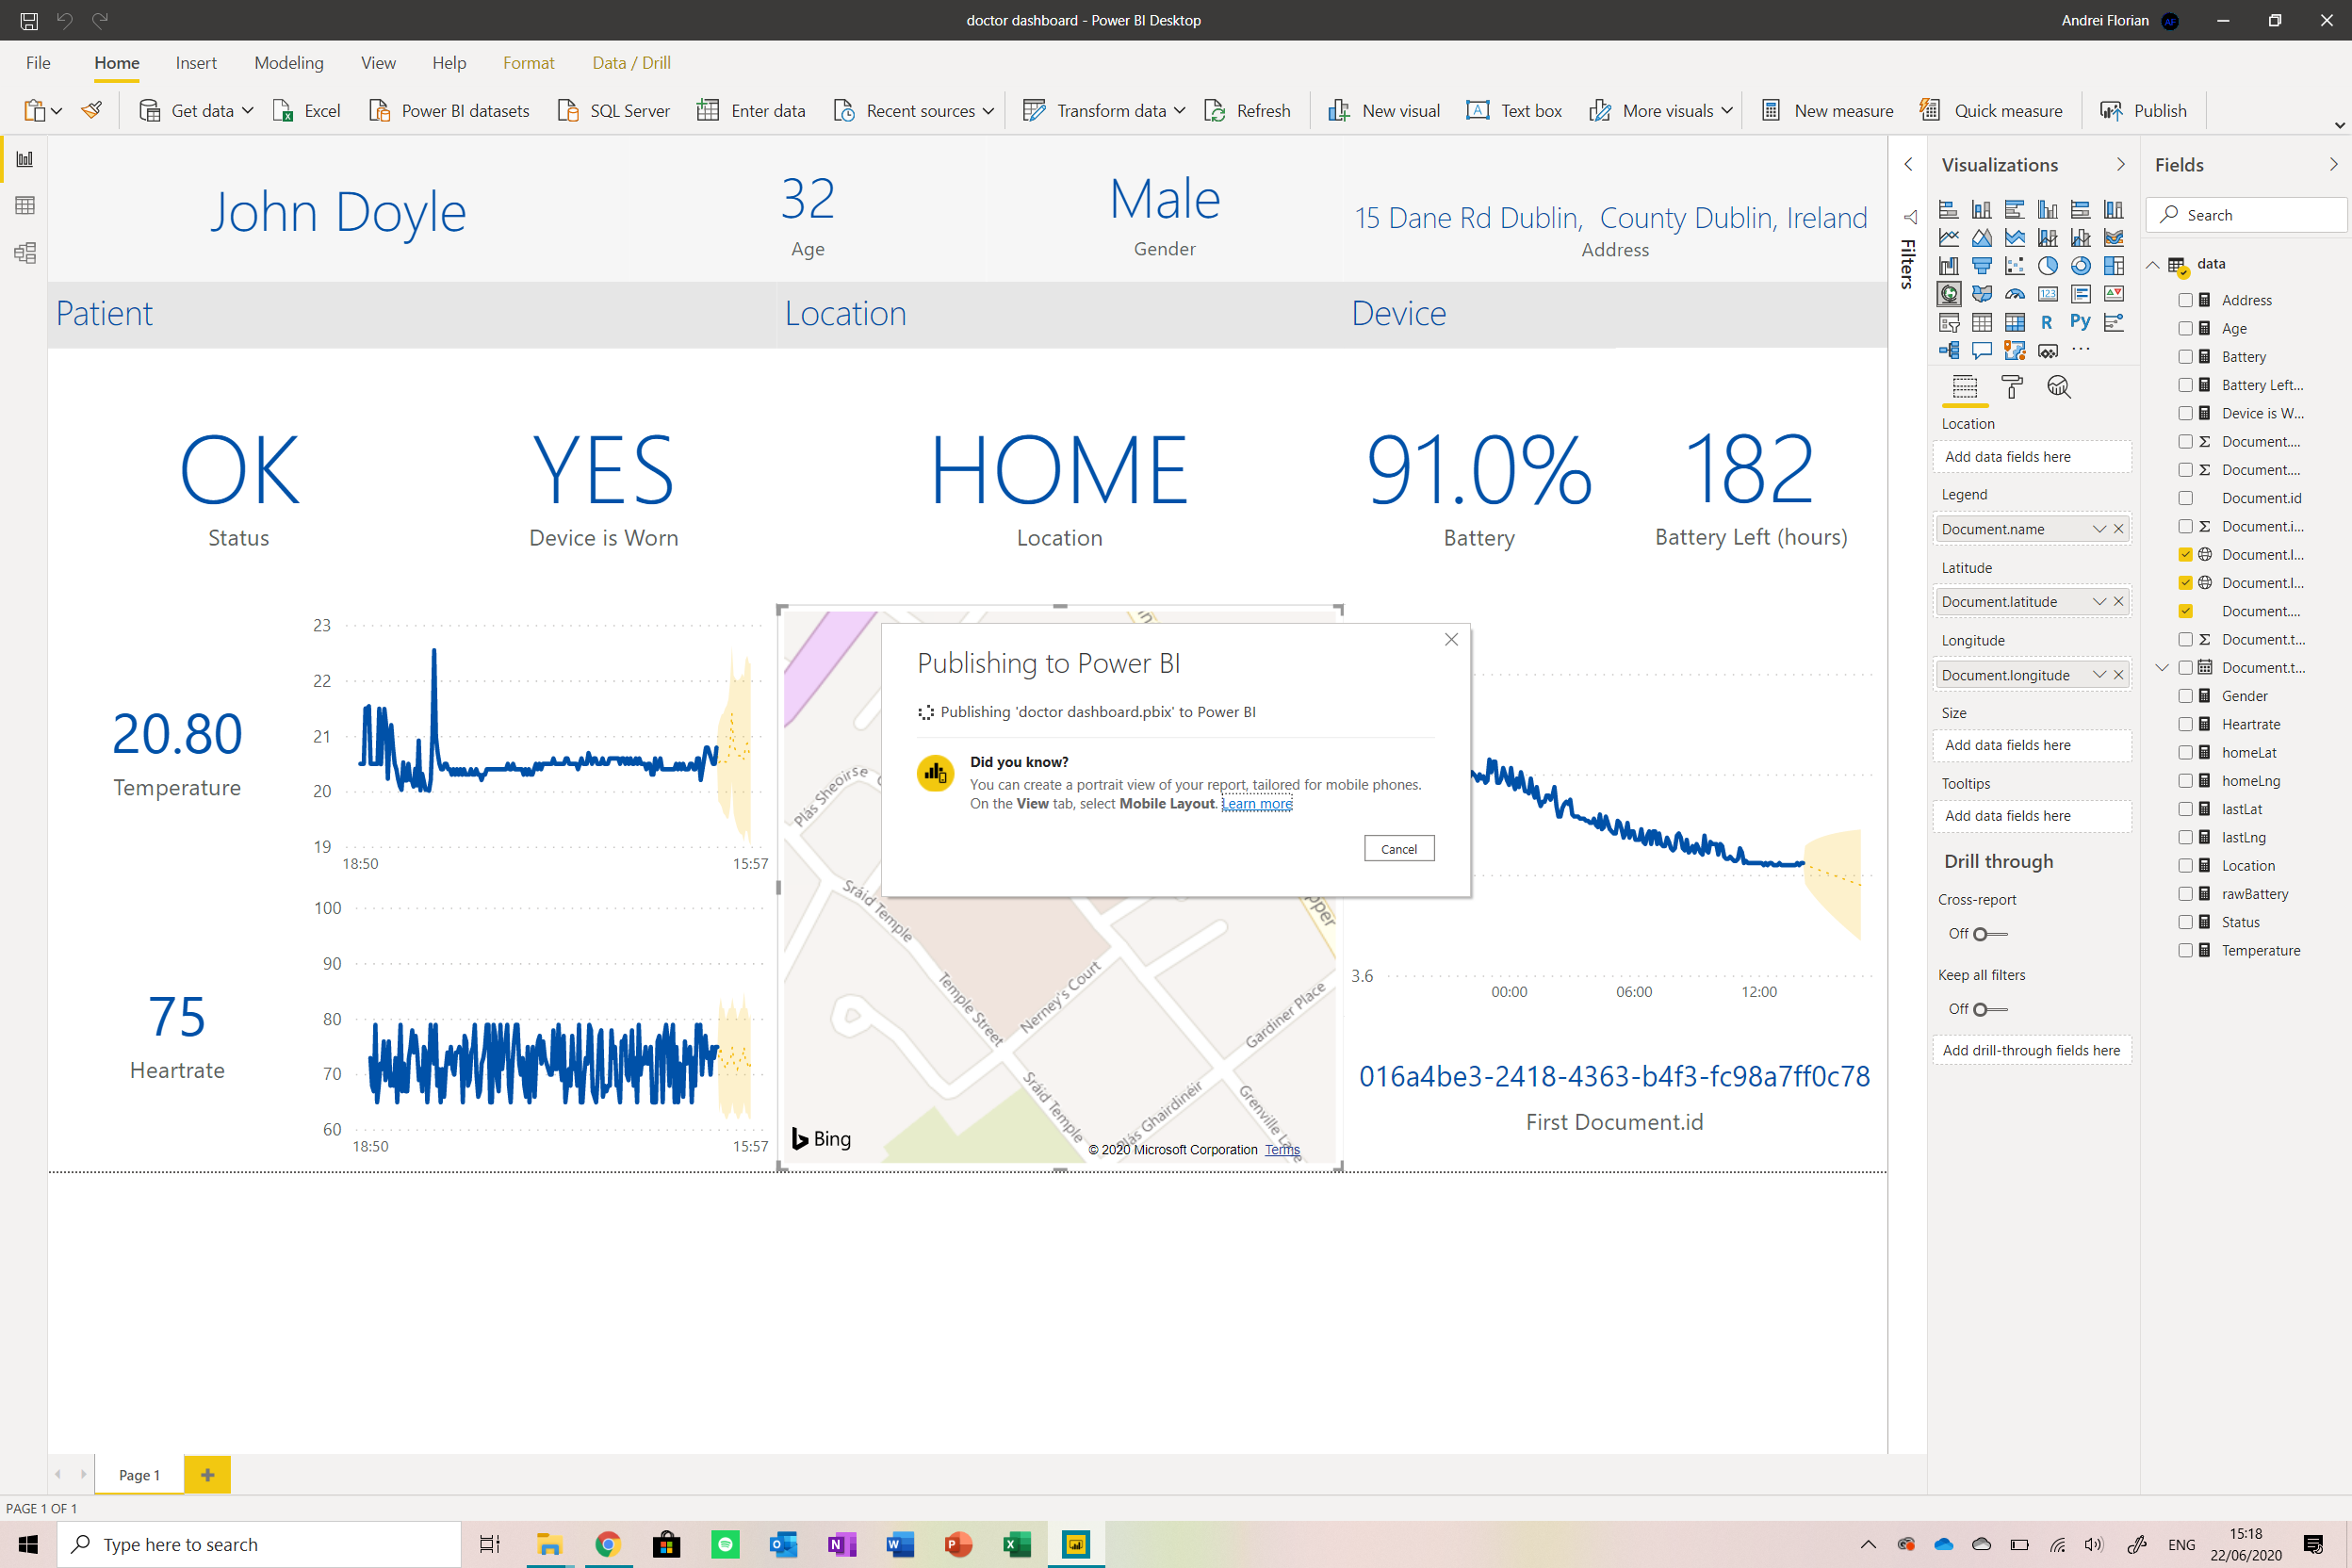
Now after the dashboard is designed, we need to publish it on the web so that we can access it from anywhere, on any device. Note that the data in the report is automatically refreshed when the user opens it (there is also a refresh button).
Click on the Publish button from the menu at the top of the screen and select My Workspace as the destination. Wait for the dashboard to upload.
To continue working on this, open the Power Bi report in the browser . We will now be working on the dashboard that summarises all patients. To do this, click on the tile depicting the status of the patient to see a menu.
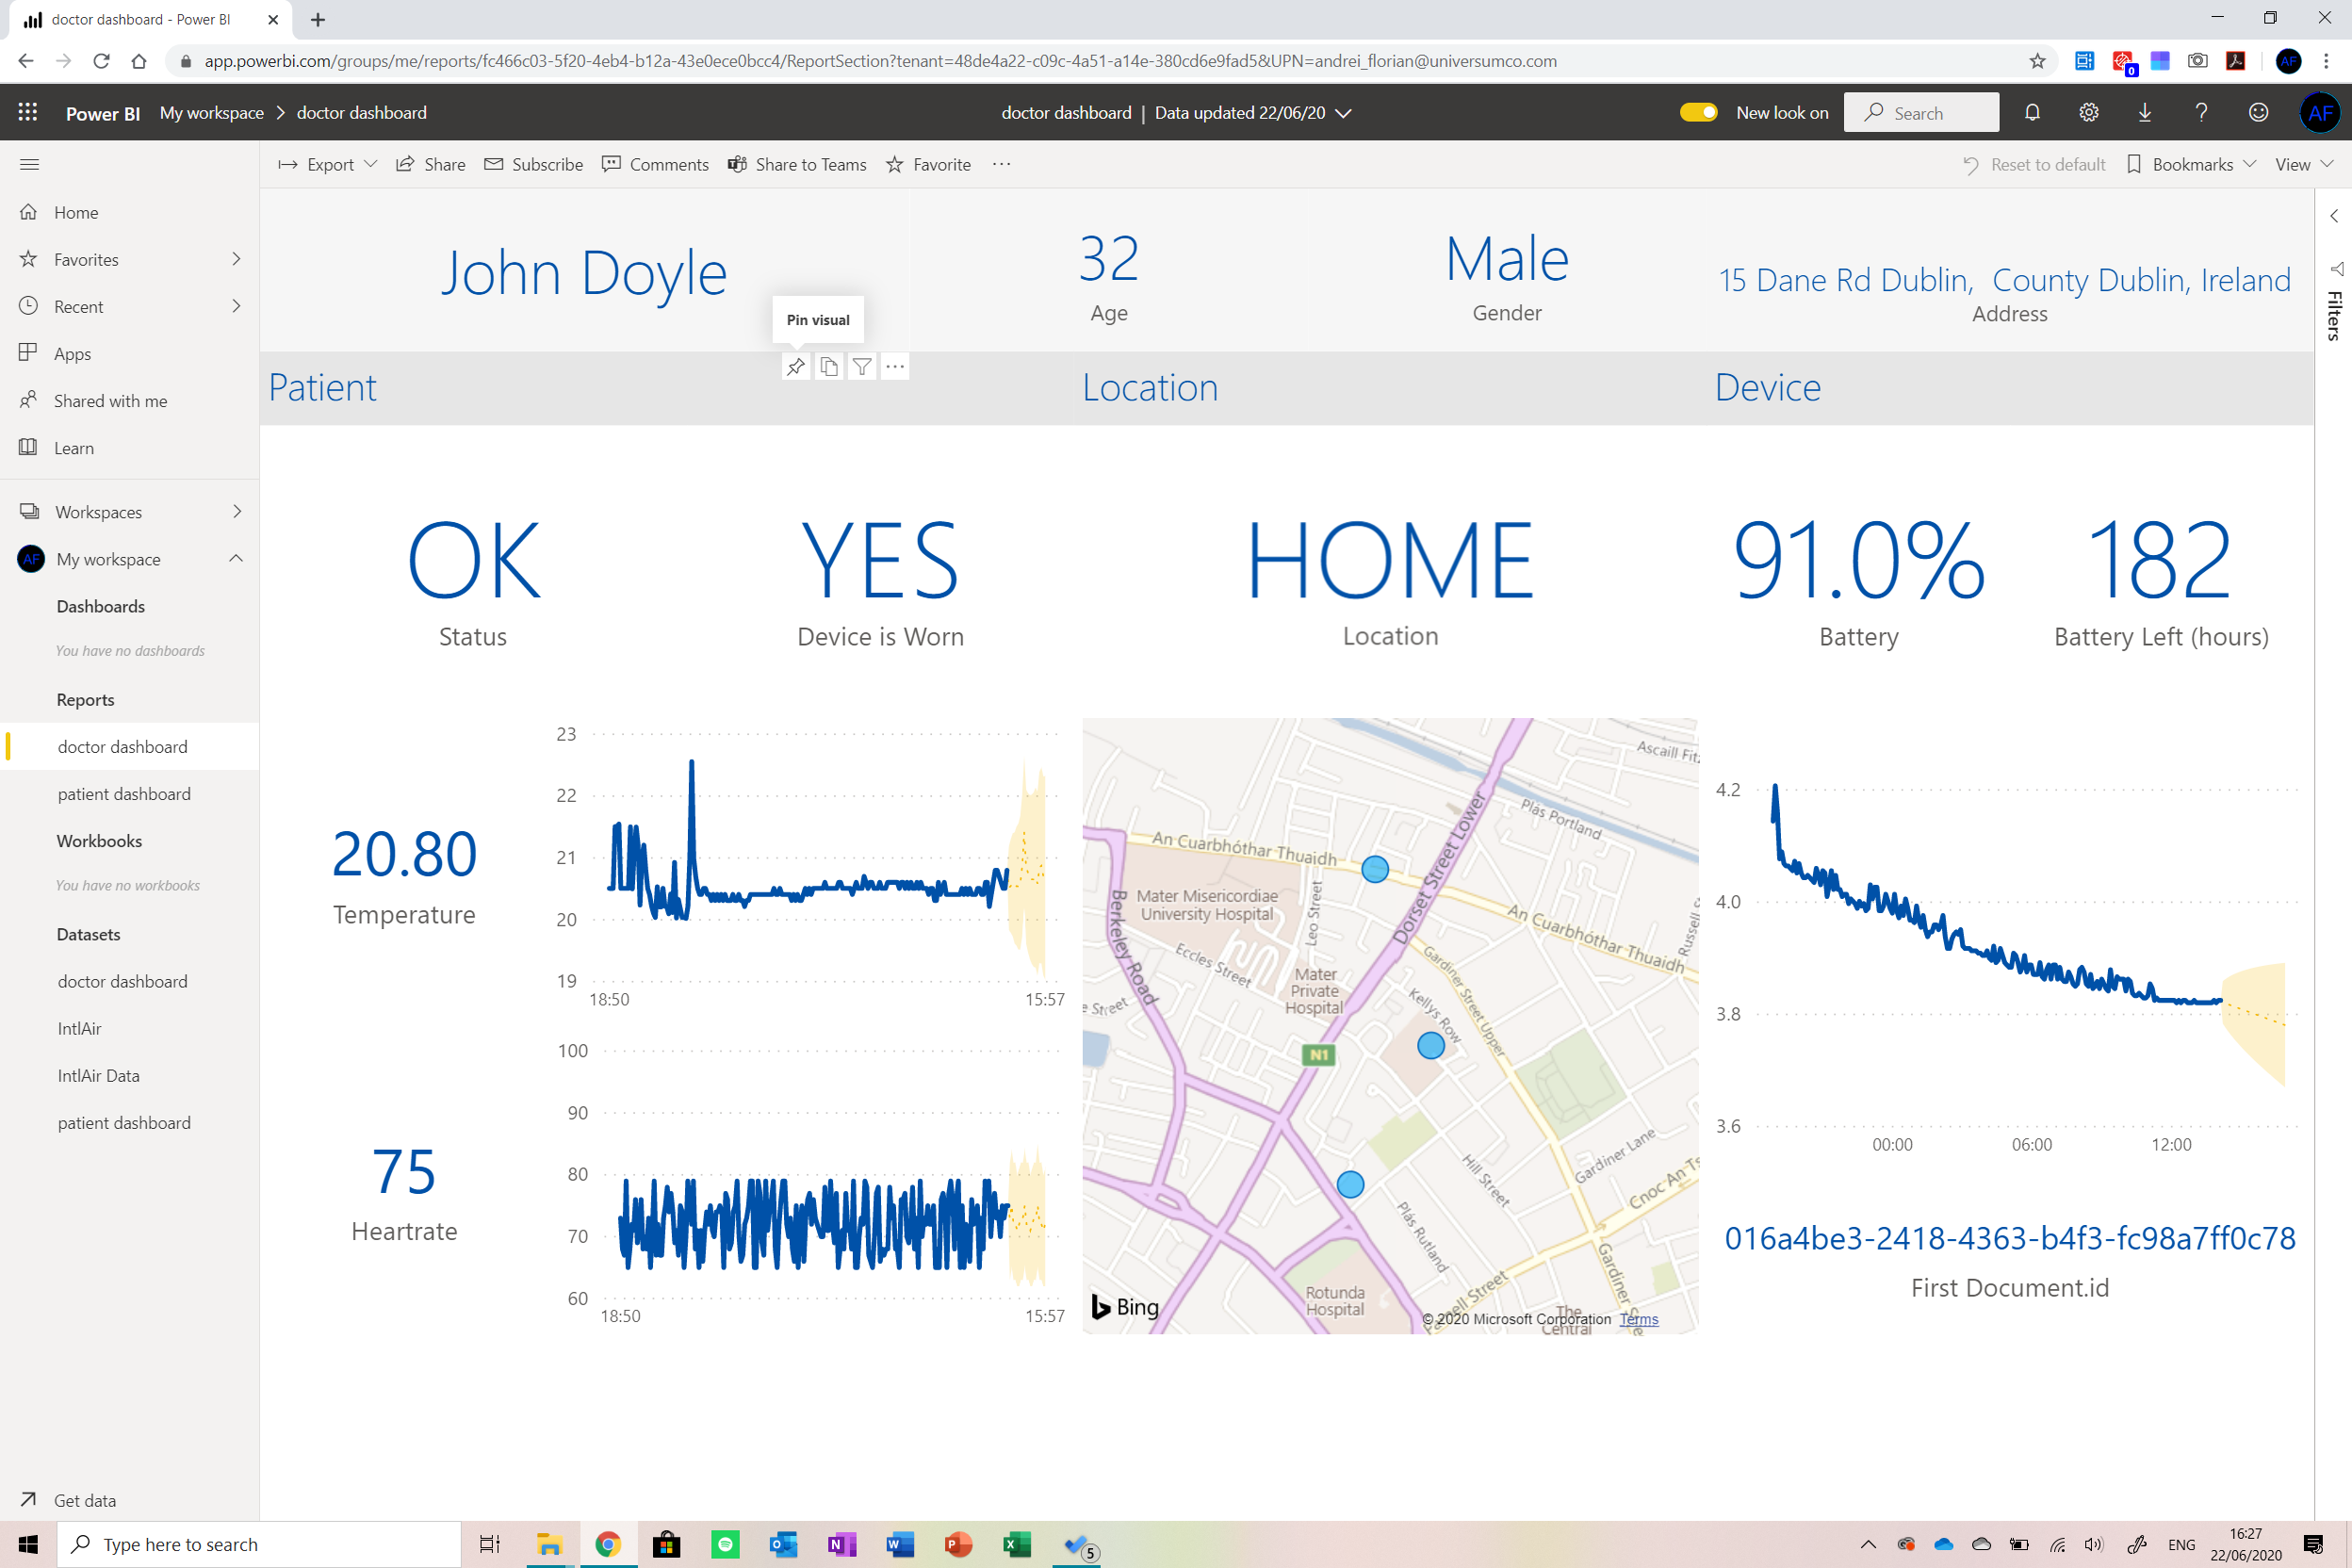
From the menu, select the pin visual button and create a new dashboard . This visual will pin to the dashboard. Repeat this for the following cards:
<울>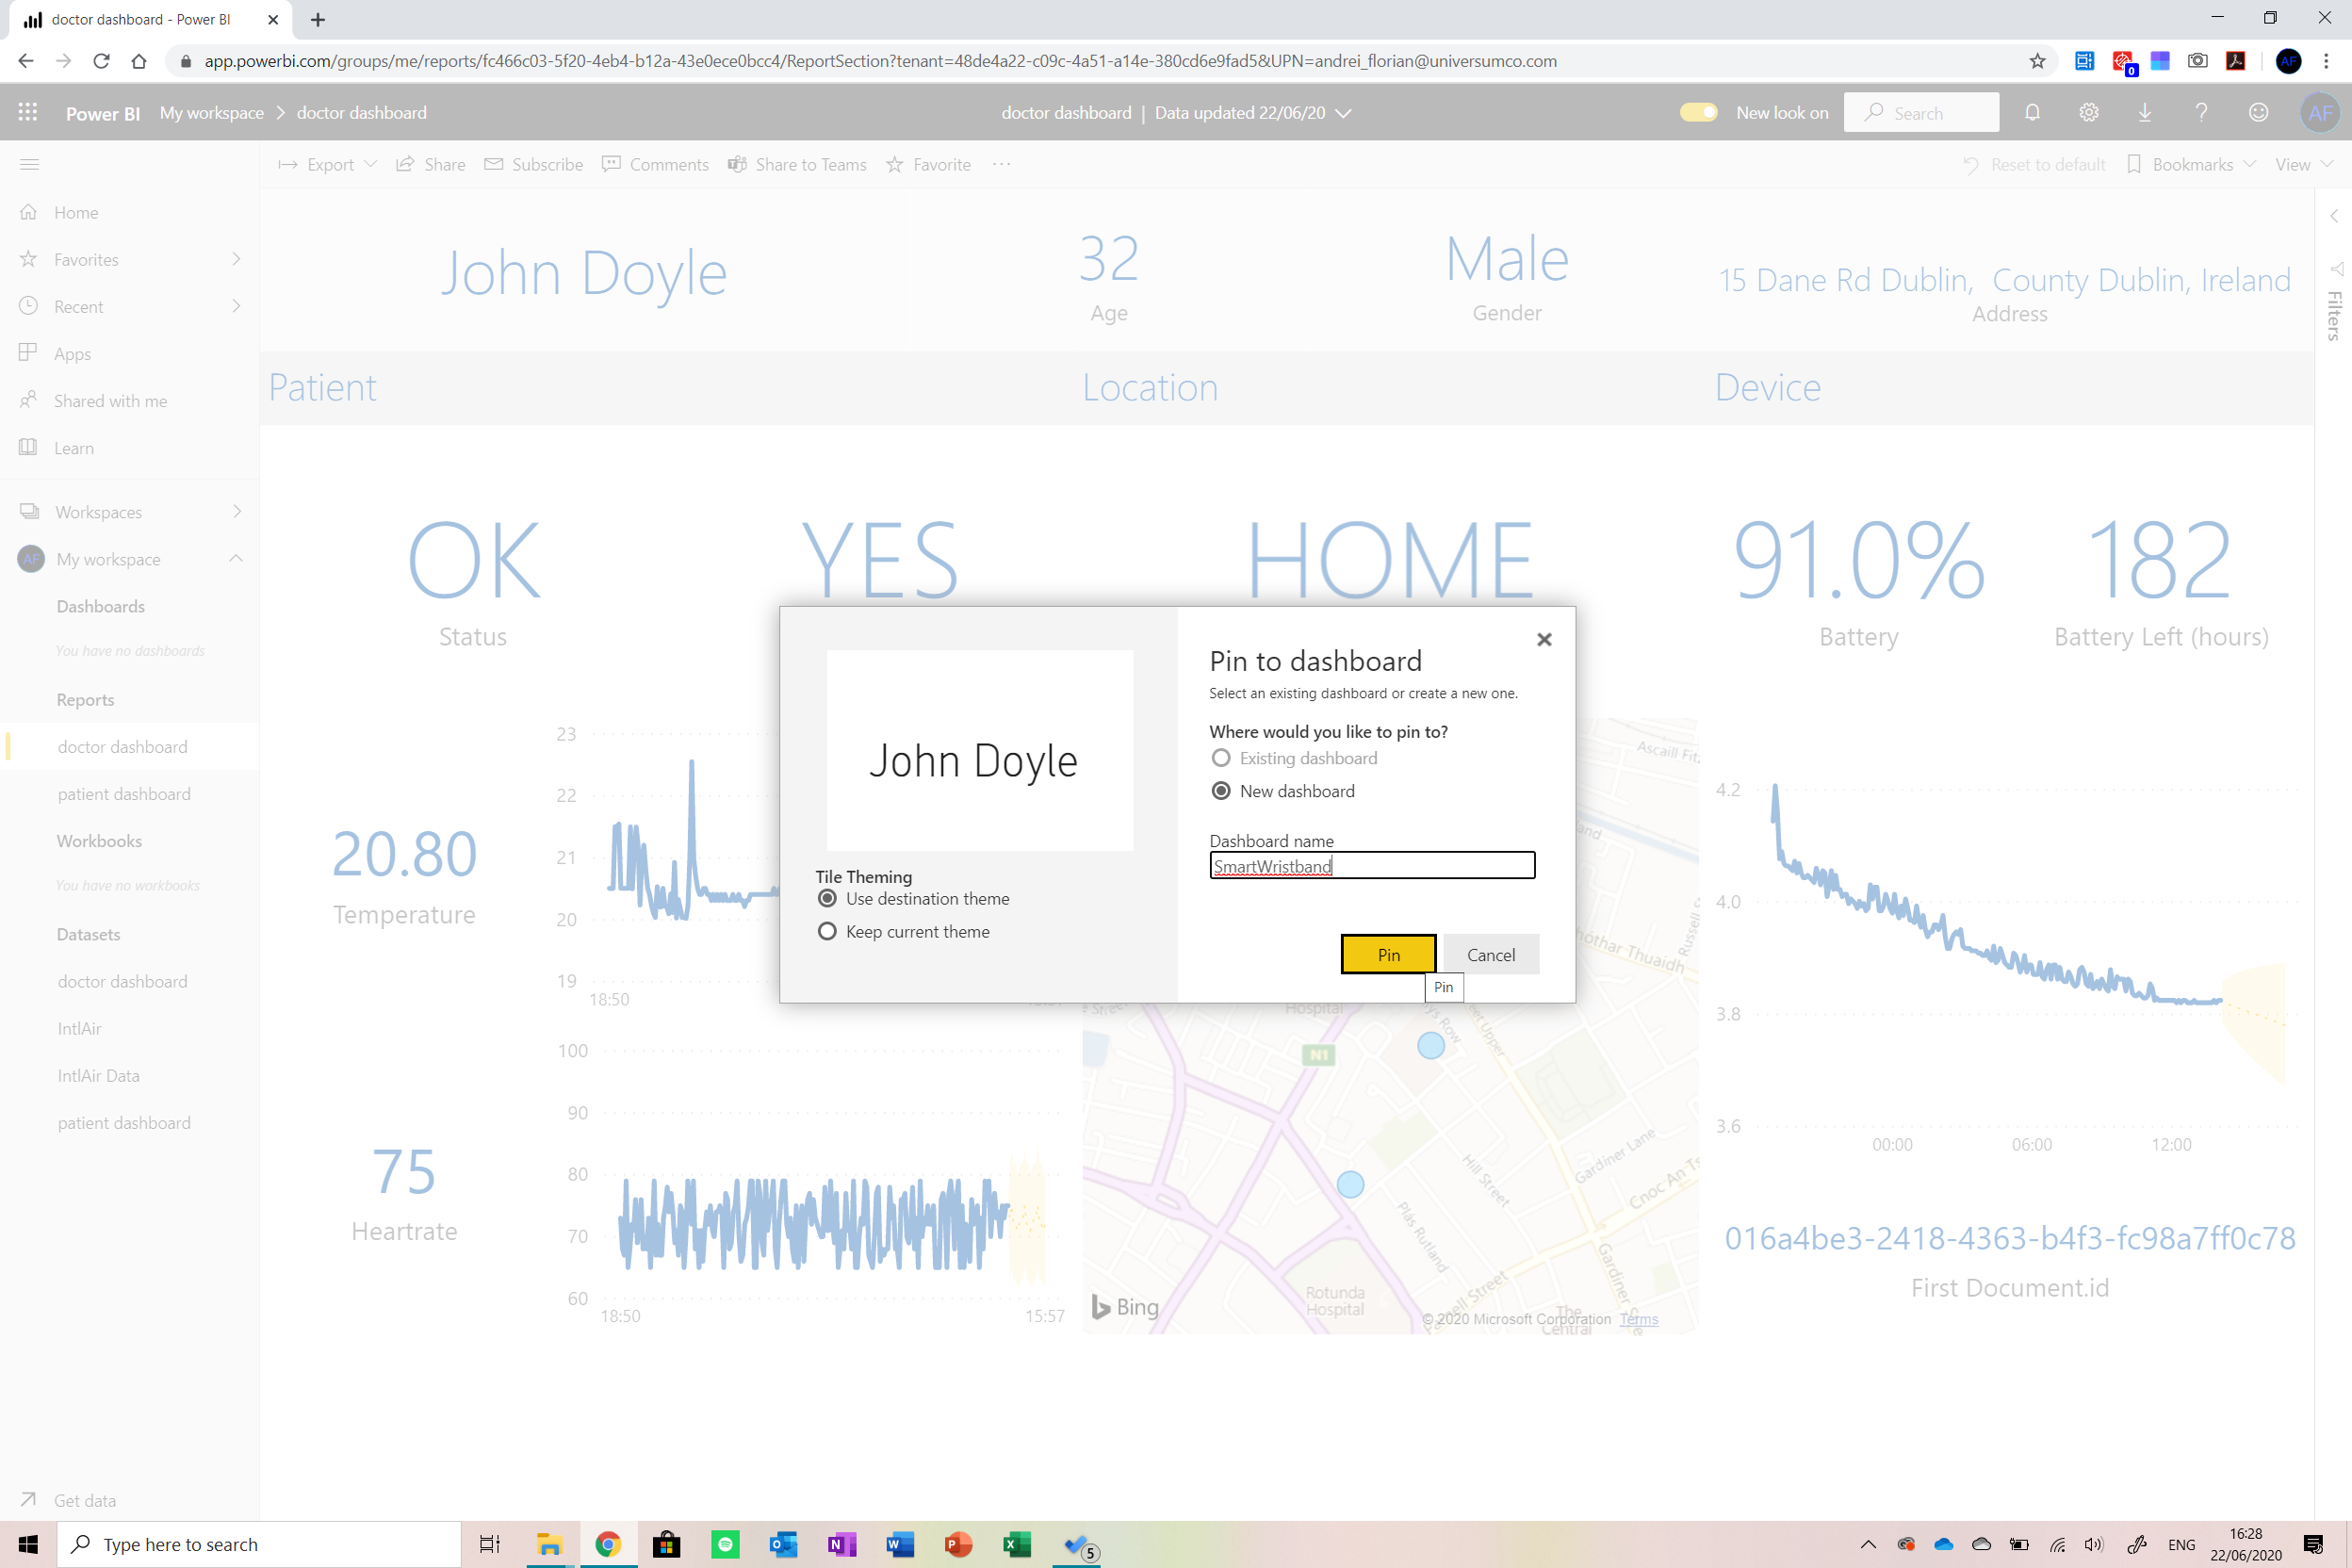
The doctor will be able to see a glimpse of all the patients being monitored on this dashboard.
Finally, click on the temperature card in the dashboard and the on the menu button, select the Manage Alerts button to open a menu where you can set alerts for the visual. Configure this as below and repeat the step with heart rate (set the threshold to 100).
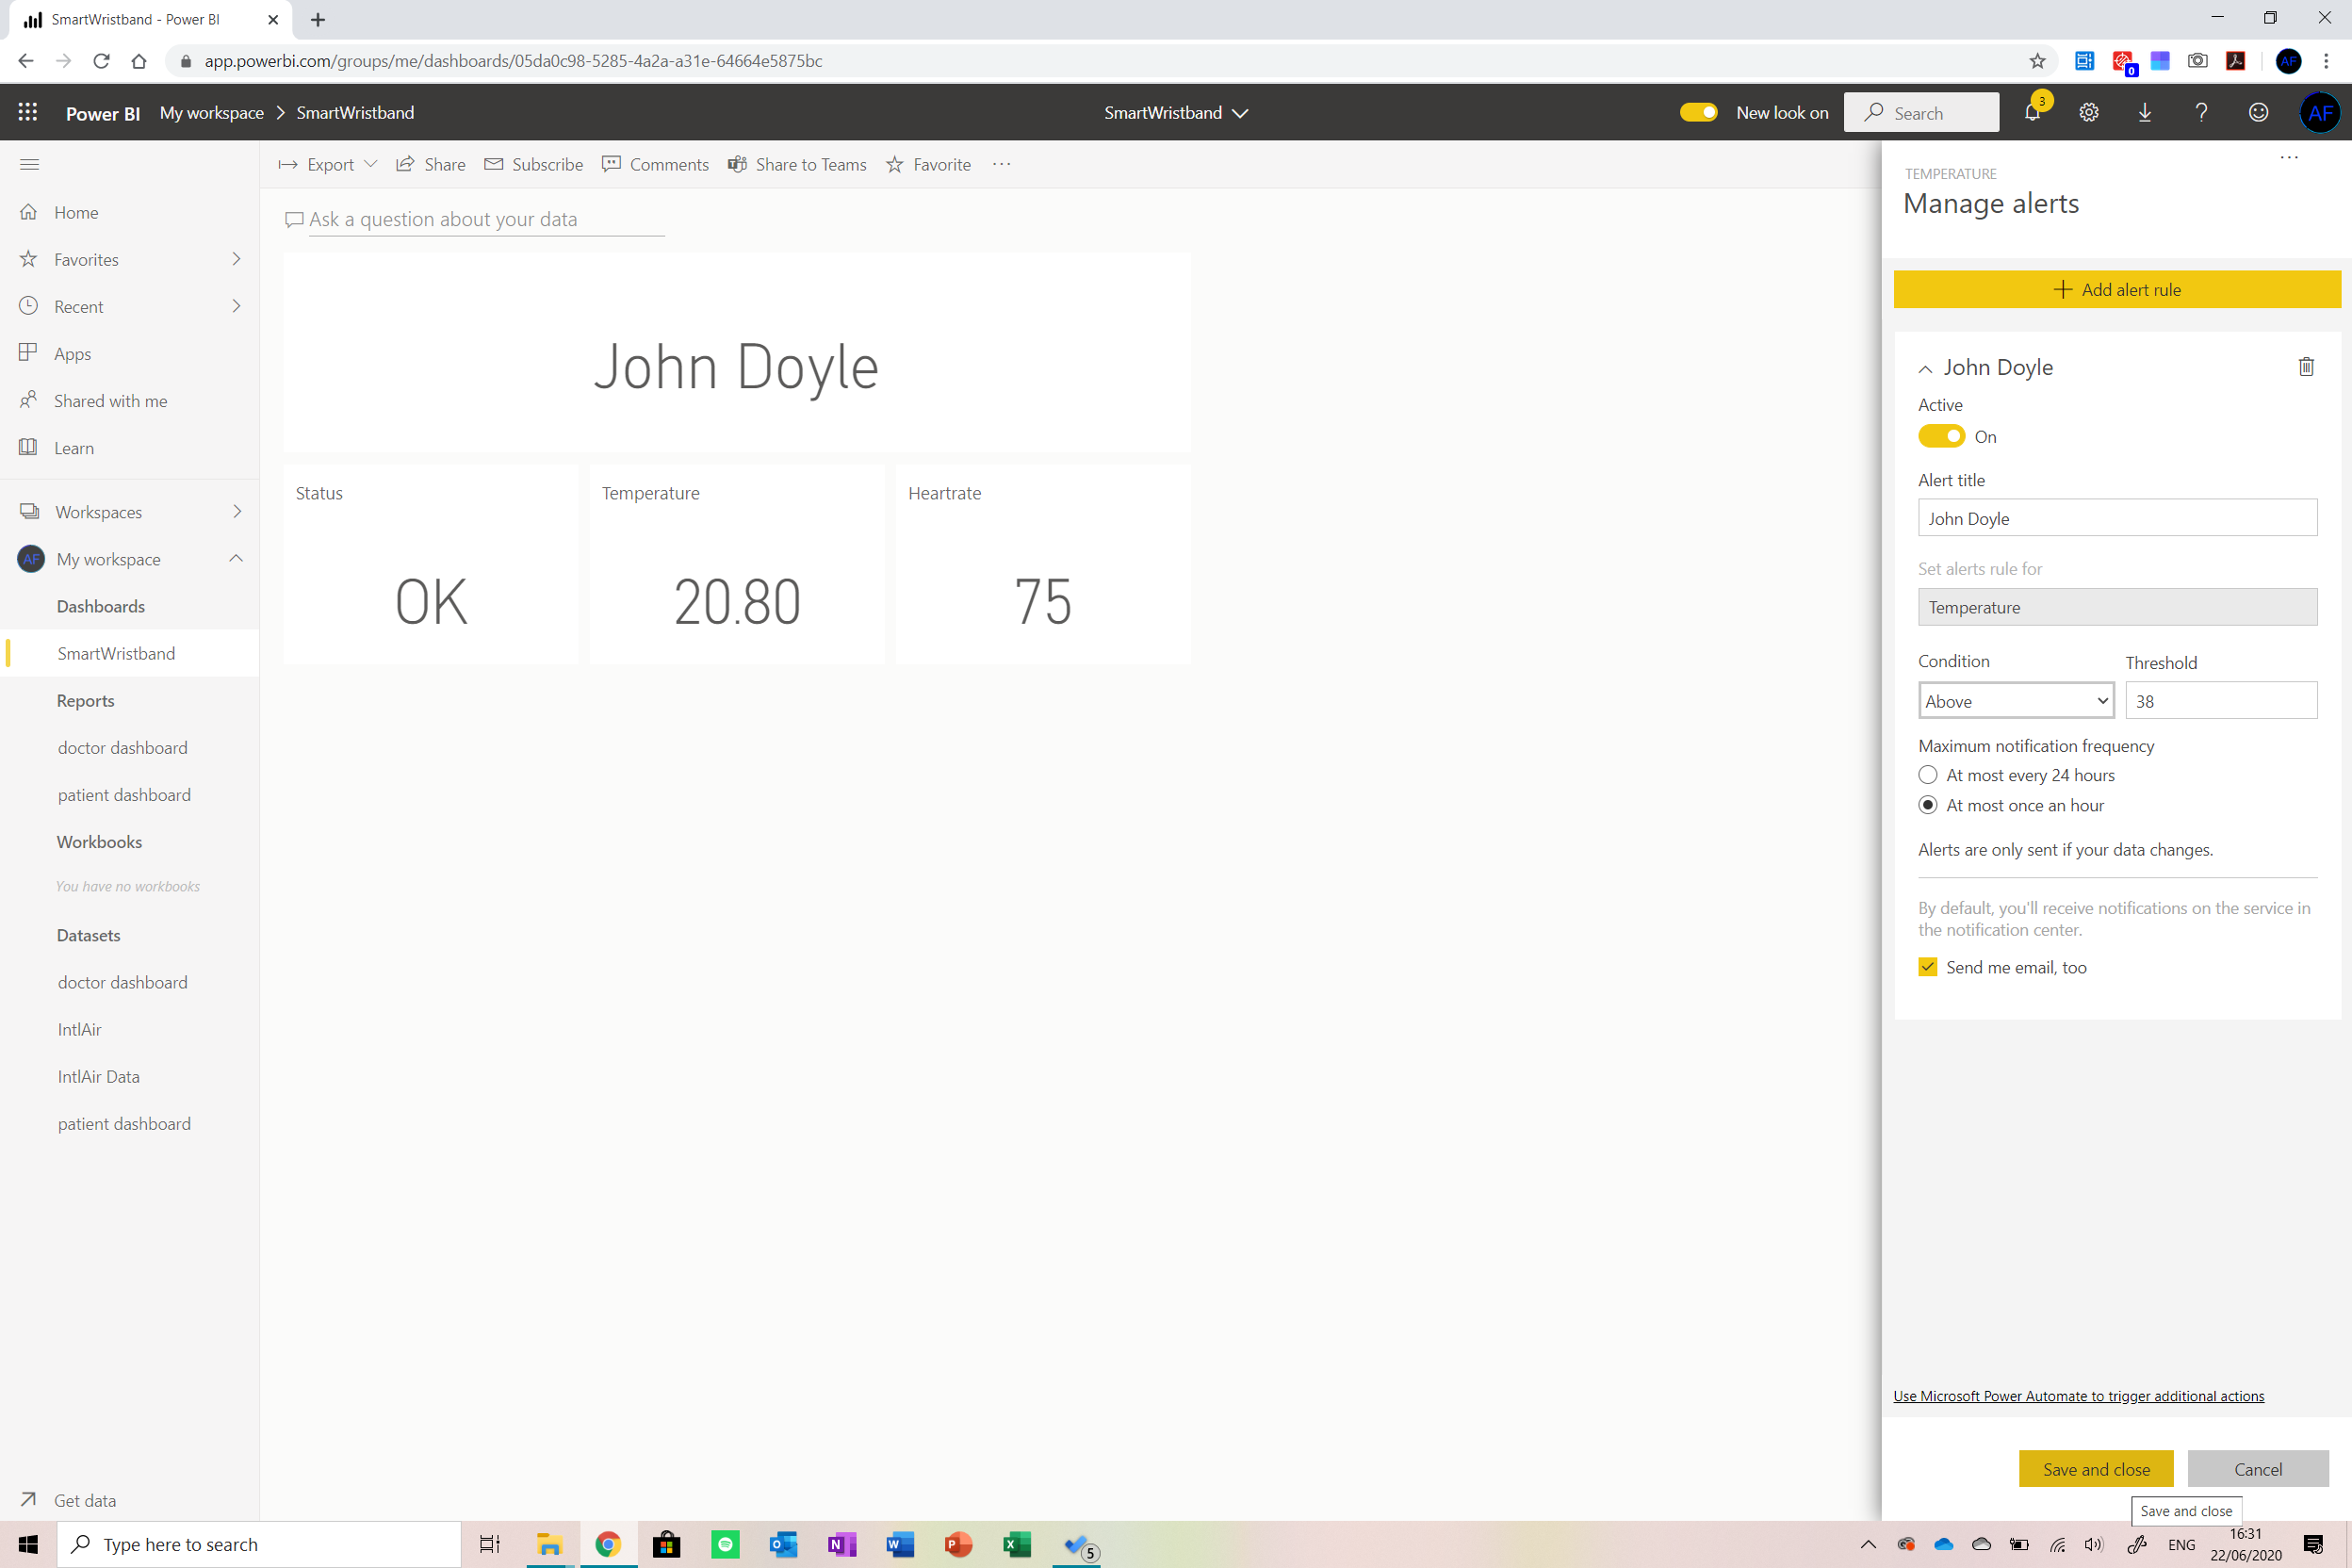
And that’s it, we now need to work on the patient dashboard.
Patient Dashboard
We will start this dashboard by copying the doctor dashboard as we will be using all the measures and data collected there but display it in a different way.
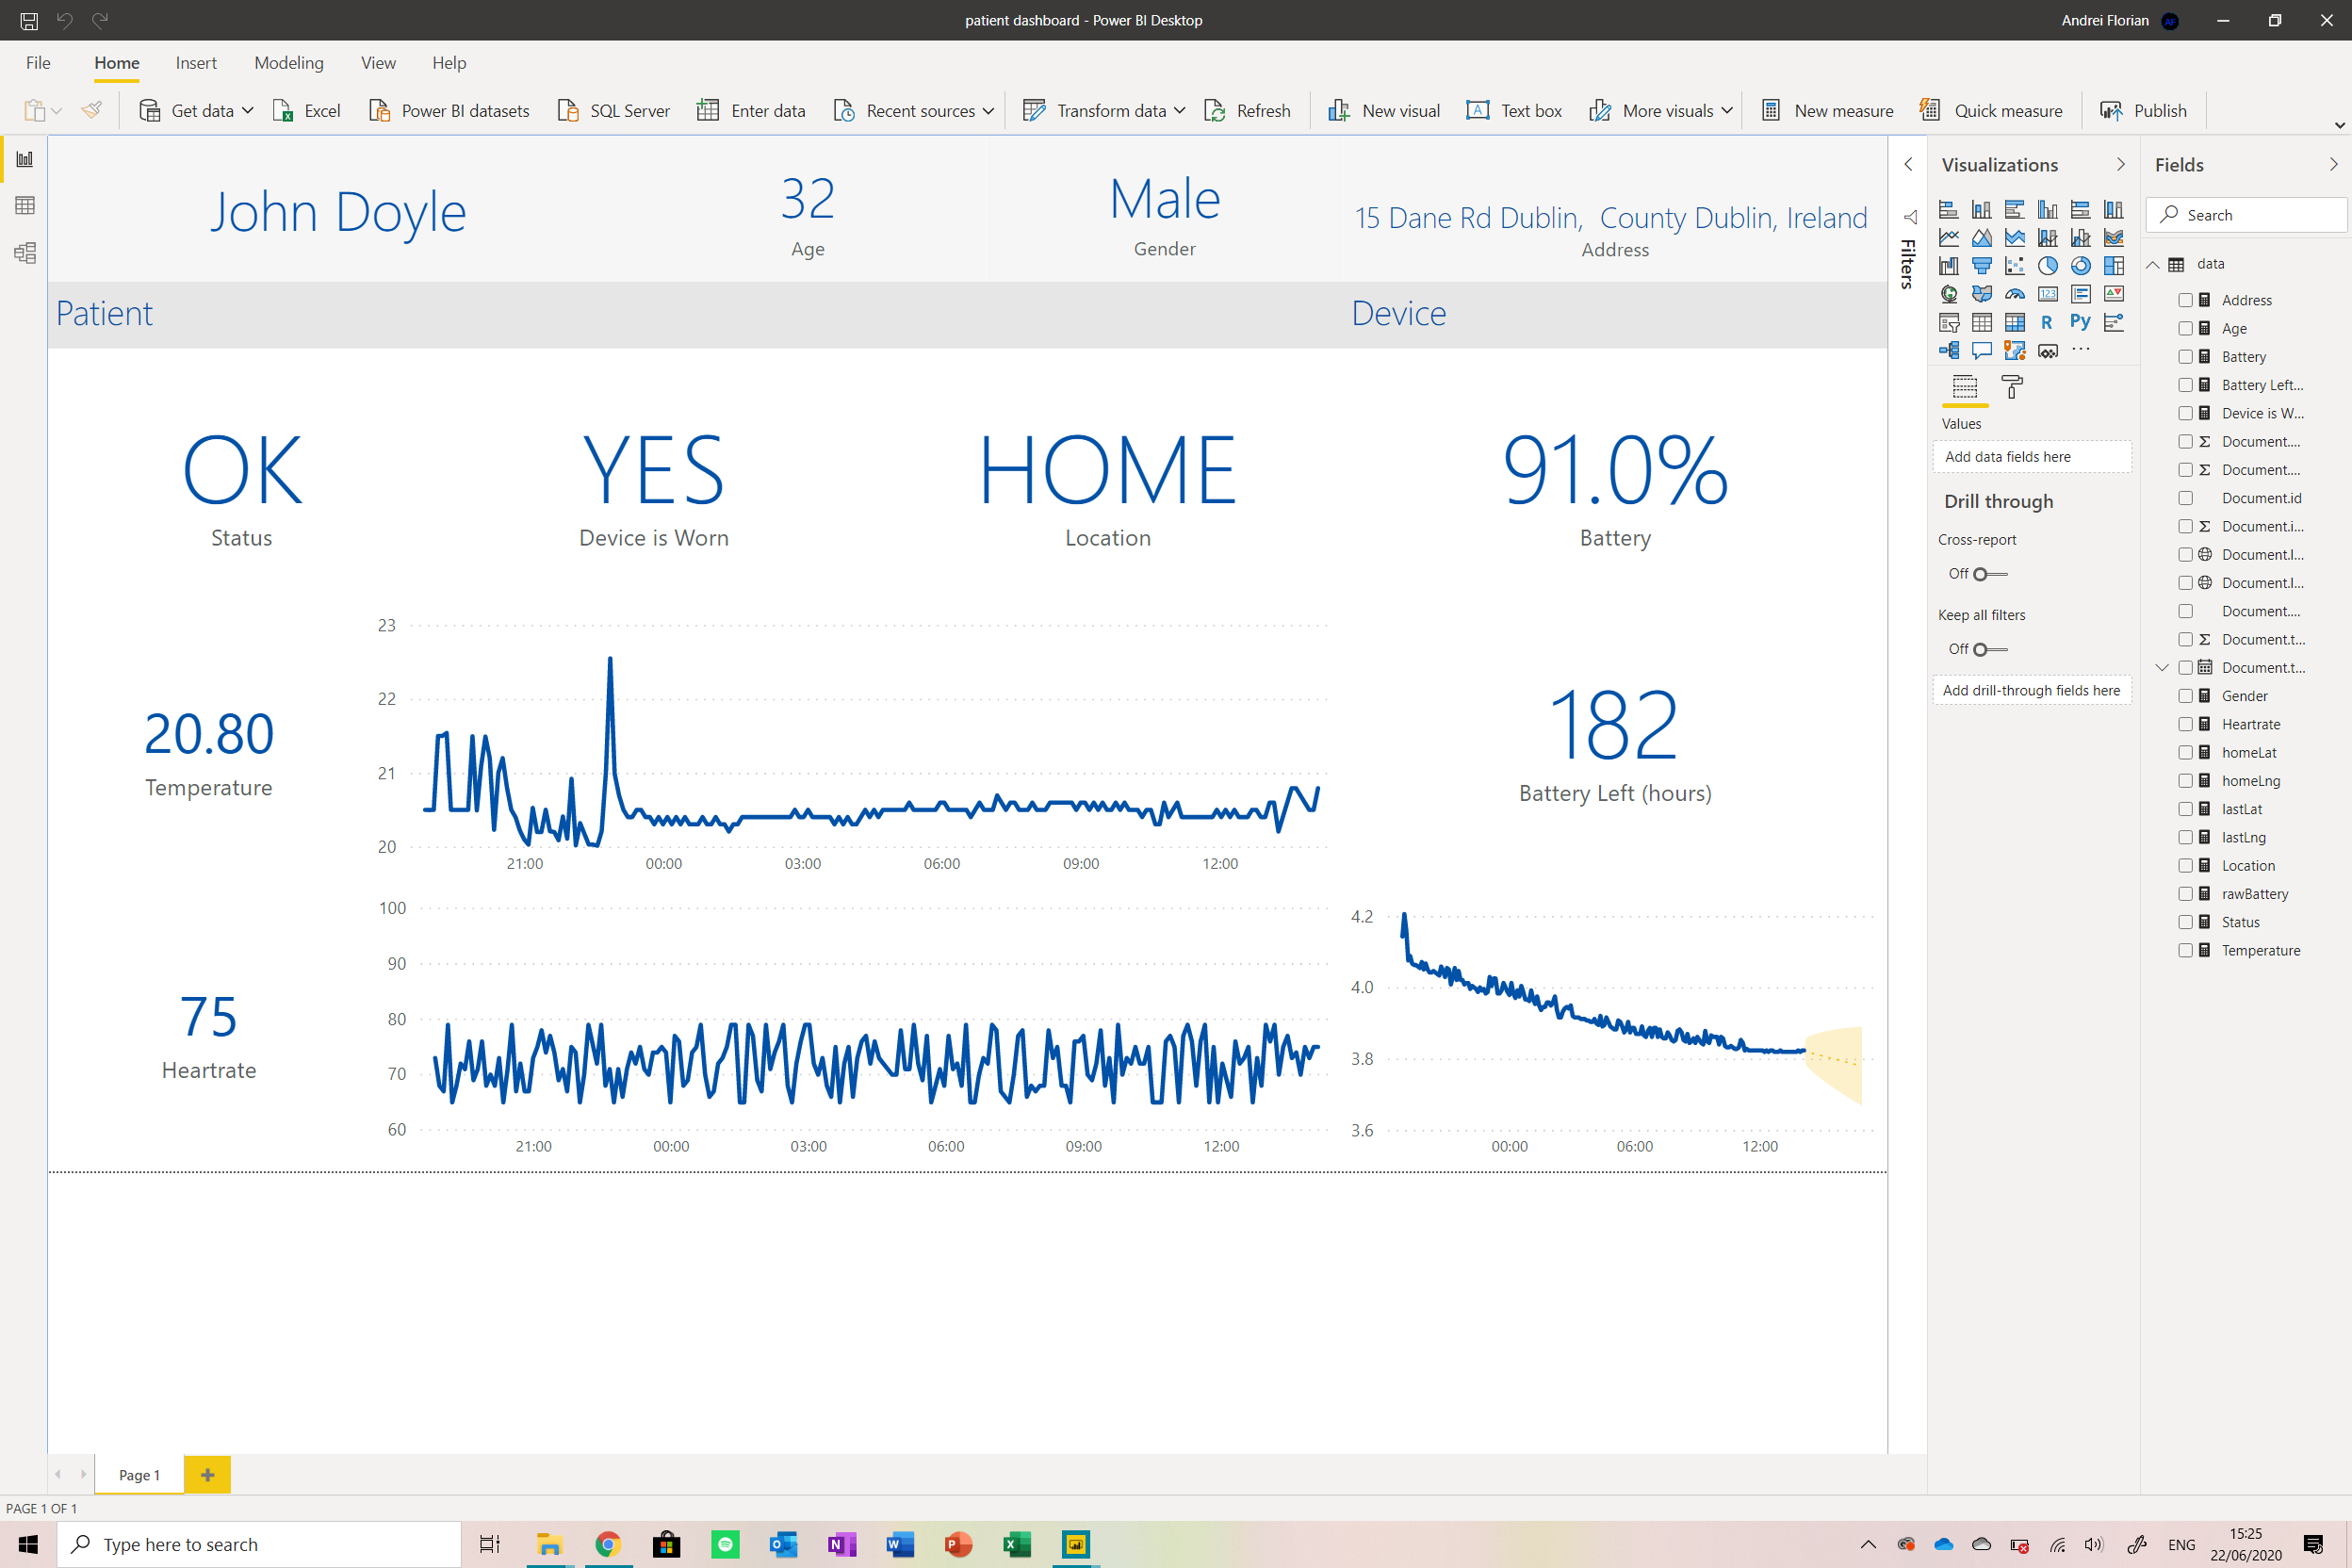
I kept all the data there but removed the forecasting for the temperature and heartrate sections (to prevent patients from worrying to much about it) and removed the location section (because the patient knows where they are).
I also developed a mobile version of this dashboard . To do so, navigate to the View menu and then select Mobile Layout . From there, we only need to drag and drop the existing tiles onto the mobile phone to create this layout.
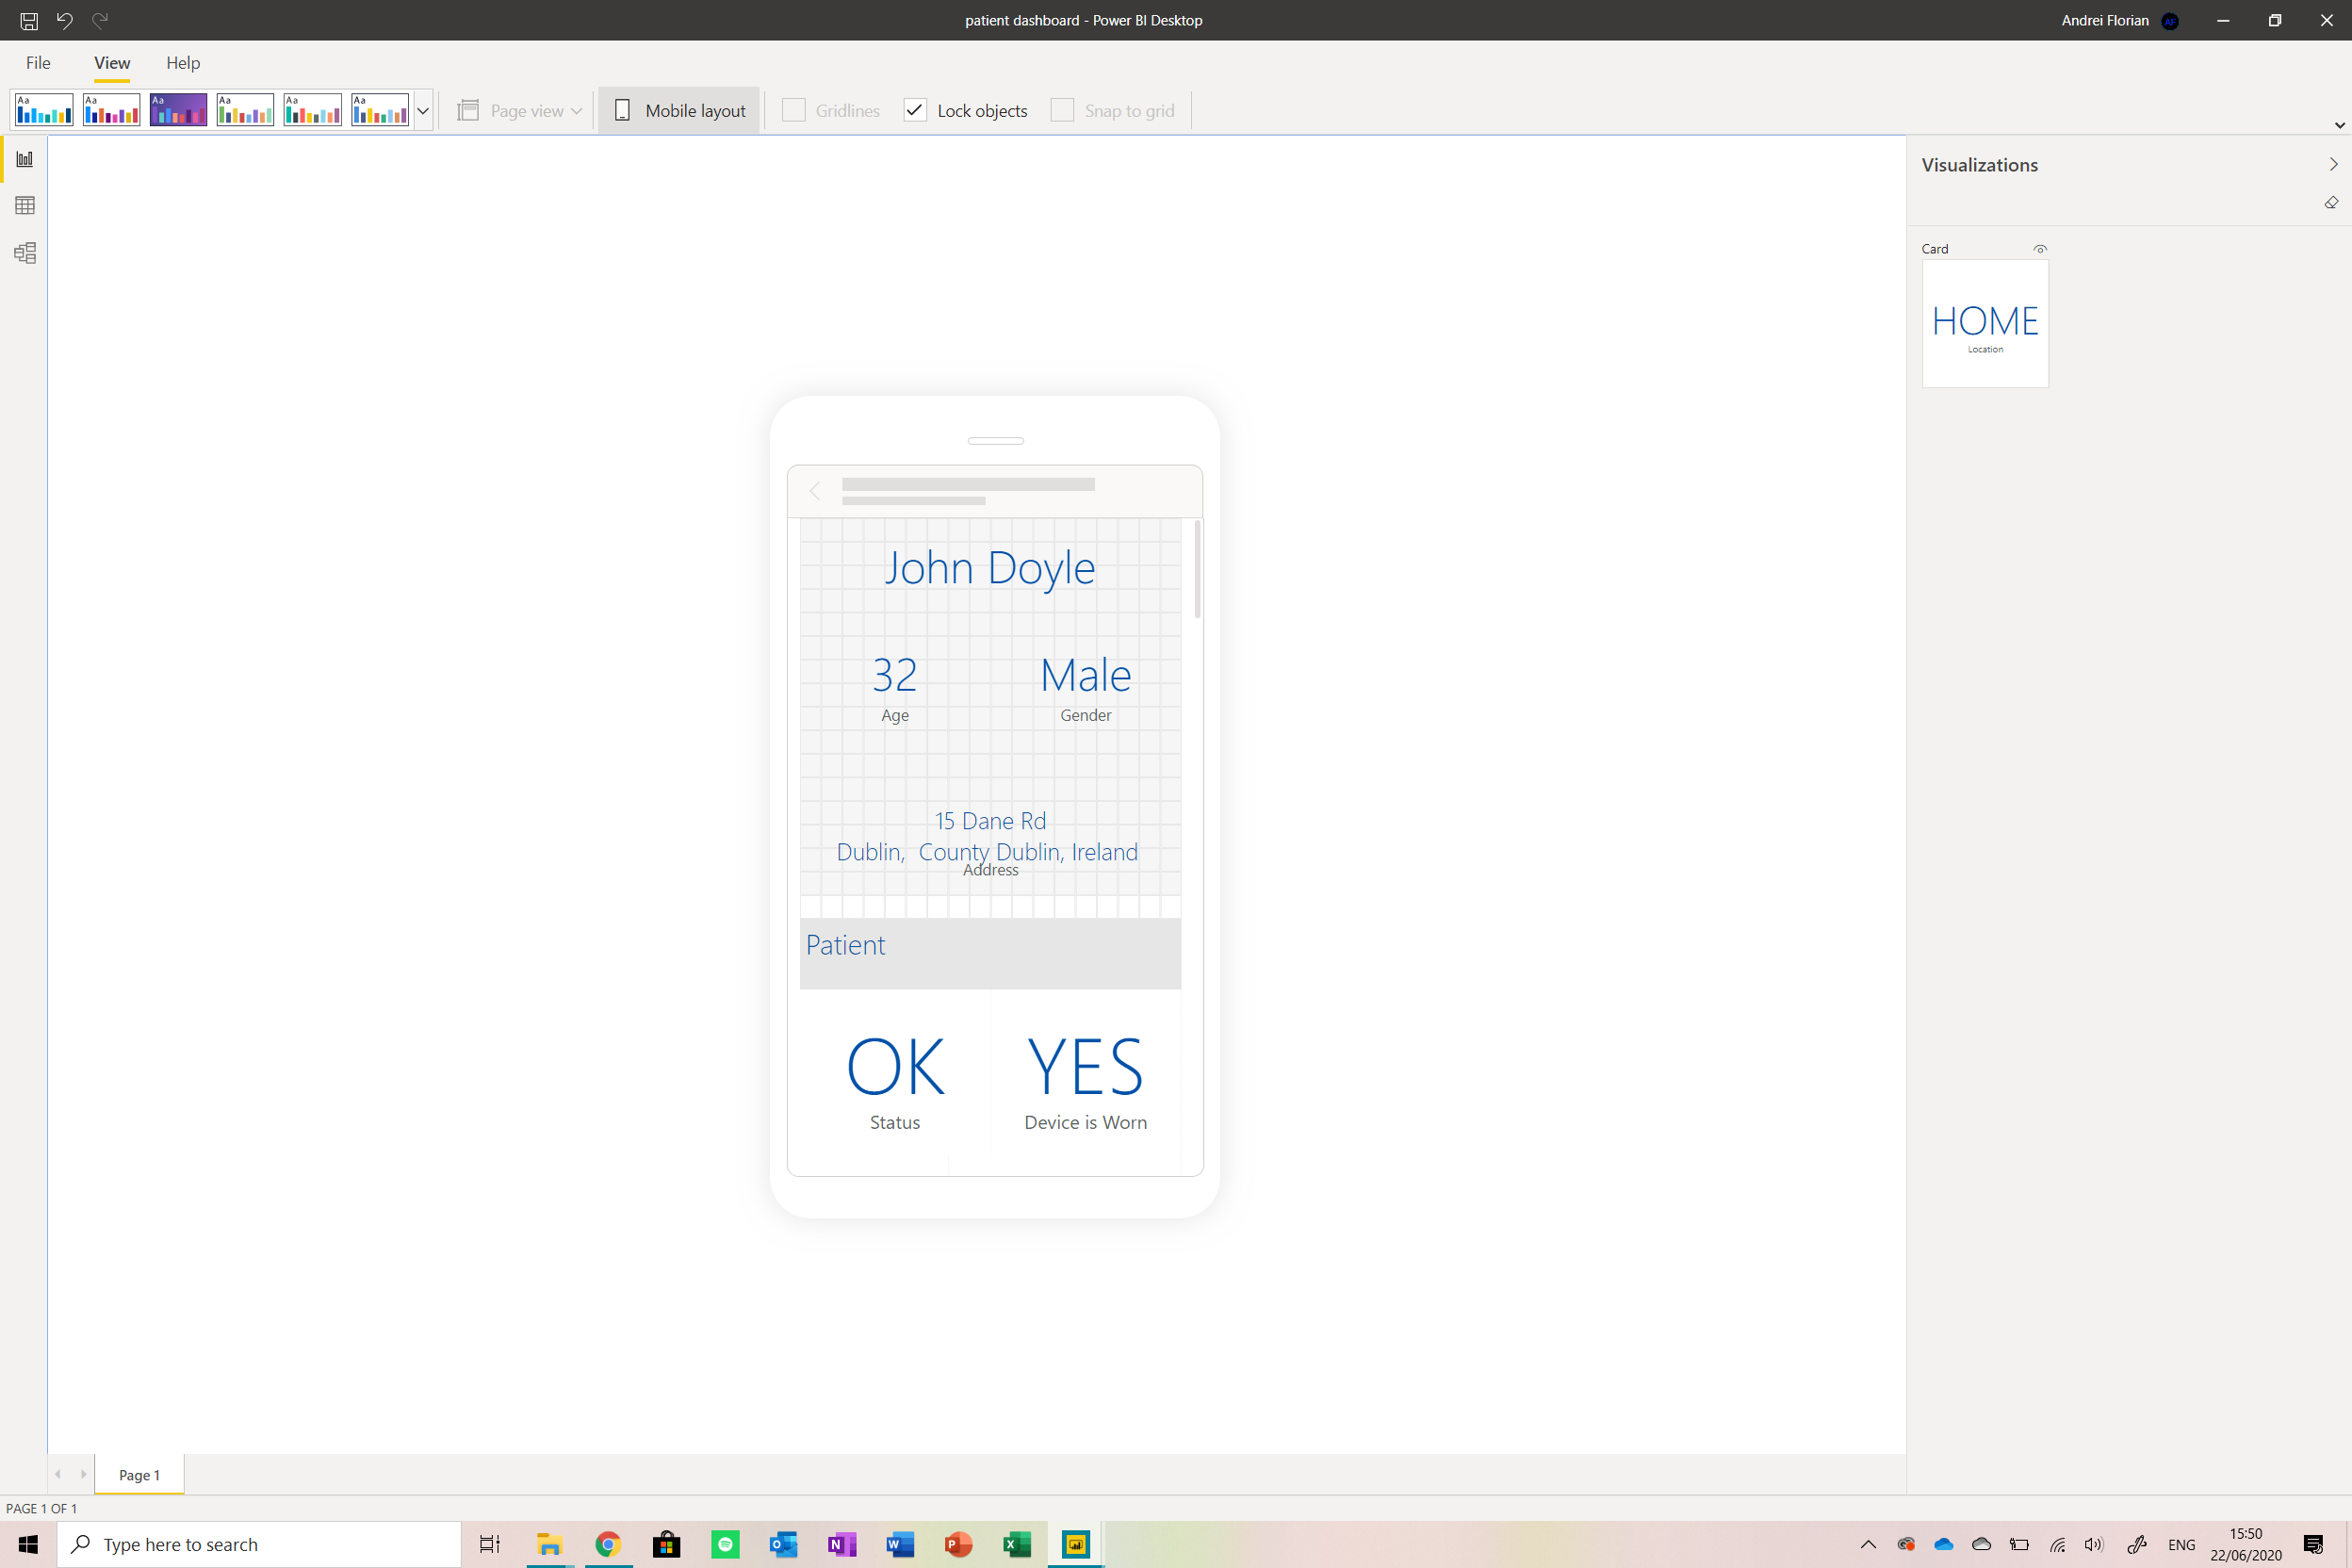
After this is done, we will upload the dashboard online again as done before. This dashboard can be shared with the patient through the Power Bi app where they can get a mobile version of the application showing them all the information they need as well as an online view.
Step 12:Finally, the enclosure
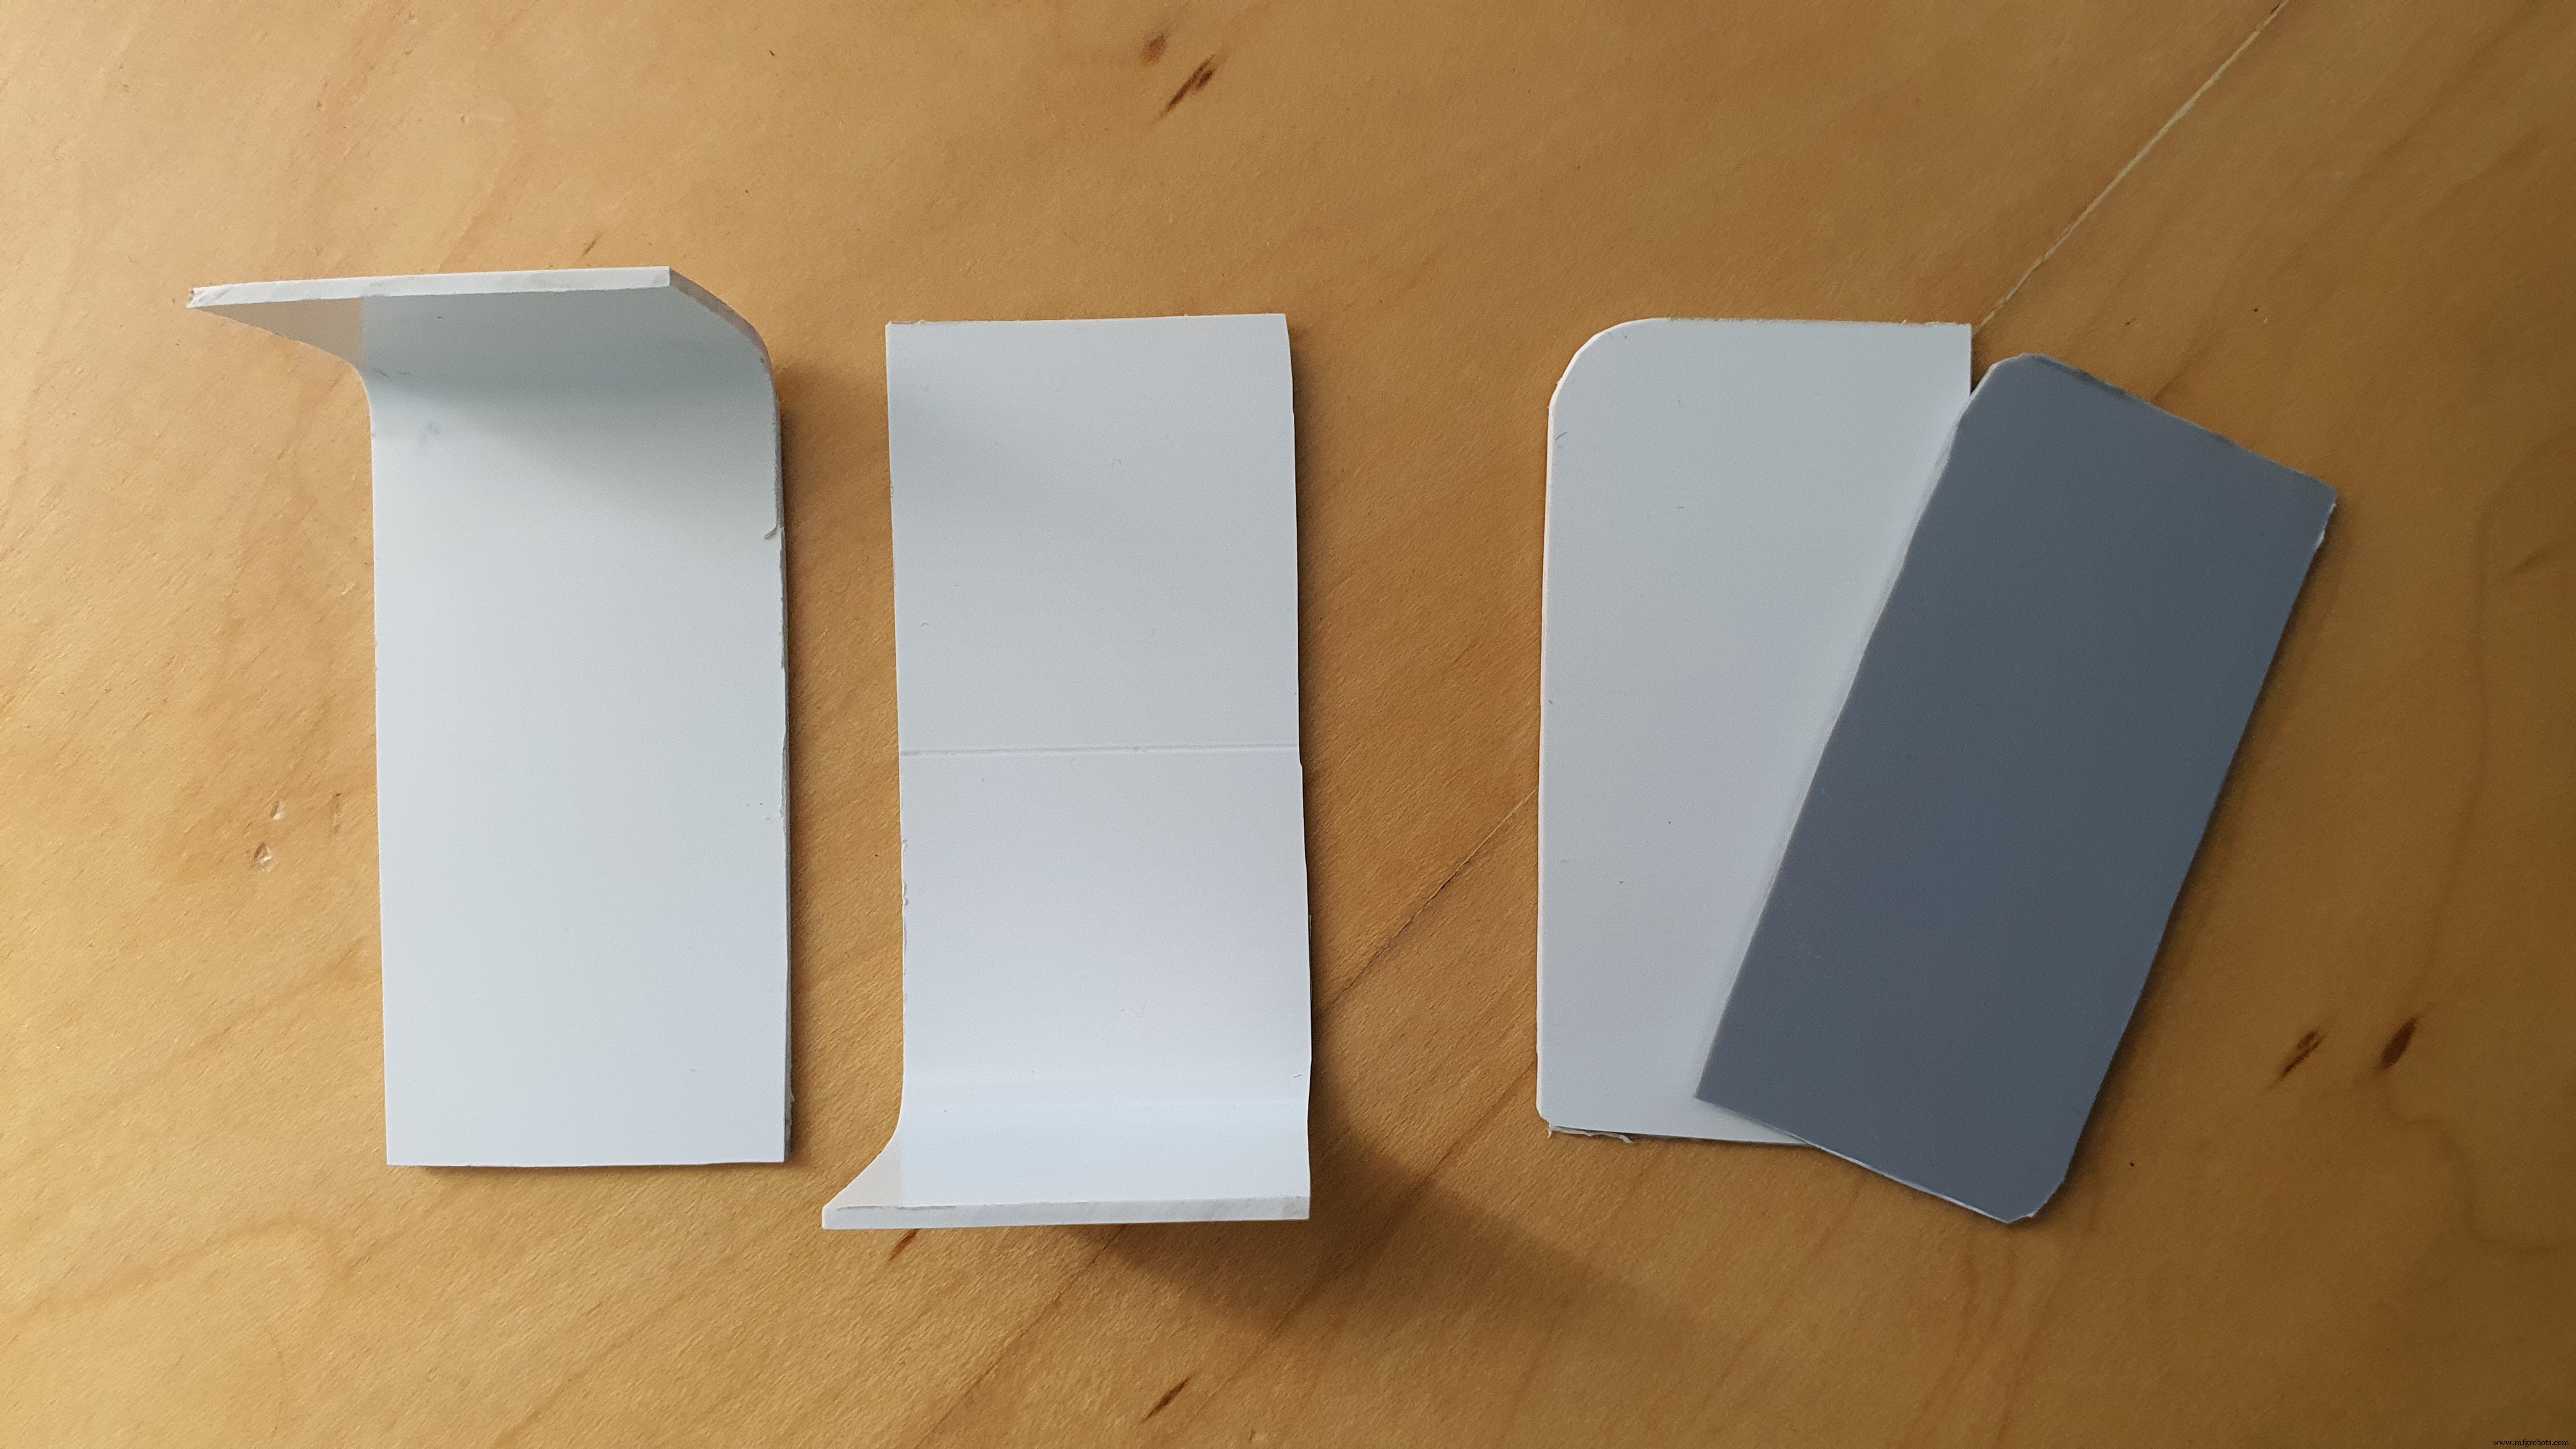
So now that everything is done, we need to create an enclosure for the project, now ideally it would be 3D printed, but because I don’t have a 3D printer (I really need to get one), I cut pieces of plastic out and assembled them that way. I do though have a 3D design made for the enclosure of the prototype.
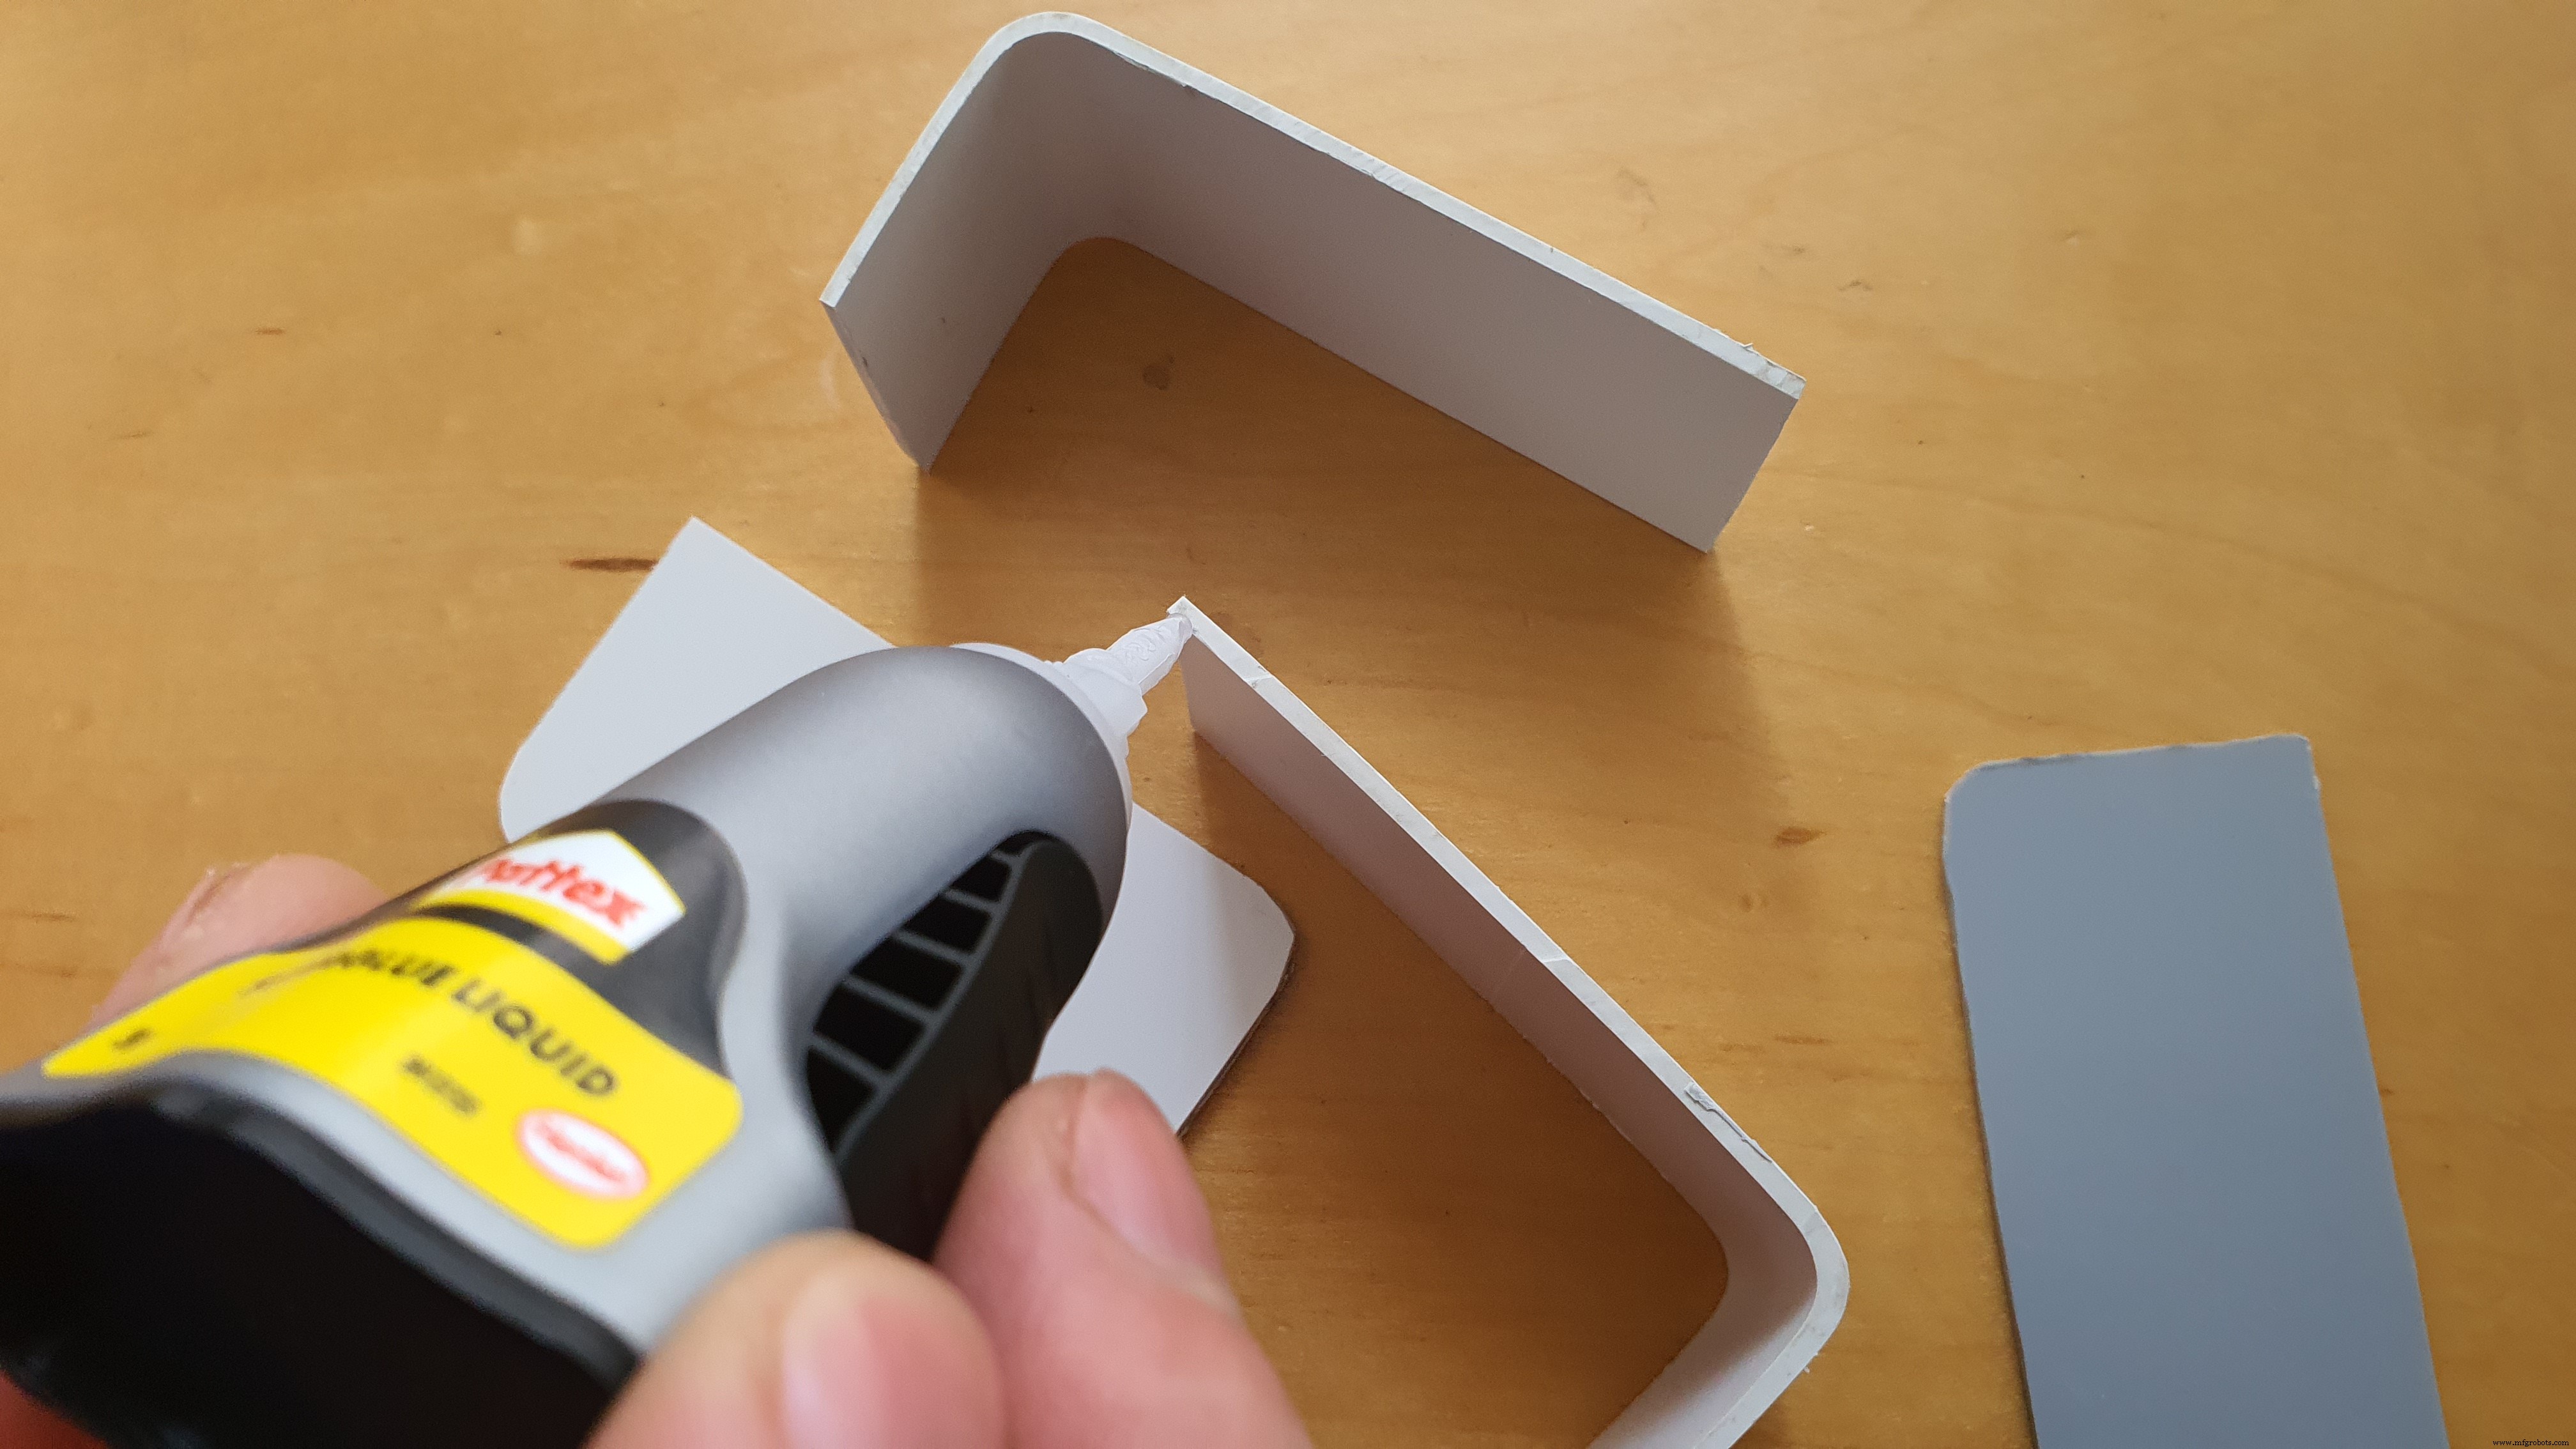
The device is quite big in this instance and a future and industrial version will obviously be reduced in size (I just didn’t want to solder all the components onto a PCB so I could reuse them in future projects).
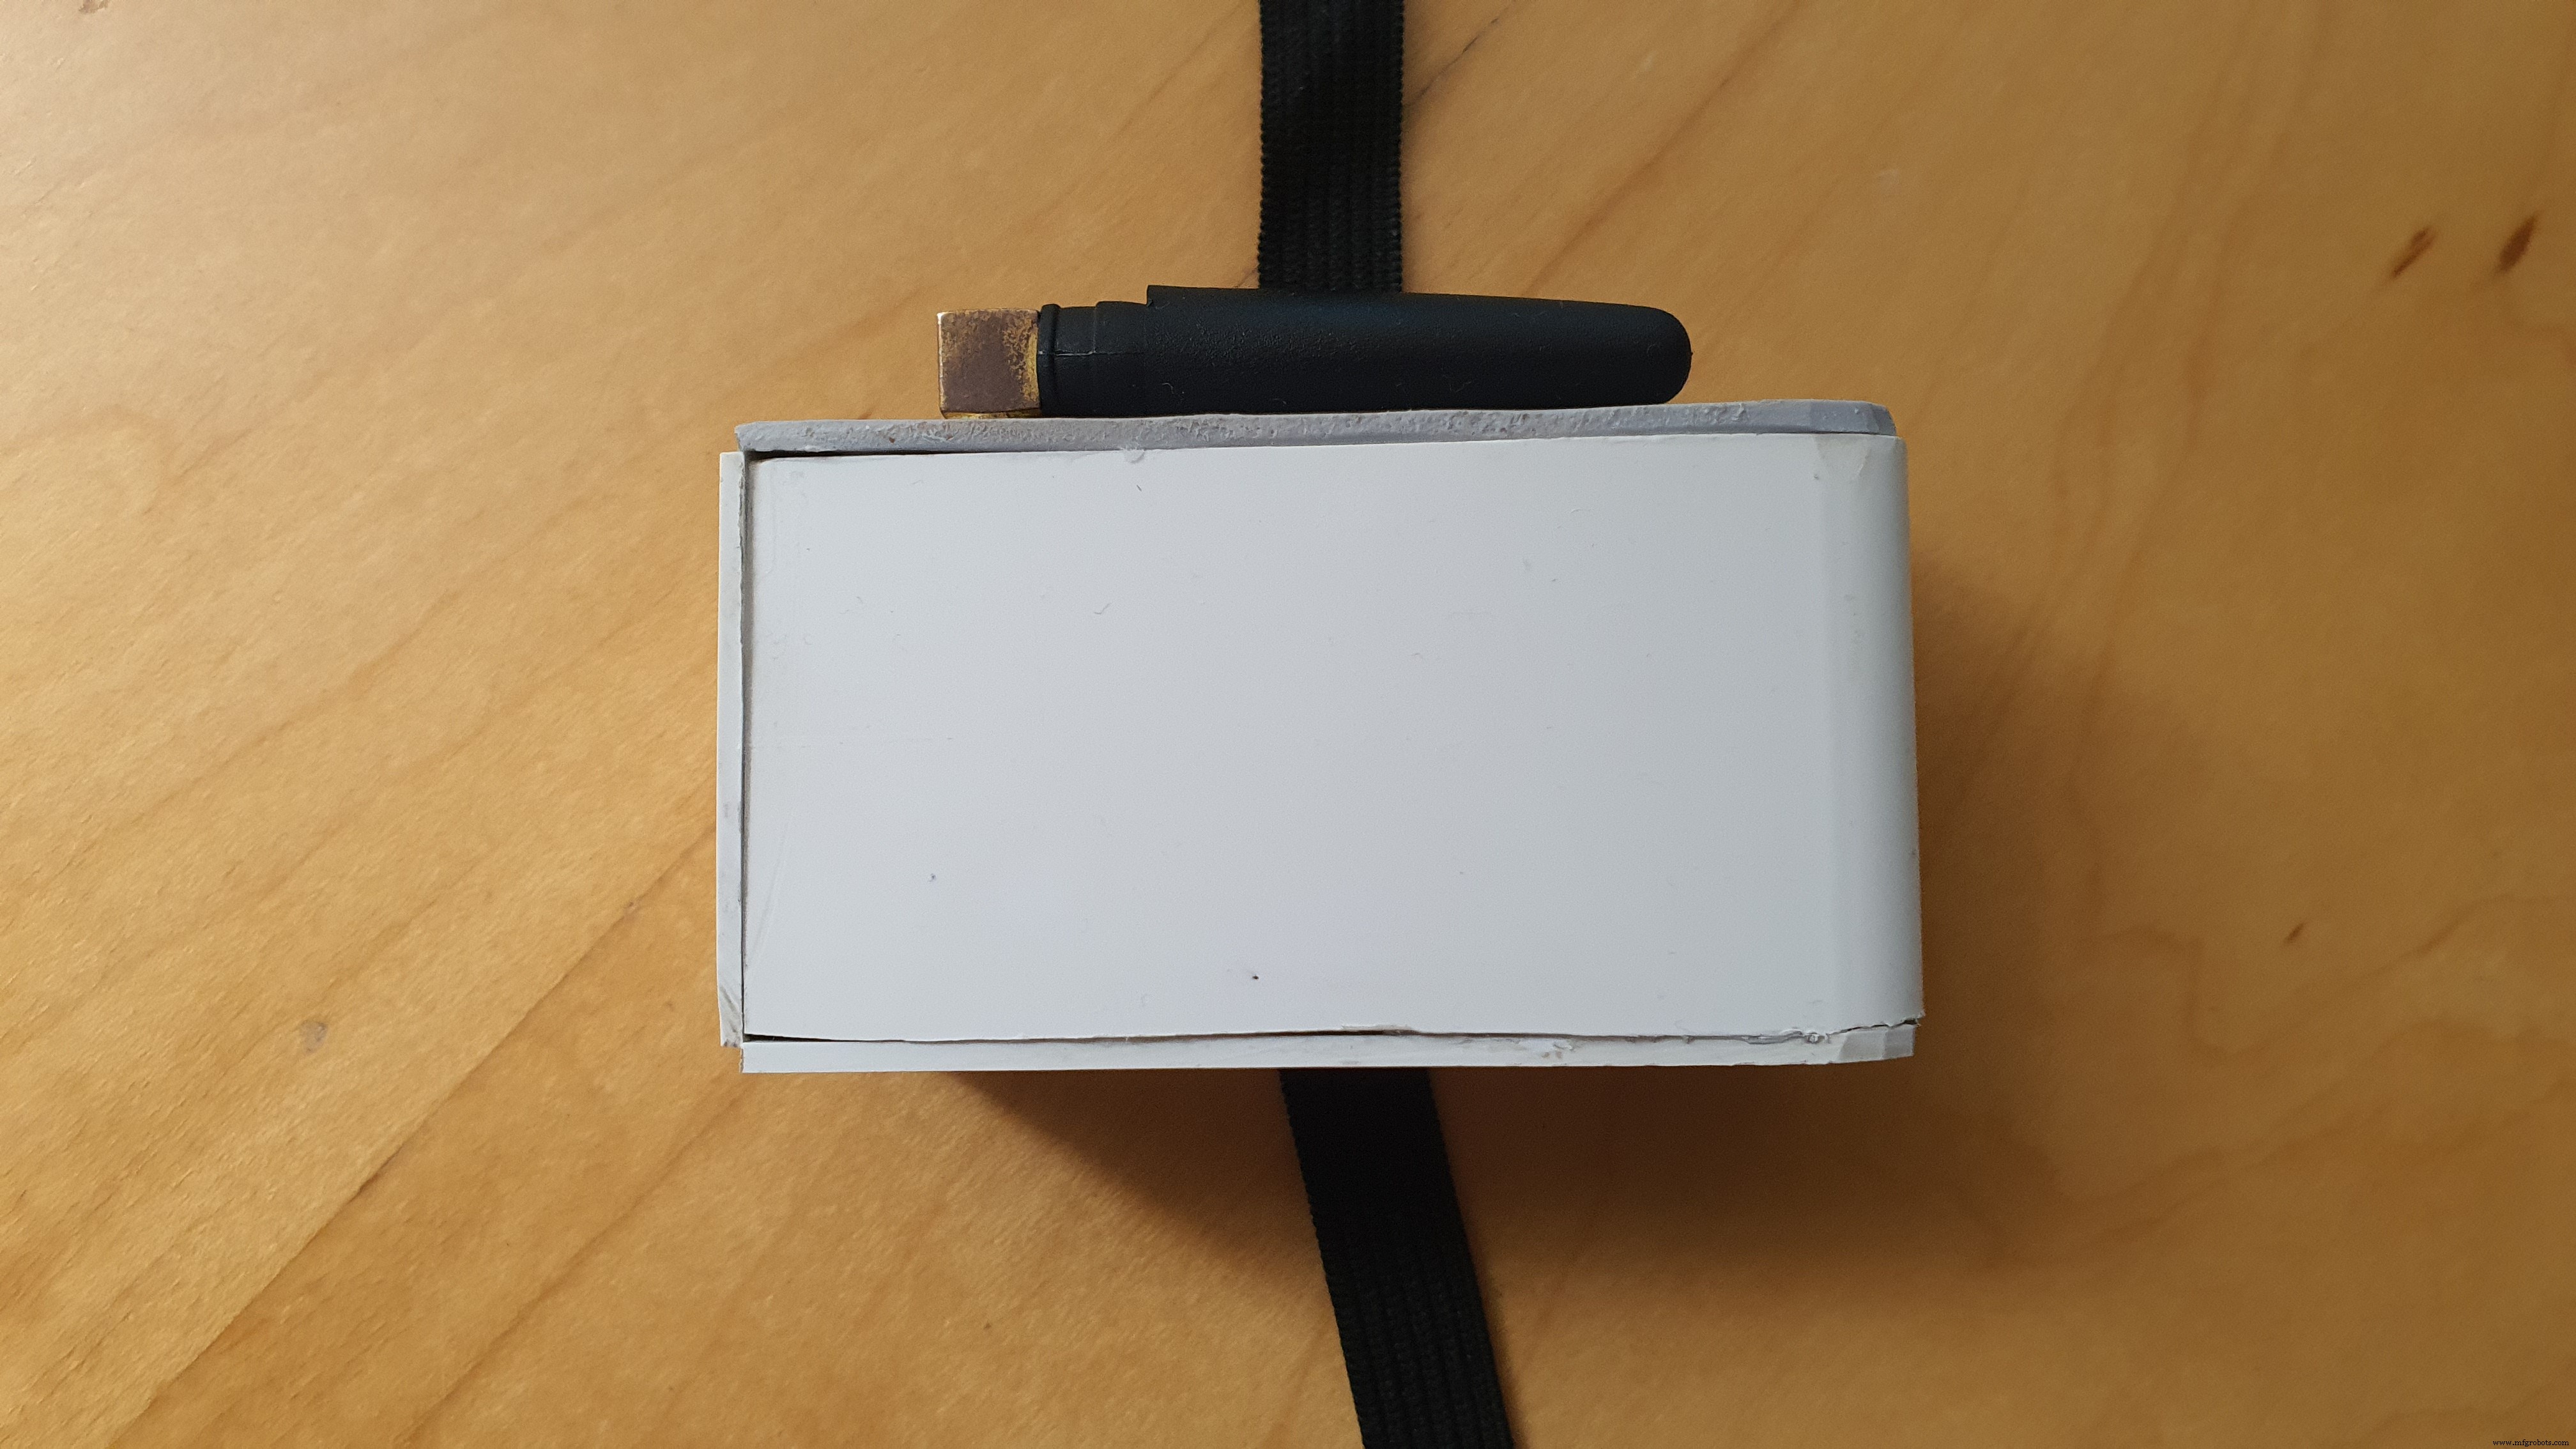
And that’s it! The project is done!
Reflection
I really enjoyed making this project. I spent a couple of hours in March brainstorming ideas to tackle the coronavirus and when this contest was announced, I started working on one of the best ideas that I believed would truly have an impact on the community – SmartWristband.
I am very proud to take part in this international effort to provide the world with low-cost scalable solutions that would help combat the virus. I was inspired by the Taiwanese government because of their smart tracking devices that ensure that people confirmed with the virus stay at home and abide by the rules of the quarantine. I felt like this system could be improved to further enhance the safety of the patient by also monitoring their heart rate and temperature while at home.
Coronavirus is a tricky problem to tackle and truly needs a lot of cooperation and devotion to overcome. I believe that this application is implementable at global level to help monitor the health of patients confirmed with weak forms of the virus allowing them to stay at home and liberate space in hospitals that can be assigned to more urgent cases.
The thing I enjoyed the most out of the making of this project was the dashboard, I really enjoyed designing it (I am a visual person). I encountered some problems connecting the Arduino MKR GSM to Azure IoT. This was because I set the expiry date of the device’s certificate to something like 2 minutes (took me a while to realise).
I really hope you enjoyed the read and thanks for taking the time and interest. Have a great day and take care.
<섹션 클래스="섹션 컨테이너 섹션 축소 가능" id="코드">
제조공정
구성품 및 소모품 Arduino 윤 원래 Yun과 함께 개발되었지만 Yun2, ESP8266, ESP32 또는 모든 Arduino와도 작동합니다. × 1 Arduino Yun Rev 2 × 1 Espressif ESP8266 ESP-12E × 1 Adafruit 서미스터 센서:아날로그 포트에서 작동하며 아래 Thermowell과 함께 사용할 수 있습니다. × 1 DS18B20 센서:4.7K 옴 저항이 있는 디지털 포트에서 작동 × 1 PT
구성품 및 소모품 Arduino UNO × 1 DHT11 온도 및 습도 센서(4핀) × 1 Adafruit RGB 백라이트 LCD - 16x2 × 1 저항 10k 옴 × 1 파워 뱅크 × 1 SparkFun 푸시버튼 스위치 12mm × 1 USB-A-B 케이블 × 1 점퍼 와이어(일반) × 1 브레드보드(일반) × 1 이 프로젝트 정보