

제조공정

산업 제조
X선 형광 분광법에 의한 분석
X선 형광(XRF)은 원소 식별 및 결정 분야에서 널리 응용되는 방출 분광 기술입니다. 이 기술은 전자빔, 하전입자빔 또는 x와 같은 외부 에너지원에 의해 원자 전자 에너지 준위가 여기된 후 일반적으로 1 keV ~ 60 keV 에너지 범위에서 특성 x-방사선의 방출에 의존합니다. - 레이 빔. 대부분의 샘플 매트릭스에서 x-선 분광기는 샘플의 1마이크로그램/g(1ppm) 미만의 농도에서 원소를 감지할 수 있습니다. 박막 샘플에서 1마이크로그램의 수십 분의 1의 총량을 감지할 수 있습니다. 초기에 x-선 분광법은 야금 및 지구화학적 분석과 관련된 응용 분야에서 널리 사용되었습니다. 보다 최근에 X선 분광법은 환경 시료 분석, 석유 제품의 황 및 마모 요소 측정, 법의학 시료와 관련된 응용 분야, 전자 및 컴퓨터 관련 재료 측정에 유용한 것으로 입증되었습니다.
X선 형광(XRF) 분광법은 많은 분석 문제에서 다용도 도구입니다. 주요 원소, 미량 원소 및 미량 원소는 금속, 합금, 유리, 시멘트, 광물, 암석, 광석, 고분자는 물론 환경 및 생물학적 물질과 같은 다양한 종류의 시료에서 정성 및 정량적으로 측정할 수 있습니다. 나트륨(Na)에서 우라늄(U)까지의 원소는 EDXRF(Energy-Dispersive X-Ray Fluorescent) 분광기를 사용하여 일상적으로 측정되는 반면 파장 분산 X선 형광(WDXRF) 분광기를 사용하면 낮은 Z 원소를 효율적으로 측정할 수 있습니다. 심지어 베릴륨(Be). 시료를 처리하지 않고 분석할 수 있지만 적절한 시료 준비를 적용하면 고품질 결과를 보장할 수 있습니다. 이는 샘플(금속, 합금)의 간단한 세척 및 연마, 바인더(세라믹, 광물, 광석, 토양 등)가 있거나 없는 분말화 및 펠릿화, 샘플을 적절한 플럭스(세라믹, 암석, 광석, 등) 산(금속, 합금)으로 소화. 이러한 방식으로 표면 거칠기, 입자 크기 효과 또는 재료의 불균일성으로 인한 오류를 제거하거나 최소화할 수 있습니다.
뢴트겐은 1895년 X선을 발견했습니다. H.G.J. Moseley는 원자 구조와 X선 방출 사이의 관계를 발전시켰고 1913년에 현대 X선 분광법의 기초가 되는 최초의 X선 스펙트럼을 발표했습니다. Moseley는 X선 기술을 사용한 정량적 원소 측정의 가능성을 인식했습니다. 오늘날 알려진 X선 분광계로 이어지는 일상적인 X선 기기의 개발은 다음 수십 년에 걸쳐 이루어졌습니다. Coolidge는 1913년에 현재 사용되는 것과 유사한 X선관을 설계했습니다. Soller는 1924년에 X선의 시준을 달성했습니다. 1928년 Geiger와 Mueller에 의한 가스 X선 검출기의 개선은 결국 1948년 Friedman과 Birks에 의해 최초의 상업용 WDXRF 설계로 이어졌습니다. 보다 최근에는 다음과 같은 다른 검출기 게르마늄 및 리튬 도핑된 실리콘 반도체 검출기는 수정된 x-선 분광계 설계를 가져왔습니다. 최신 에너지 분산 기기는 다양한 샘플의 요소를 정성적으로 식별할 수 있게 해줍니다. 에너지 분산형 X선 스펙트럼의 정보 내용은 단일 측정에서 무기 물질에서 얻을 수 있는 가장 높은 것 중 하나입니다. 스펙트럼 피크의 위치와 강도는 정성적 및 정량적 정보를 제공하고 배경 강도는 샘플 매트릭스의 대량 구성에 대한 정보를 제공합니다.
X선 분광법은 다양한 형태의 고체 시료에 적용할 수 있는 몇 안 되는 기술 중 하나입니다. 대부분의 XRF 분광계가 실험실에서 사용되지만 많은 경우 생산 및 품질 관리를 위한 일상적인 분석과 특수 작업에 응용 프로그램을 찾고 있습니다. EDXRF 분광계의 구조도는 그림 1에 나와 있습니다.
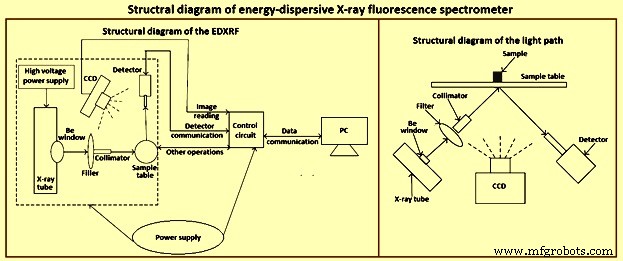
그림 1 EDXRF 분광기의 구조도
전자기 복사
전자기 복사는 공간을 통해 전파될 수 있는 에너지 형태이며 원자 및 분자와 상호 작용하여 에너지 상태를 변경할 수 있습니다. 두 속성 모두 분광학에 중요합니다. 전자기 복사는 설명하기 위해 두 가지 이론이 필요한 행동을 보여줍니다. 파동 이론은 굴절, 반사, 회절 및 산란과 같은 전자기 복사의 거동을 설명합니다. 복사는 각각 동일한 주파수와 파장을 갖는 두 개의 직교파로 구성된 에너지 형태로 정의됩니다. 하나는 진동하는 전기장이고 다른 하나는 진동하는 자기장으로 전자기 복사라는 용어를 생성합니다.
진공에서 공간을 통한 파동의 전파 속도는 빛의 속도입니다(c =3 × 10의 10cm/s의 제곱). 이것은 w.v =c 방정식으로 표현되는 중요한 기본 관계로 이어집니다. 이 표현은 전자기 복사의 파장(w)과 주파수(v)의 곱이 속도와 같다는 것을 나타냅니다. 전자기 복사의 파장은 여러 자릿수에 걸쳐 다양합니다. 예를 들어, 일반 AM 방송 대역의 전파는 파장이 수백 미터이고 자외선 파장은 10nm에서 100nm(나노미터) 범위입니다. 대조적으로, 분광학에서 유용한 x-선은 0.01 nm에서 10 nm 범위입니다(그림 2).
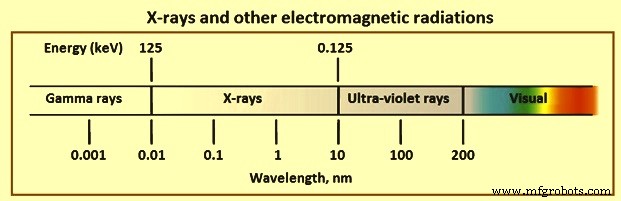
그림 2 X선 및 기타 전자기 복사
파장 분산 분광법의 경우 종종 파장 단위를 사용하는 것이 더 편리하지만 에너지 분산형 X선 분광법(EDS)의 경우 에너지 설명이 더 편리합니다. 그러나 상호 변환은 간단합니다.
X선의 특성에 대해 일반적으로 사용되는 몇 가지 설명이 중요합니다. 전자기 복사 강도의 적절한 의미는 단위 시간당 단위 면적당 에너지입니다. 그러나 검출기의 단위 시간당 카운트 수는 강도로 자주 사용됩니다. 면적은 사용된 검출기의 활성 영역이고 시간은 조정 가능한 매개변수이기 때문에 계수 사용은 x선 강도에 대한 실용적인 설명입니다. 하드 또는 소프트 x-선이라는 용어는 각각 짧은(0.01 nm ~ 0.1 nm) 및 긴(0.1 nm ~ 1 nm) 파장의 x-선을 구별하는 데 자주 사용됩니다. X선은 전자기 스펙트럼의 고에너지 영역에 속합니다.
X선 방출
X선은 원자의 전자 궤도의 교란으로 인해 생성됩니다. 이것은 여러 가지 방법으로 수행할 수 있으며 가장 일반적인 것은 고에너지 전자, X선 또는 가속된 하전 입자로 대상 요소에 충격을 가하는 것입니다. 처음 두 가지는 X선 분광법에서 직접 또는 간접적으로 자주 사용됩니다. 전자 충격은 X선 에너지의 연속체와 대상 요소의 복사 특성을 초래합니다. 두 가지 유형의 방사선은 모두 X선 분광법에서 발생합니다.
연속체 – 에너지에 대한 강도의 부드럽고 연속적인 기능을 가진 X선 방출을 연속체 또는 제동복사(bremsstrahlung)라고 합니다. X선 연속체는 여러 가지 방법으로 생성할 수 있습니다. 그러나 가장 유용한 것은 X선관의 표적을 공격하는 데 사용되는 전자빔입니다. 연속체는 다양한 에너지의 궤도 전자 분포인 표적에 충돌하는 고에너지 전자의 점진적인 감속의 결과로 생성됩니다. 충돌하는 전자가 결합된 궤도 전자와 상호작용함에 따라 운동 에너지의 일부가 복사로 변환됩니다. 변환된 양은 관련된 전자의 결합 에너지에 따라 다릅니다. 따라서 각 상호 작용으로 변환되는 에너지의 양에 대해 약간의 통계적 확률이 존재합니다.
충돌 전자가 대상 원소의 궤도 전자와 상호 작용할 확률은 원소의 원자 번호에 따라 증가하므로 연속체 방출의 강도는 대상 원소의 원자 번호에 따라 증가합니다. 또한 상호 작용의 확률은 빔 또는 플럭스의 단위 시간당 전자 수에 따라 증가합니다. 따라서 연속체의 강도는 밀리암페어로 표시되는 전자빔 전류에 따라 증가합니다. 더욱이, 충돌하는 전자가 표적 원소의 단단히 결합된 전자와 상호작용하는 능력은 충돌하는 전자의 운동 에너지와 함께 증가합니다. 빔에 있는 전자의 운동 에너지는 가속 전위와 함께 증가하므로 연속체의 통합 강도는 킬로볼트로 표시되는 전자 가속 전위와 함께 증가합니다. 마지막으로, x-선 광자로 나타나는 최대 에너지는 충돌하는 전자의 운동 에너지와 같으며, 이는 차례로 가속 전위와 관련됩니다. 연속체에서 최대 강도의 에너지는 최대 방출 에너지의 약 2/3에 있습니다. 또한, 표적 물질 내에서 X선의 흡수 또는 X선관 및 검출기의 창에 사용되는 물질에 의한 흡수가 있다. 따라서 특히 낮은 X선 에너지에서 강도 분포의 일부 수정이 발생할 수 있습니다.
특성 방출 – 표적에 충돌하는 대부분의 전자는 비특이적 상호작용에서 표적 원소의 궤도 전자와 상호작용하며 내부 궤도 전자의 교란이 거의 또는 전혀 발생하지 않습니다. 그러나 일부 상호 작용으로 인해 이러한 궤도에서 전자가 방출됩니다. 결과로 생기는 공석 또는 구멍은 고에너지 불안정 상태를 나타냅니다. 궤도 공석이 가장 안쪽 껍질에 있으면 바깥 껍질의 전자가 캐스케이드하여 채우고 결과적으로 더 낮은 에너지와 더 안정적인 상태가 됩니다. 이 과정에서 방출되는 에너지는 X선으로 나타날 수 있습니다. 발생할 수 있는 각각의 전이는 대상 요소와 관련된 전이의 특성인 날카로운 X선 선의 방출로 이어집니다. 이러한 특성 방사선은 연속체와 함께 방출됩니다.
X선 흡수
시료에 충돌하는 X선은 시료의 요소와 두 가지 중요한 상호작용, 즉 흡수와 산란을 겪습니다. 방사선의 흡수는 X선 분광법의 시료 여기에서 상당한 특정 상호 작용이나 시료에서 방출되는 X선 강도에 영향을 미치는 보다 일반적인 상호 작용에 의해 발생할 수 있습니다. X선의 산란은 관찰된 스펙트럼의 배경 강도로 이어집니다.
질량 흡수 – X선 빔이 물질을 통과할 때 광자(전자기장)는 대상 요소의 궤도에 있는 전자와 비특정 방식으로 상호 작용하여 X선 빔의 강도를 감소시킬 수 있습니다. 상호 작용은 전자의 광전 방출 또는 X선 빔의 산란으로 이어질 수 있습니다. 두 경우 모두 전체 결과는 종종 흡수 재료의 경로 길이에 따른 강도의 지수적 감소로 설명됩니다. 질량 흡수 계수는 x-방사선의 지정된 에너지에서 주어진 요소의 특성입니다. 그 값은 x-방사선의 파장과 대상 원소의 원자 번호에 따라 달라집니다.
광전 효과는 X선이 물질을 통과할 때 흡수로 이어지는 과정 중 가장 중요합니다. 광전 효과는 X선 표적에 있는 원소의 궤도에서 전자가 방출되는 것입니다. 이 과정은 종종 X선 흡수의 주요 원인이며 샘플의 요소에서 방출되는 X선 스펙트럼의 여기 모드입니다. 주로 광전 과정의 결과로 질량 흡수 계수는 입사 x-방사선의 에너지가 증가함에 따라 꾸준히 감소합니다. 주어진 원소에 대한 흡수 대 에너지 곡선은 날카로운 불연속성을 가지고 있습니다. 이는 광전 과정이 특히 효율적인 특성 에너지의 결과입니다.
분산 – x-선 광자가 원자 집합에 충돌할 때 광자는 대상 요소의 전자와 상호 작용하여 그림 3과 같이 x-선 광자의 산란을 초래할 수 있습니다. 샘플에서 x-선의 산란은 다음과 같습니다. X선 분광법에서 얻은 스펙트럼에서 배경 신호의 주요 소스. X선의 산란은 주로 외부의 약한 원소 전자에 의해 발생합니다. 충돌이 탄력적이면 에너지 손실 없이 산란이 발생하며 이를 레일리 산란이라고 합니다. 비탄성인 경우 X선 광자는 에너지를 잃어 전자 방출을 일으키고 산란은 일관성이 없습니다. X선 광자의 경로가 편향되고 광자는 에너지 손실 또는 더 긴 파장을 갖는다. 이것은 Compton 산란입니다.
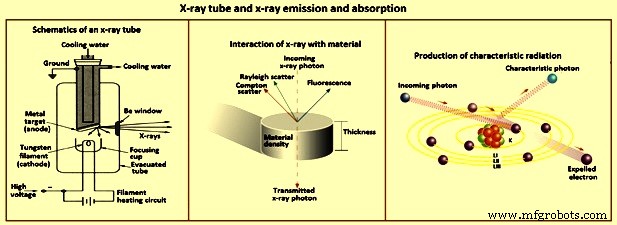
그림 3 X선관과 X선 방출 및 흡수
산란은 두 가지 방식으로 X선 분광법에 영향을 미칩니다. 첫째, 산란된 방사선의 총량은 전자의 수가 많기 때문에 원자 번호에 따라 증가합니다. 그러나 낮은 원자 번호 매트릭스를 가진 샘플은 샘플에 의한 감소된 자기 흡수 때문에 더 큰 관찰된 산란을 보여줍니다. 둘째, 샘플 매트릭스의 원자 번호가 감소함에 따라 'Compton-to-Rayleigh' 산란 강도의 비율이 증가합니다. Compton 산란과 관련된 에너지 손실은 방사선 파장의 예측 가능한 변화를 초래합니다.
요소와 X선의 관계
원소와 엑스선 사이의 다른 관계는 그림 4에 나와 있습니다.
<강한> 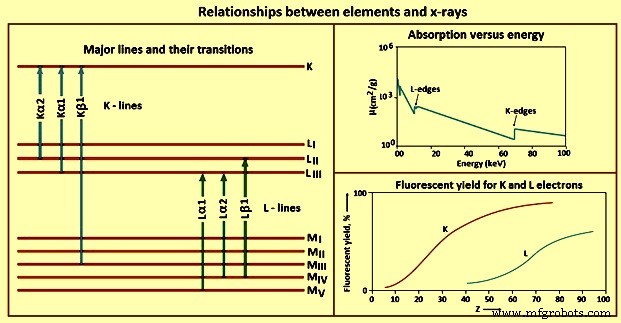
그림 4 요소와 X선의 관계
흡수 – X선 광자는 흡수되거나 산란되는 원소의 궤도 전자와 상호 작용할 수 있습니다. 흡광도와 원소의 원자번호 사이의 관계는 X선 분광법을 위한 최적의 작동 조건을 선택하는 데 중요합니다.
질량 흡수 계수는 주어진 X선 에너지 및 X선의 각 에너지에서 각 원소 또는 물질에 대해 주어진 원소 또는 물질에 대해 다릅니다. 궤도 전자와의 상호 작용 가능성이 높기 때문에 대상 물질의 원소 원자 번호에 따라 질량 흡수 계수가 증가합니다. 주어진 원자 번호에서 질량 흡수 계수는 X선 복사의 파장에 따라 감소합니다. 이는 원자의 다른 궤도에서 전자를 광전 방출하는 데 필요한 특정 에너지의 결과이며 요소의 특성입니다.
흡수 모서리는 질량 흡수 대 입사 x-방사선의 파장 또는 에너지 플롯에서 불연속성 또는 임계점입니다. 흡수단 에너지는 원소의 궤도에서 전자를 광 방출하는 정확한 양입니다. 주 양자수가 낮을수록 그 껍질에서 전자를 방출하는 데 주의를 기울이는 에너지가 높아집니다. L 전자를 방출할 수 있는 X선의 파장은 K 껍질에서 전자를 방출하는 데 필요한 것보다 더 길다(에너지가 적음). 즉, K 흡수단 에너지는 주어진 원소에 대한 L 흡수단 에너지보다 큽니다.
방출 – 광전 효과는 원자의 전자 궤도에서 불안정한 상태가 생성되는 X선 흡수 메커니즘입니다. 내부 오비탈에 공석이 형성되면 여기된 요소의 특성인 X선 방출에 의해 안정된 바닥 상태로의 이완이 발생할 수 있습니다. 1 의 에너지 전자는 원자가 전자의 상태로부터 보호되어 흡수단 에너지와 방출된 X선 에너지가 원자의 산화 상태 및 결합과 본질적으로 독립적입니다.
K 라인 – 광전 효과가 K 껍질에 빈 공간을 생성하면 외부 궤도의 전자로 빈 공간을 채우면서 여기 상태가 완화됩니다. 선택 규칙이라는 양자 역학 규칙 때문에 특정 전환만 허용됩니다. 선택 규칙을 따르는 전이를 허용(다이어그램) 선이라고 하고, 금지되지 않은 전이를 금지라고 하며, 방출 시 내부 궤도에 두 개 이상의 빈자리가 있는 원자를 생성하는 전이를 위성(비 다이어그램)이라고 합니다. ) 라인. K 선의 수와 원소에 대해 관찰된 정확한 선은 부분적으로 채워진 궤도의 수에 따라 다릅니다.
L 라인 – 대부분의 WDXRF x-선 분광기의 실제 에너지 범위는 0 keV ~ 100 keV이고 EDXRF 분광기의 경우 0 keV ~ 40 keV이므로 K 라인 이외의 방출선 사용을 고려해야 합니다. 주어진 요소에 대해 L선은 K선보다 낮은 X선 에너지로 여기됩니다. L 라인의 사용은 원자 번호가 약 45보다 큰 요소에 특히 유용합니다.
M 라인 –M 라인은 일상적인 X선 분광법에서 제한된 적용을 찾습니다. 원자번호가 57 이하인 원소는 선이 관찰되지 않고 관찰 시 전이 에너지가 낮다. 이 라인의 유일한 실용적인 용도는 토륨, 프로탁티늄 및 우라늄과 같은 원소에 대한 것입니다. 샘플에 있는 다른 요소의 L 라인과 간섭을 피하기 위해 이러한 경우에만 사용해야 합니다.
형광 수율 – X선 광자 방출 또는 2차(Auger) 전자 방출의 두 가지 가능한 결과로 광전 과정에 의해 원자 궤도에서 전자가 방출됩니다. 각 여기된 원자에 대해 이러한 이벤트 중 하나가 발생하지만 둘 다 발생하지는 않습니다. 따라서 2차 전자 생산은 샘플의 여기된 원자에서 X선 광자 방출과 경쟁합니다. X선을 방출하는 여기된 원자의 비율을 형광 수율이라고 합니다. 이 값은 고려 중인 요소와 엑스선 라인의 속성입니다. 낮은 원자 번호 요소는 또한 낮은 형광 수율을 갖습니다. 저에너지 X선이 보여주는 높은 질량 흡수 계수와 함께 X선 분광법으로 낮은 원자 번호 요소를 감지하고 결정하는 것은 어렵습니다.
요소간 효과 – X선 분광법의 전이에 대해, 원소의 주어진 계열(K, L, M)에 대한 방출선은 해당 계열에 대한 흡수단과 같거나 더 큰 에너지를 갖지 않습니다. 중요한 결과는 한 요소에서 방출된 x-선이 해당 요소의 다른 원자의 동일한 궤도에서 전자를 광 방출할 수 없다는 것입니다. 그러나 요소의 혼합으로 구성된 샘플은 종종 요소 간 효과라고 하는 상호 작용을 나타낼 수 있습니다. 샘플 내 요소의 이러한 상호 작용에는 종종 특별한 데이터 분석이 필요합니다.
WDXRF 분광기
1950년대에 상업적으로 도입된 X선 분광 측정기는 샘플에서 방출된 복사선이 Soller collimator를 사용하여 시준된 다음 분석 결정에 충돌함을 나타내는 파장 분산으로 알려져 있습니다. 결정은 브래그의 법칙과 x-방사선의 파장 또는 에너지에 따라 다른 정도로 방사선을 회절시킵니다. 이러한 방사선의 각 분산은 샘플의 요소에서 방출되는 x-선을 순차적 또는 동시적으로 감지할 수 있도록 합니다.
동시 기기에는 일반적으로 여러 세트의 분석 결정체 및 검출기가 포함되어 있습니다. 하나는 샘플의 원하는 각 분석 물질에 대해 조정됩니다. 고가이지만 이러한 기기는 미리 선택된 요소의 일상적인 결정에 효율적이지만 설치 시 선택한 요소 이외의 요소를 결정하기 위해 쉽게 변환되지 않습니다.
샘플, 분석 결정 및 검출기 사이의 각도를 변경하는 각도계로 알려진 기계 시스템을 포함하는 순차 기기가 더 일반적입니다. 이러한 방식으로 각도계의 움직임에 따라 원하는 x-방사선 파장을 선택할 수 있습니다. 순차 WDXRF 분광기는 많은 요소의 자동 측정을 위해 컴퓨터로 제어할 수 있습니다. 자동화된 WDXRF 분광기의 정량적 적용은 원하는 측정을 위해 정확한 각도로 이동하도록 기기를 프로그래밍할 수 있기 때문에 효율적입니다. 그러나 스펙트럼이 천천히 스캔되기 때문에 정성적 응용 프로그램은 효율성이 떨어집니다.
X선관 – 다양한 에너지원을 사용하여 X선 방출을 생성하는 원소의 원자에서 여기된 전자 상태를 생성할 수 있습니다. 이들 중에는 전자빔, 하전 입자빔 및 x-방사선이 있습니다. 전자빔은 주사전자현미경(SEM) 및 전자현미경 프로브 분석과 같은 기술에서 시료를 향합니다. 그러나 전자빔의 사용은 전자의 에너지 손실을 피하기 위해 고진공이 필요하다. X선 분광법은 전문 도구가 아닌 다용도 분석 도구로 사용하는 것이 가장 좋습니다. 많은 샘플은 고진공에 적합하지 않거나 전자빔 아래에서 충전 문제를 일으키는 비전도체입니다. 따라서 이 에너지원은 X선 분광법에 실용적이지 않습니다.
X선을 방출하는 방사성 동위원소는 원자가 여기되어 X선을 방출할 수 있는 또 다른 가능성입니다. 그러나 실험실에서 안전하게 취급할 수 있는 동위원소 소스의 X선 플럭스는 실제 사용하기에는 너무 약합니다. 이러한 소스는 일반적으로 몇 개의 좁은 x-선 선만 방출하기 때문에 많은 요소를 효율적으로 여기하려면 여러 개가 필요합니다. X선 분광법의 가장 실용적인 에너지원은 X선관입니다(그림 3).
WDXRF 분광계가 제대로 작동하려면 효율적인 고출력 여기가 필요합니다. 따라서 X선관의 안정성과 신뢰성이 중요하다. 모든 구성 요소는 고진공 상태입니다. 필라멘트는 6V ~ 14V의 필라멘트 전압으로 가열됩니다. 가열된 필라멘트는 열적으로 전자를 방출합니다. 필라멘트와 대상 양극 사이를 흐르는 전자의 플럭스는 고도로 조절되고 제어되어야 합니다. 이 전자 흐름은 전류이며 일반적으로 밀리암페어 단위로 측정됩니다. 관전류는 종종 mA라고 합니다.
필라멘트(음극)와 대상 양극 사이에 수 킬로볼트의 전위가 적용되며, 이는 전자의 가속 전위 역할을 합니다. 이 전압은 일반적으로 킬로볼트 단위로 측정됩니다. 양극은 일반적으로 구리이며 대상 표면은 로듐, 은, 크롬, 몰리브덴 또는 텅스텐과 같은 원소의 고순도 증착물로 도금됩니다. WDXRF 분광법에 사용되는 X선관은 2kW ~ 3kW에서 작동합니다. 이 전력의 대부분은 열로 소산되며 X선관의 수냉식 설비가 필요합니다. 이러한 X선관의 전원 공급 장치 및 관련 전자 장치는 큽니다. 전자는 적용된 튜브 전위와 동일한 최대 운동 에너지로 대상을 공격합니다. 전자의 운동 에너지가 표적 물질의 원자로부터 내부 궤도 전자의 방출에 상응하는 흡수단 에너지를 초과하면 관은 표적 원소의 특성인 X선 선을 방출한다. 빔의 전자와 타겟 요소의 전자의 상호 작용은 또한 연속체의 방출로 이어집니다. 연속체의 면적과 최대 강도의 파장은 전위, 전류 및 양극 구성에 따라 달라집니다.
결정 분석 – X선관에서 방출된 X선은 시료에 조사됩니다. 대부분의 X선 분광기에서 샘플은 도립 광학 장치로 알려진 X선 튜브 위에 배치됩니다. 이것은 상부가 아닌 하부 표면을 사용하여 액체의 표면을 위치시키는 것을 용이하게 한다. 샘플에서 방출된 x-방사선은 시준되어 분석 결정의 표면에 충돌하여 방사선을 분산시킵니다. 샘플에서 나온 다색 x-방사선의 평행 빔은 결정의 다른 격자 평면에서 회절됩니다. 방사선이 다른 격자 평면에서 회절에 의해 이동하는 추가 거리가 파장의 정수배인 경우 강화가 발생합니다. 그렇지 않은 경우 상쇄 간섭이 발생합니다. 브래그의 법칙은 분석 결정에 대해 파장이 선택되는 각도의 계산을 허용합니다.
탐지기 – WDXRF 분광계의 검출기 및 관련 전자 장치는 분석 크리스탈에서 회절된 x-선을 감지하고 분석 크리스탈 또는 검출기 노이즈에 의해 더 높거나 낮은 차수의 회절과 같은 원하지 않는 신호를 거부합니다. 일반적으로 두 개의 감지기가 나란히 배치됩니다. 첫 번째는 가스 충전 또는 유동 가스 비례 검출기입니다. 이 감지기는 하우징과 절연된 와이어로 구성됩니다. 하우징의 전면과 후면에 있는 얇은 폴리머 창은 x-방사선의 진입 및 배출을 허용합니다. 와이어와 하우징 사이에 수백 볼트의 바이어스 전위가 가해집니다.
많은 가스를 사용할 수 있지만 일반적인 가스는 90% 아르곤(Ar)과 10% 메탄의 혼합물인 P-10입니다. X선이 검출기에 들어가면 아르곤이 이온화되어 많은 Ar+-e- 쌍을 생성합니다. 양극 와이어는 전자를 수집하고 하우징의 음극 벽에 있는 전자는 Ar+ 이온을 중화합니다. 결과는 검출기에 들어가는 각 X선 광자에 대한 전류 펄스입니다. P-10 충전 비례 검출기는 약 8keV(약 0.15nm 이상의 파장) 미만 에너지의 X선 광자를 검출하는 데 가장 효율적입니다. 더 강력한 X선은 비례 검출기를 통과하는 경향이 있습니다.
비례 계수기 뒤에 자주 위치하는 두 번째 감지기는 일반적으로 섬광 감지기입니다. 이 검출기는 탈륨이 도핑된 요오드화나트륨 결정[NaI(Tl)]으로 구성되어 있으며, X선 광자와 충돌할 때 청색(410nm) 빛의 폭발을 방출합니다. 크리스탈은 광 펄스를 감지하는 광전자 증배관에 장착됩니다. 생성된 광자의 수는 입사된 X선 광자의 에너지에 비례합니다. 전자 처리 후 섬광 버스트는 X선 광자 에너지에 진폭에 비례하는 전압 펄스로 변환됩니다. 이 두 감지기는 독립적으로 또는 동시에 작동할 수 있습니다. 동시 작동에서 감지기 작동 전위와 출력 이득은 주어진 에너지의 x-선 광자가 두 감지기에서 동일한 펄스 높이 전압을 생성하도록 조정되어야 합니다. 두 검출기 유형 모두 펄스 간 복구에 약 1마이크로초가 필요합니다. 일부 카운트는 약 30,000/s 이상의 입사 광자 비율에서 손실될 수 있습니다. 검출기에서 나오는 X선 펄스의 펄스 높이 식별은 분석 결정에서 회절된 더 높거나 낮은 차수의 X선을 거부합니다.
작동의 기본 – 시료가 고려되고 분석 물질이 선택되면 첫 번째 결정은 방출 라인을 선택하는 것입니다. 특정 간섭이 없는 경우 일반적으로 그럴듯한 가장 강력한 선이 사용됩니다. 원자 번호가 약 75보다 작은 요소의 경우 일반적으로 K 선입니다. 많은 WDXRF 분광기가 X선관에 대해 100kV 전위로 작동할 수 있기 때문입니다. 가능한 경우 분석 요소에 사용할 라인의 흡수 가장자리 바로 위의 에너지에서 특성 라인을 방출하는 X선 튜브가 선택됩니다. 이러한 튜브를 사용할 수 없는 경우 사용 가능한 X선 튜브의 연속체를 사용하여 여기를 수행해야 합니다.
X선관의 전위는 흡수단 에너지의 약 1.5배 이상으로 설정됩니다. 검출기는 사용할 파장 영역에 따라 선택해야 합니다. 비례 계수기는 약 0.6 nm보다 긴 x-선, 약 0.2 nm보다 짧은 파장에 대한 섬광 검출기 및 0.2 nm에서 0.6 nm의 중첩 영역에 대해 모두 사용됩니다. 원하는 파장을 감지할 수 있는 분석 결정을 선택해야 합니다. 대부분의 매개변수 선택은 컴퓨터 제어를 통해 수행됩니다.
에너지 분산형 X선 분광기
WDXRF x-선 분광기에서 각도계를 사용하는 것은 샘플의 다양한 요소에서 방출되는 x-선을 구성 요소로 분해해야 하는 요구 사항을 기반으로 합니다. 분산 장치의 사용은 이 작업을 수행하기 위한 여러 유형의 분광학에서 일반적입니다. 적절한 분해능을 얻을 수 있는 경우 기계적 구성 요소가 없는 기기가 바람직합니다. 1960년대 중반 리튬 드리프트 실리콘 검출기의 개발과 X선 검출에 대한 적용은 EDXRF 분광법으로 알려진 분광 분석 분야로 이어졌습니다.
WDXRF 분광계에 사용되는 X선관의 정격은 2kW ~ 3kW이며 수냉식입니다. EDXRF 분광계에 사용되는 것은 훨씬 낮은 전력으로 작동하며 일반적으로 공랭식입니다. 일반적인 튜브의 범위는 9W에서 100W입니다. 다양한 양극 재료를 사용할 수 있으며 각 X선 분광계 제조업체는 특별한 X선 튜브 기능을 제공합니다. 그러나 WDXRF 분광계에 사용되는 것보다 훨씬 작지만 튜브 설계를 여러 번 시도한 후에도 대부분은 전통적인 '측면 창' 설계로 유지됩니다. 튜브 및 관련 전원 공급 장치 설계의 주요 요소는 튜브 및 전압의 안정성입니다.
직접 X선관 여기의 대안은 2차 표적 여기를 사용하는 것입니다. 이 모드에서 X선 튜브는 2차 표적을 조사하는 데 사용되며, 이 표적의 특징적인 X선 형광은 차례로 샘플의 X선 방출을 여기시키는 데 사용됩니다. 2차 표적을 사용할 때 상당한 효율 손실이 발생하기 때문에 직접 여기에 필요한 것보다 더 높은 와트의 X선관이 필요합니다.
2차 타겟 가진은 때때로 상당한 이점을 제공합니다. 예를 들어, 철 샘플에서 바나듐 및 크롬의 낮은 농도 수준을 결정하기 위해 이러한 원소는 샘플에서 철의 여기 없이 철 2차 타겟으로 여기될 수 있습니다. 직접관 여기에서는 이것이 어렵습니다. 광범위한 요소를 다루기 위해서는 몇 가지 2차 목표가 필요합니다. 2차 타겟 여기의 사용은 여기를 위한 단색 방사선 소스로 지원되었습니다. 이 장점의 중요성은 기본 X선 방정식에서 직접 강도를 계산하는 데 사용되는 많은 기본 매개변수 컴퓨터 프로그램에 단색 여기 복사가 필요하다는 것입니다.
실제로, 2차 표적 여기는 이상적인 단색 복사에만 접근합니다. 적절한 1차 필터를 사용한 직접관 여기는 2차 표적 기술과 비교할 때 잘 수행됩니다. 따라서 직접 X선관 여기가 에너지 분산 분광법(EDS)의 가장 많은 응용 분야에 가장 실용적입니다. EDS 기술의 주요 장점은 동시 다중 요소 분석 기능에 있습니다. Although special cases occur in which selective excitation is desirable, this frequently can be accomplished with intelligent use of an appropriate x-ray tube and filter. Any fundamental design features which limit the simultaneous multi-element capability diminish the advantage of the EDXRF spectrometer.
Since direct x-ray tube excitation is the most common method used in EDS, there are factors which govern the selection of an x-ray tube. In wavelength-dispersive techniques, several x-ray tubes are normally available for the spectrometer. These can be changed for different applications. This is not normally the case with EDS-systems, since many WDXRF spectrometer has few if any choices of primary filters. In wavelength-dispersive techniques, it is customary to attempt to excite the desired element by the characteristic emission lines of the tube anode material, but the continuum is used more efficiently in EDXRF spectrometers. The use of EDXRF spectrometers has been enhanced by computer control of tube current and voltage and selection of the primary filter. Selection and efficient use of a single x-ray tube is important in the configuration of an EDXRF system.
Characteristic lines emitted by an x-ray tube have much larger intensity at their maxima than the continuous radiation emitted. These lines are to be used for excitation whenever possible. In addition, use of a primary filter between the x-ray tube and the sample can effectively approximate monochromatic radiation impinging on the sample from these characteristic lines. EDXRF spectrometers normally offer various x-ray tube anode materials. For selecting the x-ray tube anode material, the applications most likely to be encountered are to be considered.
The principal concern is to select an anode which has characteristic lines close to, but always higher, in energy than the absorption-edge energies to be encountered. None of the characteristic lines are to create spectral interference with elements to be determined. This includes consideration of such details as the Compton scatter peak for the characteristic lines. In addition, it is difficult to perform determinations of the element of the anode material. This is especially true with samples having low concentrations of that element.
Rhodium is a favourable tube anode material for general-purpose use. The characteristic lines of this element are efficient for the excitation of elements with absorption edges to around 15 keV. The excitation efficiency for the K lines of the transition elements is low. However, the continuum can be used efficiently in this region. Rhodium also has characteristic L lines at around 2.7 keV to 3.0 keV. These are efficient for the excitation of the K lines of low atomic number elements, such as aluminum, silicon, phosphorus, and sulphur. However, in these cases, a silver anode is preferable because of the Compton scatter radiation from the rhodium lines. The characteristic lines and the continuum from the x-ray tube can be used for excitation.
Although the elements of many samples can be excited effectively using a combination of the characteristic x-ray lines from the tube anode element and the continuum, more monochromatic radiation is sometimes desired. One such situation involves enhancing the use of fundamental-parameter computations which permit quantitative determination of elements without the need for several concentration standards. A more frequent situation is the need to reduce the background in the spectrum energy range to be used in the analysis. Use of primary filters placed between the x-ray tube and the sample can be effective in these cases and are normally incorporated under computer control in commercial spectrometers.
The object is to filter the primary radiation from the x-ray tube and selectively pass the characteristic lines of the anode element. This is accomplished using a filter made of the same element as the tube anode. Since x-rays of a given line (K, L, and so on) of an element are lower in energy than the absorption edge for that element, the photoelectric component of the mass absorption coefficient is small. Such a filter does not efficiently absorb the characteristic line emitted by the x-ray tube. The higher energy x-rays from the continuum are efficient for the photoelectric process in the filter and are highly attenuated by absorption. X-rays of lower energy than the filter material absorption edge are absorbed more efficiently as the energy decreases.
The result is x-radiation striking the sample with an intensity which is largely determined by the characteristic lines of the tube anode and that approximates monochromatic radiation. Increasing the thickness of the filter decreases the total intensity, with further gain in the monochromatic approximation.
Detectors – The selective determination of elements in a mixture using x-ray spectrometry depends upon resolving into separate components the spectral lines emitted by the different elements. This process needs an energy-sorting or wavelength-dispersing device. For the WDXRF spectrometer, this is accomplished by the analyzing crystal, which needs mechanical movement to select each desired wavelength according to Bragg’s law. Optionally, several fixed-crystal channels can be used for simultaneous measurement. In contrast, EDS is based on the ability of the detector to create signals proportional to the x-ray photon energy. Hence, mechanical devices, such as analyzing crystals, are not needed.
Several types of detectors have been used, including silicon, germanium, and mercuric iodide. The solid-state, lithium-drifted silicon detector [Si(Li)] was developed and applied to x-ray detection in the 1960s. By the early 1970s, this detector was firmly established in the field of x-ray spectrometry and was applied as an x-ray detection system for SEM and x-ray spectrometry. The Si(Li) detector provides excellent resolution. It can be considered as a layered structure. Under reversed bias of around 600 V, the active region acts as an insulator with an electric-field gradient throughout its volume.
When an x-ray photon enters the active region of the detector, photo ionization occurs with an electron-hole pair created for each 3.8 eV of photon energy. Ideally, the detector is to completely collect the charge created by each photon entry and result in a response for only that energy. Some background counts appear because of energy loss in the detector. Although these are kept to a minimum by engineering, incomplete charge collection in the detector contributes to background counts. From 1 keV to 20 keV, an important region in x-ray spectrometry, silicon detectors are efficient for conversion of x-ray photon energy into charge.
Analyzer systems – The x-ray spectrum of the sample is obtained by processing the energy distribution of x-ray photons which enter the detector. One x-ray photon entering the detector causes photo-ionization and produces a charge proportional to the photon energy. Several electrical sequences are to take place before this charge can be converted to a data point in the spectrum. A detailed knowledge of the electronics is not necessary, although an understanding of their functions is important. Upon entering the Si(Li) detector, an x-ray photon is converted into an electrical charge which is coupled to a field effect transistor (FET). The FET and the electronics comprising the preamplifier produce an output proportional to the energy of the x-ray photon. Using a pulsed optical preamplifier, this output is in the form of a step signal. Since photons vary in energy and number per unit time, the output signal, due to successive photons being emitted by a multi-element sample, resembles a staircase with various step heights and time spacing. When the output reaches a determined level, the detector and the FET circuitry reset to their starting level, and the process is repeated.
The preamplifier output is coupled to a pulse processor which amplifies and shapes the signal into a form acceptable for conversion to a digital form by an analog-to-digital converter (ADC). Amplification is necessary to match the analog signal to the full-scale range of the ADC. This process involves the energy calibration of the spectrometer. Drift in the gain and/or offset (zero) of the amplification results in errors in the energy assigned to the x-ray photons producing the signal. Hence, these calibrations are to be as stable as possible, and calibration is to be routinely checked.
The energy calibration is important for qualitative identification of the elements and for precise quantitative results when using spectrum-fitting programs. The amplifier provides gain and zero controls for calibrations. Normal operation in x-ray spectrometry is to set the time on the system clock to be used to acquire the spectrum. The processing of the pulses is not instantaneous. At high count rates, the time needed can become significant. When a pulse is detected and processing initiated, the clock is ‘stopped’ until the system is ready to process a new photon. The length of time the clock is off is called dead time; the time the clock is on is called live time. Their total is real time. The system monitors live time. If the spectrometer is operated with a 50 % dead time, the real time is twice the live time.
Processing of the pulse created by a photon is to be complete before another pulse occurs. A pulse pile-up rejector circuit blocks a pulse if it is received too soon. Once activated, the pulse pile-up rejector prevents the new signal from being processed if a second x-ray enters the detector before a prior pulse is fully processed. If analysis of the prior pulse had not yet been complete, it is also to be blocked from further processing. If this blockage is not performed, pulse pile-up occurs, resulting in an artifact which appears at energies equal to the sum of the photon energy of the first and second photons to enter the detector. These are frequently called sum peaks.
Despite pulse pile-up rejection circuitry, sum peaks are observed for intense peaks in the spectrum. This is the result of two photons entering the detector simultaneously or within a time difference faster than the fast discriminator can act. Sum peaks can be observed at twice the energy of an intense peak and / or at the sum of the energies of two intense peaks in the spectrum. Sum peaks decrease rapidly in intensity with count rate. The importance of electronic pulse-processing components to system performance is easily overlooked in EDS. However, stability, linearity, and proper calibration of these components are important for the use of the spectrometer.
EDXRF spectrometers require a dedicated computer system for data acquisition. Early spectrometers were heavy, unwieldy units which used hard-wired multichannel analyzers which could acquire data, but could do little to process it. Current spectrometer and data systems based on microprocessor technology are available as table-top units.
Fundamentals of operation – The simultaneous multi-element capability of EDS complicates the selection of optimum conditions because of the factors to be considered for each element. The compromises in spectroscopy are to be made, but the initial selection of instrument operating conditions can follow a logical sequence of decisions.
Qualitative analysis needs similar procedures, normally with less stringent requirements. Once a sample is received for analysis and the elements to be determined by x-ray spectrometry are identified, the next decision is to ascertain which x-ray lines are to be used for the determinations. As a general rule, K lines are used upto a K absorption-edge energy a few keV below the characteristic line of the x-ray tube anode element. The continuum can be used for excitation if the voltage to the x-ray tube is set sufficiently high to place the continuum maximum at energy higher than the absorption edge and if a back-ground filter is used. In these cases, K absorption-edge energies can be used upto around 66 % of the maximum operating kV of the x-ray tube. However, the observed peaks lie on a continuum background and reduce the signal-to-noise ratio.
For a 50-kV x-ray tube, absorption edges as high as 30 keV can be used if the element is present in sufficient concentration. For a 30-kV rhodium or silver tube, one is restricted essentially to excitation by the characteristic tube lines. This is of no great concern unless there is a special interest in the elements between atomic numbers 41 and 50 (niobium to tin). Elements above atomic number 50 (40 for a 30-kV system) are normally to be determined using the L lines of their x-ray spectra.
To excite all L lines, the incident x-ray photon energy is to exceed the LI absorption edge. For practical use, the energy of the L lines is to be higher than around l keV. For the L line spectra, this needs atomic numbers higher than 30. At such low x-ray energies, absorption of the x-rays and low fluorescent yield in the L emission in this region needs high concentration of the element to be determined and excellent sample preparation. Overlap of the K lines of the low atomic number elements in this region also causes difficulty. For example, the K lines of phosphorus overlap with the L lines of zirconium and the M lines of iridium at around 2 keV. These problems are to be considered, but are to a large degree solved by careful use of processing software.
Once the x-ray spectral lines are selected for determination of the elements, the next step is to decide whether all analyte elements in the sample can be determined with one instrumental setting. Although the multi-element capability of EDS is useful, all elements in every sample cannot be determined with a single set of instrument parameters. Some applications need more than one condition, such as a mixture of low atomic number elements and transition elements. The transition elements are best determined by excitation using the K lines of rhodium or silver and the low atomic number elements with the L lines or a properly adjusted continuum using a background filter. Computer control of instrument parameters facilitates changing the conditions. Whether automatic or manual control is used, all samples are to be analyzed under one set of conditions, then analyzed again using the alternate set. This is preferred over changing conditions between samples.
X-ray tube operating voltage affects the efficiency of excitation of each element in the spectrum and the integrated x-ray photon flux from the tube. The tube current affects the flux only. Hence, once the operating kV has been set, the tube current typically is adjusted until the system is processing counts efficiently. System dead time is to be maintained below, but near, 50 %. The voltage and current settings for the x-ray tube have a sensitive effect on the rate of information acquisition and count distribution among the respective spectral peaks for a given type of sample.
Selection of primary tube filter thickness is important. If the filter is changed, the tube current, and sometimes the voltage, frequently needs resetting since the filter alters the intensity distribution of the x-rays striking the sample. When characteristic tube lines are used for excitation, the filter is normally made from the tube anode element. The intensity of the transmitted x-rays decrease exponentially with increasing filter thickness. It is common to have two or three primary filters made from the tube anode element in the filter holder. The selection is to reflect optimum count rate corresponding with reasonable current and voltage settings. Thicker filters attenuate lower energy radiation more effectively and reduce the excitation efficiency for the element with low absorption coefficients.
The remaining decision is the choice of atmosphere in the sample chamber. If x-rays below around 5 keV are to be implemented, use of a vacuum can be advantageous. Intensity can increase sufficiently to reduce significantly the counting time needed to achieve an adequate number of counts. If the concentration of elements yielding these x-rays is sufficiently high, the vacuum may not be needed. Because of the extra precautions needed in sample criteria and handling, a vacuum path is not to be used unless significant benefit is realized. Similar reasoning applies to the helium atmosphere.
These guidelines are useful for initial selection of operating conditions. The instrumental parameters are interactive, and a change in one parameter needs adjustment of another. For example, selection of a thicker primary filter or a decrease in the tube voltage needs an increase in the tube current.
Sample preparation
The care taken to determine the best method of sample preparation for a given material and careful adherence to that method frequently determine the quality of results obtained. Sample preparation is the single most important step in an analysis, yet it is frequently given the least attention. In most cases, the stability and overall reproducibility of x-ray instrumentation are the least significant factor affecting the precision of analytical measurements. Frequently, the precision of analytical results expected from x-ray spectrometric determinations is expressed in terms of the theoretical statistics of measurement of x-ray intensities.
When replicate samples are prepared and actual standard deviations measured, deviations are found to be larger than those predicted by counting statistics. If precision is poor, any one analytical result can also be poor, since it can differ substantially from the ‘true’ value. The variety of sample types which can be analyzed using x-ray spectrometry necessitates different sample preparation techniques.
Samples are frequently classified as infinitely thick or infinitely thin based on measurement of the attenuation of x-rays. Samples are considered to be infinitely thick if further increase in the thickness yields no increase in observed x-ray intensity. The critical value for infinite thickness depends on the energy of the emitted x-radiation and the mass absorption coefficient of the sample matrix for those x-rays. For pure iron, the critical thickness is around 40 m for iron x-rays.
Although infinitely thin samples afford several advantages, it is rarely feasible to prepare them from routine samples. Many samples fall between these two cases and need extreme care in preparation. In addition to preparation of the sample, precise positioning of the sample in the spectrometer is critical for quantitative determinations.
Solid samples – These are defined as single bulk materials, as opposed to powders, filings, or turnings. Solid samples can frequently be machined to the shape and dimensions of the sample holder. The processing is not to contaminate the sample surface to be used for analysis. In other cases, small parts and pieces are to be analyzed as received. The reproducible positioning of these samples in the spectrometer is critical. It is frequently useful to fashion a wax mould of the part which fits into the sample holder. Using the mould as a positioning aid, other identical samples can be reproducibly placed in the spectrometer.
Samples taken from unfinished bulk material frequently needs surface preparation prior to quantitative analysis. Surface finishing can be done using a polishing wheel, steel wool, or belt grinder, with subsequent polishing using increasingly fine abrasives. Surface roughness less than 100 micrometers is normally sufficient for x-ray energies above around 5 keV, but surface roughness of less than 20 micrometers to 40 micrometers is needed for energies down to around 2 keV. Several precautions are necessary. Alloys of soft metals can smear on the surface as the sample is polished, resulting in a surface coating of the soft metal which yields high x-ray intensities for that element and subsequently high analytical results.
Polishing grooves on the surface of the sample can seriously affect the measured intensity of low-energy x-rays. This can be examined by repetitive measurement of the intensity of a sample after 45 degrees or 90 degrees rotation. Use of a sample spinner reduces this effect. If a sample spinner is not available, the sample is to be placed in the spectrometer such that the incident x-radiation is parallel to the polishing direction.
Powders and briquettes – Powder samples can be received as powders or prepared from pulverized bulk material too inhomogeneous for direct analysis. Typical bulk samples pulverized before analysis are ores, and refractory materials. Powders can be analyzed using the spectrometer, pressed into pellets or briquettes, or fused with a flux, such as lithium tetra borate. The fused product can be reground and pressed or cast as a disk. For precise quantitative determinations, loose powders are rarely acceptable, especially when low-energy x-rays are used. Pressed briquettes are more reliable. However, experience indicates that the best compromise is reground and pressed fusion products. This technique eliminates several problems associated with particle-size effects.
Particle-size effects result from the absorption of the incident and emitted x-rays within an individual particle. If the mass absorption coefficient of the sample matrix is high for the x-radiation used, particles even a few microns in diameter can considerably affect attenuation of the radiation within each particle. If the sample consists of particles of various sizes, or the particle size varies between samples, the resulting x-ray intensities can be difficult to interpret. This problem is compounded by the tendency of a material composed of a mixture of particle sizes to segregate when packed.
Determination of elements using low-energy x-radiation can lead to errors from particle-size effects of as much as 50 %. If the needed speed of analysis prohibits use of fusion techniques, direct determination from packed powders can be considered. The sample is to be ground, if possible, to a particle size below the critical value. The grinding time needed frequently can be ascertained by measuring the intensity from a reference sample at increasing grinding times until no further increase is observed. The lowest energy x-ray to be used in analysis is to be selected for this test.
Briquettes or pressed powders yield better precision than packed powder samples and are relatively simple and economical to prepare. In several cases, only a hydraulic press and a suitable die are needed. In the simplest case, the die diameter is to be the same as the sample holder so that the pressed briquettes fit directly into the holder. The amount of pressure needed to press a briquette which yields maximum intensity depends on the sample matrix, the energy of the x-ray to be used, and the initial particle size of the sample. Hence, prior grinding of the sample to a particle size which is less than 100 micrometers is advisable.
A series of briquettes are to be prepared from a homogeneous powder using increasing pressure. The measured intensity of the x-ray lines to be used in the analysis is plotted versus the briquetting pressure. The measured intensity is to approach a fixed value, perhaps asymptotically. Pressures of 138 MPa to 276 MPa may be needed. For materials which do not cohere to form stable briquettes, a binding agent is needed. Acceptable binding agents include powdered cellulose, detergent powders, starch, stearic acid, boric acid, lithium carbonate, polyvinyl alcohol, and commercial binders.
Briquettes which are not mechanically stable can be improved by pressing them into backing of pre-pressed binder, such as boric acid, or by the use of a die which presses a cup from a binding agent. The sample powder can then be pressed into a briquette supported by the cup. Improved results are frequently achieved if around 0.1 mm to 0.5 mm is removed from the surface of the briquette prior to the measurement.
Fusion of materials – Fusion of materials with a flux can be performed for several reasons. Some refractory materials cannot be dissolved, ground into fine powders, or converted into a suitable homogeneous form for x-ray spectrometric analysis. Other samples can have compositions which lead to severe inter-element effects, and dilution in the flux reduces these. The fused product, cast into a glass button, provides a stable, homogeneous sample well suited for x-ray measurements. The disadvantages of fusion techniques are the time and material costs involved as well as the dilution of the elements which can result in a reduction in x-ray intensity. However, when other methods of sample preparation fail, fusion frequently provides the needed results.
Low-temperature fusions can be carried out using potassium pyro-sulphate. More common are the glass-forming fusions with lithium borate, lithium tetra-borate, or sodium tetra-borate. Flux-to-sample ratios range from 1:1 to 10:1. The lithium fluxes have lower mass absorption coefficients and hence less effect on the intensity of the low-energy x-rays. An immense variety of flux-additive recipes are reported for various sample types. Lithium carbonate can be added to render acidic samples more soluble in the flux. Lithium fluoride has the same effect on basic samples. Lithium carbonate also reduces the fusion temperature. Oxidants, such as sodium nitrate and potassium chlorate, can be added to sulphides and other mixtures to prevent loss of these elements.
Filters and ion-exchange resins – Various filters, ion-exchange resin beads, and ion-exchange resin-impregnated filter papers have become important sampling substrates for samples for x-ray spectrometric analysis. Filter materials can be composed of filter paper, membrane filters, glass fiber filters, and so on. Filters are used in a variety of applications. One widely used application is in the collection of aerosol samples from the atmosphere. Loadings of several milligrams of sample on the filter can correspond to sampling several hundred cubic meters of atmosphere. Such sampling can be performed in any environment. Many elements can be determined directly on these filters by x-ray spectrometric analysis. Particulate samples collected in this way present problems, stemming primarily from particle-size effects, which are reduced in part by the need to collect two particle-size regions using dichotomous samplers. With these units, particles are separated into those smaller and those larger than around 2 micrometers in diameter.
The smaller particles tend to represent man-made materials; the larger ones are of natural origin. The smaller particles show fewer particle-size effects, and an x-ray spectrometric determination of even low atomic number elements, such as sulphur, is possible. Glass fiber filters are frequently used for this purpose. Filters can also be used for non-aerosol atmospheric components, such as reactive gases. Filter materials can be impregnated with a reagent reactive to the gas which traps it chemically. Sampling is accomplished by conveying atmospheric gases through a treated filter under carefully controlled conditions. An example is a damp filter treated with ferric ion solution used to trap hydrogen sulphide. The excess iron can be rinsed from the filter, but the precipitated ferrous sulphide remains. The sulphur can be determined directly or indirectly by measuring the iron x-radiation. The key to determining atmospheric components is the development of suitable standards.
Filters can be used to determine solution components in ways parallel to those described for atmospheric components. Particulate materials can be filtered directly from solution. For example, particulate materials in environmental water samples are defined as that which is filtered using a 0.45 micrometer pore diameter membrane filter. Hence, filtration of particles from water can be accomplished using such filters, and direct x-ray spectrometric analysis performed. Application of filter sampling to dissolved elements in water is becoming more common. The principle is similar to the reactive reagent-impregnated filter application to atmospheric gases. In some cases, the filter can be impregnated with ion-exchange resins which trap ions as the solution passes through the filter.
Procedures using ion-exchange resin-impregnated filters are to be carefully checked, since several passes of the solution can be needed, and distribution of the ions across the paper thickness is seldom uniform. However, for solutions, a reaction can be performed prior to filtration. For example, many ions can be precipitated quantitatively from aqueous solution, even at parts per billion concentration levels. The precipitates can be collected using 0.45 micrometers pore diameter membrane filters, which are then mounted between two Mylar sheets retained by ring clips on a standard plastic sample cup. Simultaneous multi-element determinations are then performed using XRF spectrometer.
Detection limits on the filters of as low as a few tenths of a microgram are common. If 100 g of sample solution is used, this corresponds to the detection limits of a few parts per billion in the sample. Standards are easily prepared as aqueous solutions. ‘Standard reference materials’ (SRM) for environmental waters and industrial effluent water are available.
Thin-film samples – Thin-film samples are ideal for x-ray spectrometric analysis. The x-ray intensity of an infinitely thin sample is proportional to the mass of the element on the film, and the spectral intensities are free of inter-element and mass absorption coefficient effects. However, in practice, perfect thin-film samples are rarely encountered. Powder samples of sufficiently small and homogeneous particle size can be distributed on an adhesive surface, such as cellophane tape, or placed between two drum-tight layers of Mylar film mounted on a sample cup.
More important thin-film types are platings and coatings on various substrates. Analysis of these sample types is increasingly important for the electronics industry. Of particular concern are measurements of film thickness and composition. Several techniques can be used, including the substrate intensity attenuation method, the coating intensity method, various intensity ratio methods, and the variable takeoff angle method. The last method is not practical in most commercial spectrometers. To be infinitely thin to most x-rays used in x-ray spectrometric analyses, the samples are to be 10 micrometers to 200 micrometers thick.
Liquids – Liquids can also be analyzed using x-ray spectrometry. The design of x-ray spectrometric instrumentation using inverted optics, in which the sample is above the x-ray source and detector, facilitates the use of liquid samples. This convenient geometry demands caution in the preparation of liquid samples to avoid damaging the source or detector by such accidents as spills and leaking sample cups.
Quantitative standards are easily prepared for liquid samples. However, since solvents are normally composed of low atomic number elements, the Rayleigh and Compton scatter intensity is high, which increases background and leads to high limits of detection. These problems can be minimized by use of suitable primary tube filters, which reduce the scattered x-radiation in the analytically useful region.
Care is to be taken with liquids containing suspended solids. If the suspension settles during the measurement time, the x-ray intensity of the contents of the sediment is enhanced. The x-ray intensity from solution components or homogeneous suspension can decrease as a result of sediment absorption, which leads to erroneous results. This possibility is tested by brief, repetitive measurements, beginning immediately after a sample is prepared. Any observed increase or decrease in intensity with time indicates segregation in the sample. In these cases, an additive which stabilizes the suspension can be used, or the suspended content can be collected on a filter for analysis.
Special sample types – Applications of x-ray spectrometric analysis do not always provide convenient samples which can fit one of the above categories. Non-destructive analyses are occasionally needed on production products which are not 32 mm diameter circles of infinite thickness. Examples include computer disks, machined parts, and long, coated strips or wire. In these cases, a sample compartment which accommodates the samples can frequently be designed. With the development of the mercuric iodide detector, which can provide adequate resolution for many analyses without a liquid nitrogen dewar, special analytical systems for on-line and non-destructive analysis of large samples can become increasingly feasible.
제조공정
이 문서는 스피커 품질 문제를 해결하기 위한 문제 해결 절차를 제공합니다. 소음, 낮은 볼륨, 소리가 나지 않는 등 스피커 제조 시 일반적인 증상을 분석했습니다. 증상 1:소음 다음은 원인을 분석하고 정확히 찾아내기 위해 정보를 캡처하는 노이즈 유형 및 방법을 제공합니다. 소음을 차단하고 예방 조치를 취합니다. . 1.1 폴 피스 문제 이유: 폴 피스 기둥이 녹슬거나 변위됨 예방 조치: 안함 도금층이 벗겨지거나 도금되지 않은 폴피스 또는 녹슨 폴피스를 사용하십시오. 폴 피스 열에 느슨함 확인 , 버 등 1.2
현재 패션 및 의류 소매업에서 RFID 채택의 거대한 물결이 일어나고 있습니다. 이러한 성장은 주로 정확한 재고 데이터의 필요성에 기반한 반면 RFID 배포 비용은 크게 감소했습니다. 이 도움말에서는 몇 가지 비용 지침을 제공합니다. 개선점 지적 미래 산업의 비용. 1. 태그 수동 태그 일반적으로 범위 20센트부터 가장 간단한 번호판 태그의 경우 몇 달러 열, 추위 또는 화학 물질로부터 태그를 보호하기 위해 열쇠 고리 또는 플라스틱 하우징에 내장된 응답기용. 그러나 일반 수동 RFID 태그는 금속 물체에서 제대로 작동하지