

나노물질

산업 제조
고감도 비접촉 모드 온도 감지는 기본적인 화학 반응, 생물학적 프로세스 및 의료 진단 응용 분야를 연구하는 데 중요합니다. 나노 스케일 기반 온도계는 세포 이하 분해능으로 민감하고 정확한 온도 감지를 위한 비침습적 프로브를 보장합니다. 형광 기반 온도 센서는 "비접촉" 모드로 작동하고 세포 이미징 및 분자 수준에서 온도 감지의 이중 기능을 제공하기 때문에 큰 용량을 보여주었습니다. 나노물질과 나노기술의 발전은 나노온도계(나노스케일에서 높은 공간 분해능을 갖는 새로운 온도 감지 물질)와 같은 새로운 센서의 개발로 이어졌습니다. 이러한 나노 온도계는 형광 단백질, 유기 화합물, 금속 나노 입자, 희토류 도핑 나노 입자 및 반도체 양자점과 같은 다양한 플랫폼을 사용하여 개발되었습니다. 탄소점(CD)은 강한 형광성, 내광표백성, 화학적 안정성, 저렴한 전구체, 낮은 독성 및 생체 적합성과 같은 뛰어난 특성으로 인해 많은 연구 분야에서 관심을 끌고 있습니다. 최근 보고서에서는 다른 나노물질 기반 온도계의 대안이 되는 일부 CD의 열 감지 동작을 보여주었습니다. 이러한 종류의 발광 기반 온도계는 생물학적 프로세스에 대한 더 나은 이해를 파악하기 위한 나노 공동 온도 감지 및 열 매핑에 유망합니다. CD가 열 감지를 위한 나노 스케일 기반 재료로서 아직 초기 단계에 있기 때문에 이 리뷰에서 우리는 이 새로운 나노 온도계, 열 감도 및 분해능을 향상시키기 위한 기능화 방법, 열 감지 동작의 메커니즘에 대한 포괄적인 이해를 제공합니다.
온도는 생물학적 및 화학적 시스템에 현저한 영향을 미치는 기본적인 열역학적 변수입니다. 자연 과학, 공학, 농업 및 의학 과학의 거의 모든 분야에서 광범위한 적용으로 인해 정확한 온도 측정은 매우 중요합니다[1, 2]. 의료 응용 분야에서 체온 측정은 뇌졸중, 암 또는 염증과 같은 다양한 질병의 조기 발견에 사용되며, 초기 증상 중 하나는 국소 온도 특성의 출현입니다.
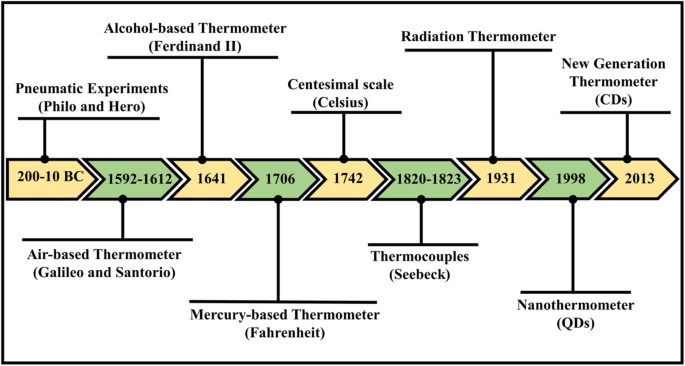
역사상 가장 초기의 온도 추정은 감각이나 관찰에 기반을 두었습니다. 기원전 200-10년의 고대에 공기압 실험(열에 의한 공기 팽창)은 열의 정량적 측정에 사용된 장치에 대한 가장 오래된 알려진 참고 자료로 지정됩니다. 열팽창 공기와 관련된 가장 원시적인 저작 중에서 비잔티움의 필로(Philo)와 알렉산드리아의 헤론(Hero)이 공압 실험에 관해 저술한 것으로 인정됩니다[3]. 나중에 1592년에서 1603년 사이에 갈릴레오 갈릴레이는 물기둥 위에 갇힌 공기를 포함하는 튜브를 사용하여 간단한 장치를 구축하여 열에 의한 공기 팽창에 대한 실험을 설정하여 온도계를 발명했습니다. 갈릴레오에 이어 이탈리아 산토리오는 이 간단한 기구를 발열의 건강 검진에 통합한 것으로 처음으로 인증을 받았습니다. 최초의 완전히 밀봉된 유리 속 액체 온도계, 알코올로 채워진 유리관은 1641년 Ferdinand II에 의해 조립되었습니다. 그는 Galileo와 Santorio의 개방형 온도계와 달리 기압의 도움 없이 온도를 측정할 수 있었습니다. 화씨의 온도 측정에 대한 실제 작업은 1706년에 나타났습니다. 그는 알코올로 시작했지만 이후 그의 수은 체온계로 전설이 되었습니다. 1742년에 물이 끓는 온도에서는 0이 되고 물이 얼는 온도에서는 100이 되는 눈금을 예측한 Anders Celsius는 100분의 1 온도 눈금에 대한 인정을 받았습니다. Thomas Johann Seebeck이 열전기 개념을 고려한 19세기에 전자 실험이 수행되었습니다. 1820년과 1823년 사이에 수행된 일련의 실험에서 그는 접합부 사이에 열차가 있을 때 두 개의 서로 다른 금속의 접합점에서 전위를 확인했습니다. 이것은 나중에 Seebeck 효과로 알려졌으며 가장 정확한 온도 측정으로 간주되는 열전대의 기원이 됩니다[3,4,5,6,7]. 온도계의 개략적인 타임라인은 그림 1에 나와 있습니다.
온도계의 발전을 위한 타임라인 계획
기존 온도계는 다음과 같이 분류할 수 있습니다.
재료의 열팽창을 기반으로 한 액체 충전 유리 온도계
Seebeck 효과 기반 열전대
광학 센서 [8]
또한 접촉식 또는 비접촉식 온도계로 분류할 수 있습니다. 기존의 액체 충전 유리, 열전대, 서미스터 및 저항 온도 감지기(RTD)를 포함한 접촉 모드는 모두 전기 배선과 온도계와 기판 사이의 직접적인 접촉을 필요로 합니다. 이 모드는 전자기 노이즈가 강하거나 스파크가 위험할 수 있거나 환경이 파괴적이거나 부품이 빠르게 움직이는 애플리케이션에는 적합하지 않습니다. 게다가, 기존의 온도계는 예를 들어 세포 내 온도 변화 및 미세 회로 및 미세 유체의 온도 매핑과 같이 공간 분해능이 서브 마이크론 규모로 낮아지면 측정할 수 없습니다[9]. 같은 방식으로 엔지니어링 응용 프로그램은 축소된 지역과 어려운 환경에 대한 고급 감열 전략을 필요로 합니다[10]. 따라서 나노 규모 영역의 경우 다른 접근 방식과 재료에 대해 생각해야 합니다.
새로운 비접촉 온도계는 앞서 언급한 문제를 극복할 수 있습니다. 예를 들어, 광학 온도 센서(분자 온도계)는 방출된 빛의 측정을 사용하여 온도를 추출하는 분자 클래스로 구성된 보다 최근 세대의 분석 도구입니다[11, 12]. 형광 온도에 민감한 프로브는 나노 시스템 응용 분야에서 온도 측정을 위한 유망한 영역을 제공합니다. 온도 정보는 형광 강도, 밴드 모양, Stokes 이동 또는 붕괴 수명을 기반으로 추출할 수 있으며 적절하게 보정된 경우 온도와 관련될 수 있습니다[13, 14].
분자체온계는 일반 세포보다 다양한 생리학적 온도를 갖는 병이 있거나 발암성 세포를 진단하는 데 큰 잠재력을 가지고 있습니다. 의료 응용 분야에서 가능성은 유전자 발현[15] 및 세포 대사[16]의 온도 유도 제어에서 질병의 세포 선택적 침투 및 치료[17] 및 통합 열원의 열 발산 개선[18]에 이르기까지 다양합니다. . 최근에는 반도체[19], 고분자[10], 금속성 나노입자[20]와 같은 나노물질이 서브마이크론의 열분해능을 나타내는 열센서(나노온도계)로 사용되고 있다.
다양한 온도에 걸쳐 하위 온도를 해결할 수 있는 온도계는 살아있는 시스템에 통합될 수 있으며 생물학적, 물리적 및 화학적 연구의 수많은 영역에서 영향력 있는 새로운 도구를 제공할 수 있습니다. 따라서 이 리뷰에서는 탄소나노물질(탄소재료)을 기반으로 하는 나노온도계의 "신세대" 또는 "신세대"에 초점을 맞춥니다. 우리가 아는 한, 나노 온도계로서의 탄소 점에 대한 리뷰 기사는 보고되지 않았습니다. 최근 탄소점(탄소 양자점, 그래핀 양자점)은 고유한 특성과 함께 민감한 열적 특성을 나타내어 나노 스케일 영역에서 온도 측정 거동에 탁월한 후보가 되었습니다. 여기에서는 탄소 도트의 열 감지 동작의 정의, 장점 및 메커니즘을 검토합니다. 마지막으로 이 새로운 종류의 열 재료에 대한 미래 전망이 제시됩니다.
"나노 온도 측정"이 의미하는 것은 나노 또는 마이크로 영역의 국부적 환경에 대한 온도 정보를 제공하기 위해 나노 크기의 감열 물질을 사용하는 것입니다[21, 22]. 나노 입자 기반 열 프로브는 광범위한 감지 응용 분야에서 큰 용량을 가지고 있으며 최근에 수많은 진보적 인 소위 "나노 온도계"가보고되었습니다. 또한, 폴리머[23, 24], 나노결정[25], 희토류가 도핑된 나노입자[26, 27], 금속 나노입자[28]와 같은 다양한 종류의 기존 나노물질이 열에 민감한 발광 특성을 갖는 것으로 보고되었습니다.
따라서, 나노 온도 센서는 고감도 분해능으로 나노 스케일에서 작동하는 비침습적, 비접촉 모드, 정확한 온도계입니다[9]. 나노 물질을 활용한 열 감지는 광학 특성을 조작하여 달성할 수 있습니다. 형광 나노 온도계는 신호의 강도, 밴드의 모양, 형광 수명, 밴드 이동, 여기 파장의 편광 및 스펙트럼 이동을 포함하는 열 측정이 파생되는 정확한 매개변수에 따라 상당히 많은 클래스로 분류될 수 있습니다. 첫 번째 경우 형광은 온도에 따라 변하며 신호의 절대적인 증가(또는 감소)로 감지될 수 있습니다[9, 29,30,31].
온도 의존적 방출을 갖는 발광 나노물질을 사용하는 비접촉 발광 나노온도측정법은 주로 생물학적 응용에 적합합니다[32, 33]. 이러한 발광성 나노물질에는 생리학적 범위에서 열에 민감한 특성을 갖는 형광 고분자[24], 금속성 나노입자[34], 희토류 도핑된 나노입자[35], 나노다이아몬드[36]가 포함됩니다. 이러한 선구적인 연구는 개별 세포의 평균 온도를 제공할 수 있었습니다. 유기 염료(예:Rhodamine 6G) 및 폴리머(예:poly(N) 기반 온도 의존 발광 프로브 -이소프로필 아크릴아미드))는 일반적으로 광안정성이 낮고 산소에 대한 교차 감도가 뚜렷하여 살아있는 세포 작업에 바람직하지 않습니다[8]. 또한, 형광단의 수명에 대한 강한 pH 의존성이 있어 조사되는 환경의 pH를 정밀하게 제어하지 않고는 사용하기 어렵습니다[37].
CdSe, ZnS, InP 또는 PbSe와 같은 가장 두드러진 후보와 함께 순수 및 도핑된 반도체 나노결정을 기반으로 하는 또 다른 종류의 나노온도계가 보고되었습니다[19, 38,39,40]. 반도체 양자점(SQD)은 높은 양자 수율, 광표백 전의 긴 수명, 적절한 표면 개질 후 적절한 생체 적합성을 고려하여 나노 스케일 온도계의 후보입니다. 또한 감지 및 영상화를 위해 단백질 및 DNA에 쉽게 접합될 수 있습니다[41]. 이러한 유형의 발광 온도계가 직면한 예외적인 문제는 T에서 밝기, 광안정성, 감도 및 정밀도에 대한 관련 인식입니다. =세포 내 미세 환경을 조사할 때 20–40 °C. SQD는 합성, 물리화학적 특성, 발광 및 잠재적 응용 측면에서 광범위하게 검토되었습니다. 여기에서 우리는 이러한 수많은 놀라운 리뷰에 독자의 주의를 집중시킵니다[42,43,44,45,46]. 유기 염료와 비교하여 SQD는 검출을 위한 우수한 밝기, 다중화를 위한 더 넓은 여기 프로파일 및 장기 연구를 위한 더 나은 광안정성을 나타냅니다. 더욱이, 온도 센서로서의 SQD는 pH 및 세포 내부에서 만연할 것으로 예상되는 기타 환경 변화에 내성이 있습니다[47].
일반적으로 SQD에서 서로 다른 프로세스의 조합으로 인해 온도가 증가하면 형광 강도가 감소하고(소광) 스펙트럼 이동이 동반됩니다. 이 이동은 생물물리학적 범위에서 선형이라고 가정할 수 있습니다. 두 효과(발광 소광 및 스펙트럼 이동)의 크기는 양자점을 구성하는 물질과 그 크기에 크게 의존합니다[48].
발광 나노물질의 각 그룹은 장점과 함께 사용에 한계가 있습니다. 위에서 설명한 바와 같이 SQD는 형광성 고분자 및 유기 염료보다 선호됩니다. SQD는 광안정성, 양자 효율 및 조정 가능한 형광 면에서 우수하지만 QD는 고유 깜박임으로 인해 장기 모니터링을 위해 단일 분자를 추적하는 데 사용할 수 없습니다[49]. 또한 QD의 주요 함정은 카드뮴과 같은 금속을 포함한 중금속 함량으로 인한 독성입니다. 이것은 생물학적 및 환경적 적용을 제한합니다. 게다가, 자연에서 전구체 원소의 이용 가능성은 상대적으로 낮기 때문에 SQD는 고가로 간주됩니다[50].
비탄소 기반 나노 온도계에서 발생하는 문제를 극복하기 위해(이전 섹션에서 설명한 대로) 탄소 기반 나노 물질이 준비되었으며 낮은 독성, 손쉬운 준비, 저렴한 전구체, 광안정성과 같은 고유한 특성을 나타냈습니다. , 생체 적합성. 이러한 탄소 기반 나노 물질은 민감한 열 감지 특성을 나타냅니다. 또한 금속이 없는 나노입자의 개선은 이러한 독성 물질의 생물학적 응용에 대한 환경적 위험 때문에 중요하고 시급합니다[51, 52]. 탄소 기반 나노물질 중 형광성 나노다이아몬드가 나노온도계로 처음 보고되었다[53]. 형광 나노다이아몬드는 화학적으로 견고하고 불활성인 표면으로 인해 고유한 생체적합성을 가지고 있습니다[54]. 다른 나노다이아몬드는 최근에 서브도 정확도로 세포내 열 감지에 사용되었습니다[55, 56]. 이러한 나노다이아몬드의 열 민감도는 격자 탄소 원자를 대체하는 질소 원자와 근처의 빈 격자 사이트로 구성된 점 결함인 소위 질소-공백 색상 중심을 기반으로 합니다[48, 57]. 형광성 나노다이아몬드의 질소-공백 중심은 광범위하게 연구되었으며 생물학적 응용 분야에서의 사용뿐만 아니라 광물리학에 대해 잘 특성화되어 있습니다[58]. 질소 결손 기반 온도 측정의 기능 원리는 높은 공간 분해능으로 광학적으로 감지할 수 있는 이 색 중심의 정확한 측정에 달려 있습니다[30, 59]. 그러나 낮은 형광 효율과 열악한 제어성은 형광 나노다이아몬드의 적용을 크게 방해합니다[36].
새로운 종류의 탄소 기반 나노 물질 제품군 중 하나는 매우 밝은 광발광, 광화학적 안정성, 수용성, 우수한 생체 적합성 및 무독성을 갖는 고발광 탄소점(CD)입니다[60,61,62]. CD는 직경이 10nm 미만인 0차원 및 구형 나노입자입니다[63, 64]. 다양한 유형의 CD를 준비하기 위해 다양한 접근 방식이 적용되었습니다. 예를 들어 레이저 제거[65], 용매열[66], 열수 합성[67], 마이크로파 보조[68], 아크 방전[69], 산성 산화[70], 그리고 더 많은 화학적, 물리적 접근 [71, 72]. 또한 CD는 생물학적 이미징[73], 화학적 및 바이오센싱[74,75,76,77], 표적 약물 전달[78], 제약 분석[79] 및 촉매 작용[80, 81]. 탄소점은 합성, 물리화학적 특성 및 잠재적 응용 측면에서 광범위하게 검토되었습니다. 여기에서 우리는 독자들에게 탄소 점에 대한 수많은 좋은 리뷰를 언급합니다[72, 82,83,84,85,86,87,88].
최근 몇 년 동안 온도 센서로서 형광 CD가 연구자들의 많은 관심을 받고 있습니다. 원칙적으로 탄소 나노도트가 관련 온도 범위에 걸쳐 광발광에서 상당한 변화를 나타내야 하는 것과 같이 효과적인 온도 측정을 위해서는 몇 가지 요구 사항이 필요합니다[89]. 광안정성, pH 안정성 및 저장 수명은 실제 적용을 위해 고려해야 하는 기타 요구 사항입니다.
CD는 기존 반도체 양자점(SQD)의 유망한 대안입니다. QD와 비교하여 CD는 저렴한 비용, 낮은 독성 및 고유한 강력한 광학/화학적 특성과 같은 많은 뛰어난 이점을 보여줍니다. [90] 또한 CD는 광표백이 매우 적습니다. 다른 형광성 원료와 비교하여 CD는 자연에 풍부한 저렴한 탄소원에서 생산됩니다[91]. 또한 CD의 표면 상태를 수정하고 기능화하는 몇 가지 간단한 방법이 있어 실험 요구 사항에 따라 CD의 용해도, 안정성, 물리화학적 특성 및 양자 수율을 조정할 수 있습니다[49, 92, 93].
문헌에서 온도 의존적 형광을 갖는 탄소 점에 대해 보고된 기사가 거의 없으며 표 1에 나와 있습니다.
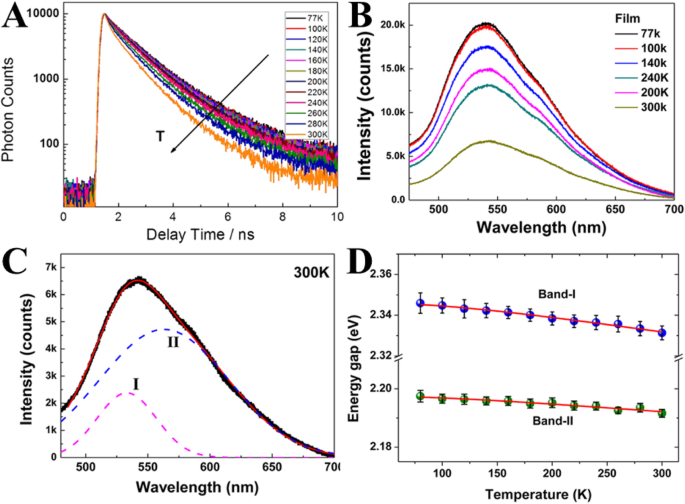
Yu et al. [51] 2012년 탄소 나노도트에서 온도 의존적 형광을 최초로 조사하고 반도체 및 금속 기반 나노 입자와 비교했습니다. 그들은 시간 상관 단일 광자 계수 기술(TCSPC)을 통한 온도 의존적 광발광 수명 측정에 의존했습니다. 광발광 이완 역학은 더 높은 온도에서 더 빨라지며(그림 2a), 이는 비방사성 붕괴 과정에 기인할 수 있습니다. 극저온에서 실온까지의 온도에 따른 CD 필름의 형광 스펙트럼 측정이 수행되었습니다(그림 2b). 온도가 증가하면 형광 강도가 반복적으로 감소합니다.
아 온도의 함수로서의 시간 분해 광발광 측정. ㄴ 온도에 따른 CD 필름의 형광 스펙트럼. c 2-가우스 함수로 피팅된 300K의 형광 스펙트럼. d 온도의 함수로서 형광의 대역폭. (참조 [51]의 허가를 받아 복제)
PL 스펙트럼은 비대칭 피크를 나타내므로 각 온도에서 PL 스펙트럼은 그림 2c에 표시된 2-가우스 함수에 의해 잘 맞을 수 있습니다. 고에너지 밴드, 밴드 I; 낮은 에너지 밴드, 밴드 II(그림 2d).
또한, 형광의 에너지 갭(대역폭)은 온도의 함수로 조사되었습니다(그림 2d). 총 대역폭은 온도 비의존성(전자-전자 산란) 및 온도 종속성(전자-포논 및 표면/결함 산란)으로 나타납니다. 밴드 I 및 밴드 II의 대역폭은 온도와 무관하며, 이는 전자-전자 산란이 CD에서 지배적임을 지정합니다.
따라서 CD의 약한 온도 효과는 주요 상호 작용 메커니즘이 전자-포논 커플링보다 전자-전자 상호 작용을 포함한다는 사실과 일치합니다. 또한 매우 낮은 온도(77K)에서도 일반적으로 관찰되는 넓은 PL 밴드(> 100nm)를 강한 전자-전자 상호작용이라고 합니다(그림 2c). 이 결과는 금속 나노클러스터와 유사하고 반도체 양자점과는 다릅니다. 따라서 Yu와 동료들은 CD의 π-전자가 금속 나노클러스터의 자유 전자와 유사하게 작용할 수 있다고 추측했습니다.
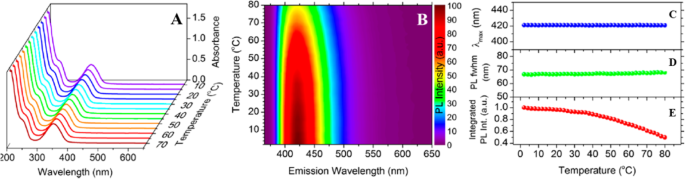
Kalytchuk et al. [89] 시트르산과 l-시스테인의 1단계 열수 처리에 의해 고발광성 수용성 N,S-CD를 합성했습니다. 그들은 CD의 온도 의존성 PL 특성을 특성화하기 위해 광범위한 온도에서 정상 상태 흡수 스펙트럼을 수집했습니다. 10~70°C(단계당 5°C씩 증가) 온도에서 물에 분산된 N, S-CD의 흡수 스펙트럼은 그림 3a에 나와 있습니다. 반도체 나노결정과 달리 흡수대역의 위치와 강도는 온도에 따라 변하지 않았다. 유사한 결과가 이전에 글루타티온이 있는 상태에서 포도당의 열수 처리에 의해 합성된 CD에 대해 보고되었습니다[1].
아 10 ~ 70 °C의 온도 범위에서 온도 의존적 흡수. ㄴ 2°C에서 80°C 사이의 온도에서 온도 종속적 PL 방출의 정규화된 색상 플롯과 2°C의 단계 크기 및 355nm에서의 여기. PL 피크 최대값 λmax(c ), PL fwhm(d ) 및 통합 PL 강도(e ). (참조 [89]에서 재생산)
그들의 작업에서 그들은 2 ~ 80 ° C의 온도 범위에서 2 ° C의 단계로 얻은 N, S-CD의 PL 스펙트럼의 색상 플롯을 보여주었습니다 (그림 3b). 온도를 높이면 PL 방출의 감지 가능한 이동 없이 PL 방출 강도가 약 2배 감소했습니다[89]. PL 방출 최대값의 위치, 반값의 PL 전체 폭(fwhm) 및 통합 PL 강도는 연구 온도에서 정량적으로 결정되어 각각 결과를 그림 3c-e에 요약합니다.
N, S-CD의 PL 피크 위치는 밴드갭이 온도에 따라 변화하여 PL 방출 이동을 유도하는 대부분의 반도체 나노결정과 달리 약한 온도 의존성을 보입니다. 또한, PL fwhm은 동일한 온도 범위(그림 3d)에서 미미한 확장(1.4 ± 1 nm)만 나타내어 N, S-CD의 PL 피크가 무시할 수 있는 열 확장을 나타냄을 나타냅니다. CD에서 발생하는 비방사 이완 과정을 특성화하기 위해 온도의 함수로서 통합된 PL 강도의 담금질을 분석했습니다. N, S-CD에 대한 온도 종속 통합 PL 강도의 플롯이 그림 3e에 나와 있으며, 값은 2°C의 강도로 정규화되어 강도가 연구된 온도 범위에서 단조롭게 감소함을 보여줍니다. 80 °C는 2 °C의 약 절반입니다. 이러한 결과에 기초하여, 2 ~ 80°C 온도에서 CD에 대한 열적 담금질의 활성화 에너지는 Yu가 보고한 값에 가까운 N, S-CD에 대한 Arrhenius 공식을 사용하여 17.0 ± 0.7 meV로 추정되었습니다. et al. [51].
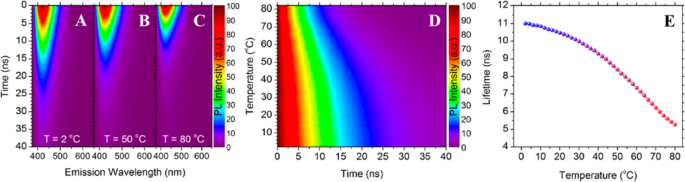
게다가 Kalytchuk et al. [89] 다른 온도에서 CD의 방출 역학을 조사했습니다. 그림 4a–c는 시간 분해 PL 방출의 강한 온도 의존성을 나타내며, 세 가지 다른 온도에 대한 시간 분해 방출 분광법 데이터를 보여줍니다. CD의 일시적인 PL 방출 맵은 그림 4a-c와 같이 2, 50 및 80 ° C에서 375와 650 nm 사이의 스펙트럼 영역에서 획득되었습니다. 온도가 증가함에 따라 PL 감쇠가 분명히 감소하여 CD가 PL 수명 기반 온도 감지에 만족스러운 특성을 가지고 있음을 시사합니다. 모든 연구 온도에서 점의 방출 프로파일에 걸쳐 스펙트럼적으로 균일한 단일 지수 감쇠가 관찰되었으며, 이는 전체 CD 앙상블에서 매우 유사하고 높은 방출 채널을 통해 재조합이 발생함을 나타냅니다. CD의 PL 역학은 틀림없이 온도 감지 응용 분야와 관련하여 가장 유망한 품질입니다. 특히 CD의 온도 감도는 PL 수명 나노 온도계를 만듭니다.
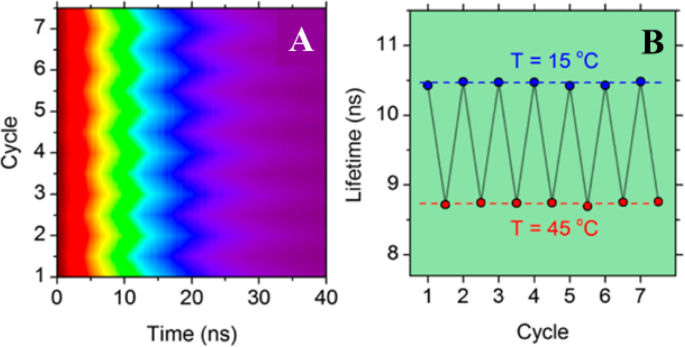
CD의 시간 분해 온도 종속 PL 방출. a에서 CD에 대한 시간 분해 PL 방출 맵을 보여주는 정규화된 컬러 플롯 2 °C, b 50 °C, c 80 °C d 2~80°C 사이의 온도에서 PL 방출 최대값(λem =421nm)에서 시간 분해 PL 강도의 정규화된 색상 플롯. 이 추출된 PL 수명은 2–80°C 범위에서 온도의 함수로 표시됩니다. (참조 [89]에서 재생산)
2~80°C 사이의 온도에서 CD의 PL 수명 변화가 철저히 조사되었습니다. 그림 4d, e는 온도의 함수로 점의 PL 방출 최대값에서 수집된 시간 분해 PL 데이터를 보여줍니다. 연구된 온도 범위에 걸친 과도 PL의 색상 플롯이 그림 4d에 나와 있으며, 이는 온도가 증가하면 겉보기 PL 감쇠가 단조롭게 단축된다는 것을 보여줍니다. 기록된 모든 붕괴 곡선은 단일 지수 함수를 사용하여 피팅되었습니다. 추출된 수명에 대한 데이터는 그림 4e에 나와 있습니다. 온도가 2에서 80°C로 증가함에 따라 PL 수명은 11.0에서 5.3ns로 단조롭게 감소합니다. 이 PL 수명 감도가 입증된 온도 범위(2–80°C)는 생리학적으로 관련된 온도 범위와 많은 전자 장치의 일반적인 작동 온도를 모두 포함합니다. 이 PL 수명 CD 기반 열 프로브의 절대 유사 선형 감도는 0.08ns K
−1
입니다. , 최대 상대 감도는 1.79% K
−1
입니다. 62 °C에서 연구된 온도 범위에서 CD 기반 발광 나노프로브의 PL 붕괴의 단일 지수 맞춤은 단일 매개변수인 PL 수명(τ)을 산출하며, 이는 교정 곡선을 사용하여 온도 단위로 직접 변환될 수 있습니다. 이는 PL 수명 측정과 관련된 응용 분야에서 유용성을 제한하는 다중 지수 감쇠를 나타내는 일반적인 반도체 양자점에 비해 중요한 이점입니다.
그들은 또한 PBS(phosphate-buffered saline)와 Dulbecco의 변형된 Eagle 배지(DMEM)에서 CD PL 수명의 온도 의존성을 연구했으며 유사한 행동을 보였습니다.
CD 기반 발광 온도계의 재사용성을 입증하기 위해 선택된 샘플의 PL 감쇠 곡선을 15°C에서 45°C 사이의 온도에서 7회의 연속적인 가열 및 냉각 주기에 걸쳐 측정했습니다(그림 5a).
아 7개의 순차적인 가열 및 냉각 주기에 대한 PL 붕괴 가역성의 정규화된 색상 플롯. ㄴ 15~40°C 사이에서 가열 및 냉각을 7회 반복하는 동안 PL 수명의 해당 열 안정성. (참조 [89]에서 재생산)
각 측정 주기에서 PL 감쇠는 5분 열 평형 후 측정되었습니다. 가열 및 냉각 주기 동안 열 히스테리시스가 관찰되지 않았으며, 결과적인 PL 수명 변화가 (그림 5b)에서 시간의 함수로 표시되어 CD의 PL 수명이 우수한 열 안정성을 나타냄을 보여줍니다.
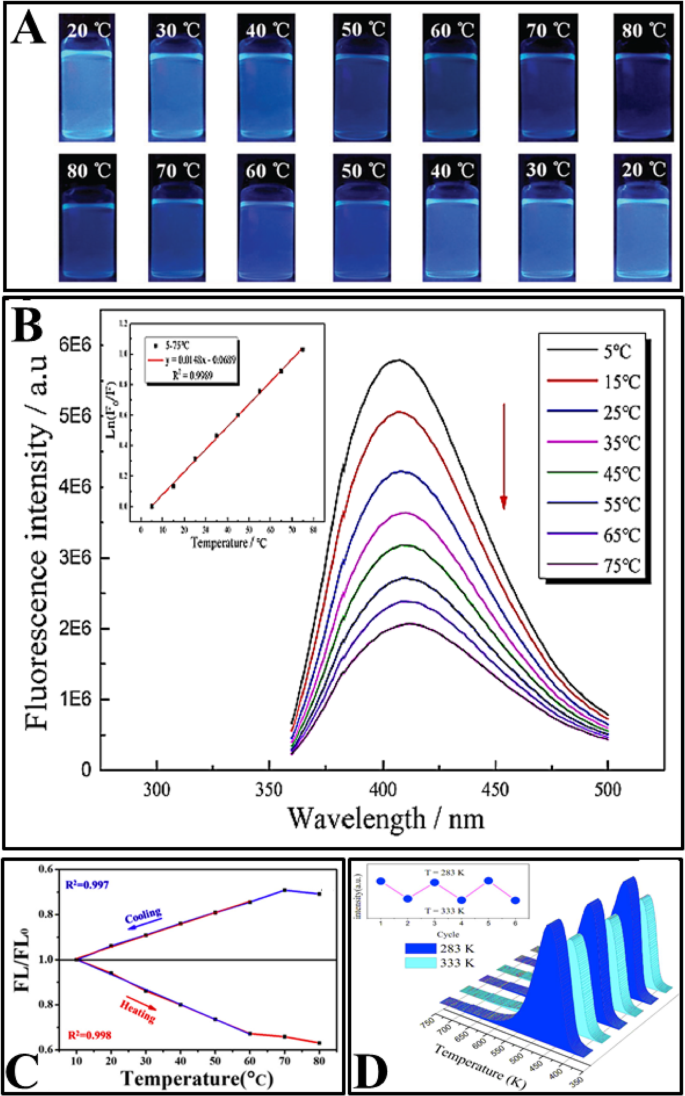
나중에 열수 및 용매열 처리[2, 77, 92, 95, 97,98,99,100,101,102,103], 열 환류[94, 96] 및 레이저와 같은 다양한 합성 방법을 사용하여 온도 의존적 방출을 갖는 여러 CD가 준비되었습니다. 준비된 CD는 생리학적 범위에서 선형 온도 의존적 형광을 보였다(표 1 참조). CD의 형광 강도는 온도가 증가함에 따라 감소했습니다. 또한 모든 논문에서 형광 강도의 가역성과 복원성이 연구되었습니다. 그림 6은 다양한 기사에서 연구된 CD의 몇 가지 일반적인 속성을 보여줍니다.
아 가열(상단) 및 냉각 과정(하단) 동안 서로 다른 온도에서 UV 광(365 nm) 여기 하에서 N, S-CD의 디지털 사진. (참조 [96]에서 재생산). ㄴ 340 nm에서 여기될 때 5–75 °C(위에서 아래로) 범위에서 측정된 N, S 공동 도핑된 CD의 형광 방출 스펙트럼, 삽입:Ln에 대한 온도의 해당 선형 회귀(F /F 0 ). (참조 [97]에서 재생산). ㄷ FL/FL0 -냉각 및 가열 공정 중 MnOx-CD의 온도 플롯. (참조 [103]에서 재생산). d CD 솔루션의 PL의 가역적 온도 의존성. (참조 [102]에서 재생산)
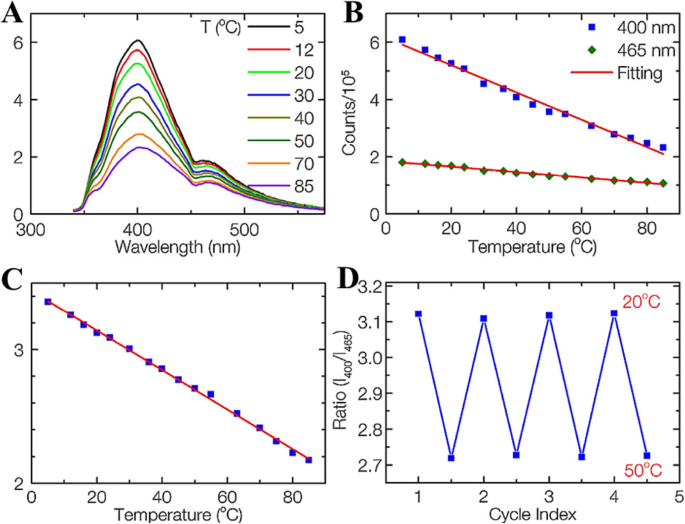
Nguyen et al. [14] 에틸렌-디아민에서 흑연 분말의 펨토초 레이저 절제를 사용하여 탄소 점(CD)을 합성했습니다. 풍부한 작용기가 표면에 형성되어 표면 사이트에서 다중 표면 상태를 형성하고 CD의 다중 방출을 초래합니다. 그들은 정상 상태 형광 스펙트럼을 사용하여 CD의 형광 의존성 온도 감도를 조사했습니다. 320 nm 여기에서 CD의 온도 의존적 방출 스펙트럼은 그림 7a에 나와 있습니다. 400 및 465 nm 피크의 형광 강도는 모두 비방사 붕괴 경로의 열 활성화로 인해 온도가 증가함에 따라 점차적으로 감소합니다. 피크 강도는 5~85°C 범위의 온도에 따라 선형으로 변합니다(그림 7b). 온도에 민감한 CD는 400 및 465 nm 피크에 대해 °C당 3.3% 및 2.1%의 형광 강도 변화를 보여주었습니다. 이는 CD가 고감도의 기존 강도 기반 온도 센서로 사용될 수 있음을 나타냅니다.
아 5~85°C에서 기록된 CD의 방출 스펙트럼은 320nm에서 여기됩니다. ㄴ 400 및 465 nm 피크 대 온도의 형광 강도. ㄷ 465 nm에 대한 400 nm의 비율은 온도의 함수로서 피크입니다. d 20~50°C에서 CD의 온도 가역성 연구. (참조 [14]에서 재생산)
놀랍게도, 독특한 다중 방출 특성으로 인해 CD는 비율계량적 형광 온도 센서에 대한 유망한 형광단이 됩니다. 온도에 대한 400 및 465 nm(320 nm 여기)에서의 두 형광 강도의 비율이 그림 5c에 나와 있습니다. 5 ~ 85°C의 넓은 온도 범위에서 강도 비율과 온도 사이에는 매우 좋은 선형 관계가 있습니다(R
2
=0.998). Thermal linearity is advantageous since it makes the correlation between the peak-intensity ratio and temperature straightforward and meanwhile provides a constant thermal sensitivity along with the entire dynamic range. The temperature-sensitivity of CDs is determined to be 1.48% °C
−1
, which is comparable with that of other materials. It should be noted that the temperature response range of CDs is much wider than those of other reports on dual-emission temperature sensors and covers both the physiological temperature for biology studies and the working temperature for many electronic devices. Besides 320 nm excitation, the CDs also work at other excitation wavelengths, such as 340 and 365 nm, with the same sensitivity. Thus, the CDs can be utilized for temperature sensing in many practical applications by selected different working wavelengths.
They have shown that the ratiometric temperature sensor was reversible between 20 and 50 °C, four cycles and photostable (when the intensity of the power source changed) as shown in Fig. 7d. This result suggests that the CDs sensing system is stable and robust with any changes in sample concentration, excitation, or detection efficiency.
Increasing temperature is not always accompanied by PL quenching; however, it could show enhancement of the PL as well. Macairan et al. [29] showed the PL enhancement of dual-fluorescent carbon dots with increasing temperature. They prepared biocompatible dual-fluorescing carbon dots CDs in a one-step microwave assisted-reaction using formamide and glutathione. They found that following excitation at 640 nm, the fluorescence intensity and PL integrated area increase over the range of 5–60 C by a factor of 3.5 observed over the entire analysis range and the temperature (Fig. 8a). As shown in Fig. 8b, a linear response (R
2
=0.999) is observed over the entire analysis range and the temperature sensitivity was determined to be as high as 3.71% C
−1
.
아 Excitation at 640 nm yields a 3.5-fold increase in fluorescence intensity and the corresponding integrated area is plotted in b showing a linear response over the range of 5–60 °C. ㄷ Changes in the fluorescence spectra of the CDs (λex =405 nm) as a function of temperature over the entire range. A 1.3-fold decrease is noted for the blue fluorescence in contrast to the 3-fold increase for the red counterpart. d The ratio of the integrated areas of the red and blue fluorescence components are plotted as a function of temperature showing a linear increase over the entire temperature range. (Reproduced from reference [29])
The temperature-dependent fluorescence was also studied following excitation at 405 nm. Interestingly, the blue and red fluorescence bands are not equally sensitive to the change in temperature. With increasing temperature, the fluorescence intensity (and the corresponding integrated area under the curve) of the blue component shows a very slight decrease in contrast to the red component, which significantly increases (Fig. 8c). These observations are noted over the range of 5–60 °C where the blue emission decreases by a factor of 1.3 in contrast to the red emission, which increases by a factor of 3.0.
As shown in Fig. 8d, the ratio of red to blue fluorescence increases with temperature, and a highly linear response is triplicate on 3 unique samples and the linear plot reflects the observed with an R
2
=0.998. These analyses were repeated in an average of these measurements, which have small deviations at each temperature. The thermal sensitivity of the CDs, over the entire temperature range, varied from 1.33 to 4.81% °C
−1
, which is an improvement over previously reported carbon dot nano-thermometry systems and other dual-emitting nanomaterials such as quantum dots and metal-organic frameworks-dye composites. The thermal resolution of the CDs was calculated to be 0.048 K
−1
indicating that it is indeed possible to measure small thermal changes.
Zhang et al. [98] synthesized CDs that have temperature-responsive characteristics in the range of 25–95 °C, and they have excellent sensitivity and remarkable reversibility/recoverability (Fig. 9a). CD/epoxy composites were further prepared by uniformly doping CDs into an epoxy resin. First, 5 μg of the CDs were dissolved in 50 μL of triethylenetetramine (TETA). Then, 350 μL epoxy resin was added to the mixed solution and fully mixed by high-speed stirring. The resulting composite showed significantly enhanced temperature response.
아 Temperature dependence of the CD emission. ㄴ CD/epoxy composites. ㄷ Temperature dependence of the emission of the CD/epoxy composites. (Reproduced from reference [98])
Epoxy resin is a common thermosetting resin and is widely used to package LED chips. Figure 9b shows optical micrographs of CD/epoxy composite discs of approximately 2 cm in diameter and 8–10 mm in thickness. The cured CD/epoxy composites are transparent, and their fluorescence emission spectra are shown in Fig. 9c. The emission peak of the CD/epoxy composite is blue-shifted by approximately 10 nm compared to that of the CDs’ solution. Notably, the temperature response of the composite is significantly improved. In the temperature range of 25–95 °C, the fluorescence intensity decreases by 35% with increasing temperature, which is more than twice that of the solution state, and the linear results are more stable. The linear equation satisfies I 0 /나 =0.0074 [°C] + 0.80454 (R
2
=0.99724), where I 0 그리고 나 are the fluorescence intensity of the CD/epoxy composite before and after the temperature rise, and the excitation wavelength is 360 nm. The blue shift of the emission peak and the enhancement of the temperature response characteristics may be due to changes in the dielectric constant of the environment in which the CDs are located. The composite has a wide temperature detection range, and its excellent sensitivity and stability make it suitable for use as a temperature sensor based on a fluorescent nanomaterial in a variety of environments.
Up to now, there is no well-established mechanism for explaining the thermo-sensing behavior of carbon dots. Some reports attribute the mechanism to the thermal activation of non-radiative channels of surface (trap/defect) states. The general picture is that the non-radiative channels were not activated at low temperatures, so the excited electrons could emit photons radiatively. On the contrary, as the temperature increases, more non-radiative channels became activated, and excited electrons got back to the ground state by non-radiative processes, leading to the decreasing fluorescence intensity [2, 95, 99, 100, 103]. The mechanism of CDs emissions with heating/cooling is shown in Fig. 10.
Schematic illustration of CDs responding to temperature changes
To better understand the thermodynamics of the CD emission processes, Kalytchuk et al. [89] correlated the radiative (\( {\tau}_r^{-1} \)) and nonradiative ( \( {\tau}_{nr}^{-1} \)) recombination rates of a CD sample with its PL quantum yield. The radiative rate is determined from the PL quantum yield (QY) and the measured recombination rate τ
−1
as \( {\tau}_r^{-1} \) =QY × τ
−1
. The nonradiative relaxation rate \( {\tau}_{nr}^{-1} \) is expressed as \( {\tau}_{nr}^{-1} \) =τ
−1
- \( {\tau}_r^{-1} \). The PL QY of CDs at various temperatures was calculated from their temperature-dependent absorption and integrated PL intensity together with the PL QY determined at room temperature. Both radiative and nonradiative recombination rates derived from time-resolved PL measurement data are plotted as functions of temperature in Fig. 11. The radiative recombination rate is greater than the correspondent nonradiative rate up to 70 °C and does not vary appreciably at temperatures between 2 and 80 °C, remaining in the range of (0.74–0.82) × 10
6
s
−1
. In contrast, there is a pronounced (almost 7-fold, from 0.16 × 10
6
to 1.12 × 10
6
s
−1
) monotonic increase in the rate of nonradiative recombination by increasing the temperature from 2 to 80 °C. Temperature-dependent crossover of the radiative and nonradiative rates occurs at 70 °C, at which temperature the PL QY is 50%. These results suggest that the temperature activation of PL quenching in their CDs is primarily caused by the activation of nonradiative relaxation channels [89].
Radiative (solid symbols, blue color) and nonradiative (hollow symbols, red color) recombination rates for CDs plotted against the temperature for temperatures of 2–80 °C. (Reproduced from supporting information of reference [89])
Guo et al. [102] ascribed the thermal-quenching of their prepared carbon dots not just to activation of the nonradiative decay process, but also to the occurrence of nonradiative trapping with increasing temperature. They measured the temperature-dependent decay lifetimes of the CDs and shown in Fig. 12a. The data were collected by monitoring emission maximum as a function of the temperature under the 320 nm laser excitation. The result shows that the PL lifetime drops from 15.03 to 11.70 ns with the temperature increasing from 283 to 343 K, which could be ascribed to the occurrence of nonradiative decay processes. Besides, the PL relaxation dynamics of the CDs reveal multi-exponential decay with temperature increasing, which suggests the photoexcited carriers following the complicated relaxation processes. The occurrence of non-radiative trapping will be increased with rising temperature, and this could be quantitatively analyzed by the Arrhenius plot of the integrated PL intensities as:
Temperature-dependent decay curves of CDs solution (a , λex =350 nm, λem =450 nm); the dependence of ln[(I 0 /나 T )-1] on 1/kT CDs solution (b ). (Reproduced from reference [102])
여기서 E 아 is the activation energy, k is the Boltzmann constant, and a is a constant. Figure 12a displays the plotting of the emission intensity with respect to 1/T , where the value of activation energy (E 아 ) is calculated to be 0.329 ± 0.02 eV. In order to probe the reason for thermal quenching of CDs emission process, the radiative (V r ) and nonradiative (V nr ) recombination rates of CDs were determined from the lifetime (τ*) and quantum yield (QY) as:
The QY of CDs at various temperatures was calculated from their temperature-dependent absorption and integrated PL intensity with the QY determined at room temperature. They have noticed that the radiative rates have a slight decline when the temperature rises from 283 to 343 K; at the same time, the nonradiative recombination rates have gradually increased by about 2-fold. These results further indicate that the temperature-activated PL quenching in CDs is mainly due to the activation of nonradiative relaxation channels [102].
Other groups used microscopic and spectroscopic techniques to understand the mechanism of thermos-sensing of carbon dots.
Wang at el. used TEM and UV–Vis spectra to study the temperature-responsive PL behavior of prepared CDs. As shown in Fig. 13a, the CDs display no change in the UV–Vis spectra upon increasing the temperature from 20 to 80 °C. However, it was found that the average diameter of CDs increased from 2.6 ± 0.2 nm at room temperature to 4.4 ± 0.2 nm at 80 °C (Fig. 13b). Thus, increasing the temperature, the aggregation of as-prepared CDs occurred which caused the obvious fluorescence quenching [1].
아 UV–Vis absorption spectra of CDs in aqueous solution under 20 and 80 °C. ㄴ the TEM image of CDs in aqueous solution (a ) at room temperature, the average size was 2.6 ± 0.2 nm (b ) at 80 °C, and the size increased up to 4.4 ± 0.2 nm. (Reproduced from reference [1])
He et al. [101] reported that the hydration particle size of their CDs emerges as larger with the increase in the temperature (Fig. 14a), which indicates that the temperature rise gives rise to the aggregation of the CDs, eventually results in the fluorescence quenching. Nonetheless, with the decline in the temperature, the hydration particle size of CDs starts declining (Fig. 14b), which indicates that the cooling has the potential of causing CDs to depolymerize [101].
Change of hydrated particle size of carbon dots during heating (a ) and cooling (b ). (Reproduced from reference [101])
Another group such as Cui et al. also attributed the fluorescence quenching to the aggregation of CDs. They also tried to apply the undoped CDs synthesized using only acrylic acid as a precursor in temperature sensors. Unfortunately, undoped CDs possessed weaker quenching effects under the same temperature elevation than doped CDs [92].
Yang et al. [94] in their work proposed two key factors concerning the temperature-dependent PL property of the N-CDs, including (i) surface functional groups and (ii) hydrogen-bonding interaction. To examine the effect of the first factor, the surface O-containing groups, another control experiment was conducted by treating N-CDs (4.0 mL) with a strong reducing agent NaBH4 (1.0 mL, 0.1 mol L
−1
) to remove C=O species on carbon dots surface. The obtained reduced N-CDs are denoted as r-N-CDs for brevity. Compared with N-CDs, the r-N-CDs exhibit weaker fluorescence intensity (Fig. 15a). Besides, the fluorescence intensity of r-N-CDs only decreases by 13% with temperature increasing from 20 to 80 °C (the inset in Fig. 15a) that gives a much lower temperature sensitivity, which is ascribed to the decreased O-containing groups [94].
아 PL spectra (excitation wavelength, 400 nm) of N-CDs (black trace) and r-N-CDs (red trace). The inset shows I /나 0 −T of reduced N-CDs. ㄴ PL spectra (excitation wavelength, 400 nm) of N-CDs dispersed in C2 H5 OH at various temperatures. ㄷ A schematic mechanism for the temperature-dependent fluorescence intensity of N-CDs. (Reproduced from reference [94])
The second factor, the effect of hydrogen bonding with the solvent on fluorescent behavior of N-CDs was explored. N-CDs solution (1.0 mL) was dropped on a filter paper and left to dry in the air to obtain a solid sample, which still emits bright fluorescence. However, no obvious change of fluorescence intensity of the solid N-CDs with temperature increase was observed. They also measured the fluorescence of N-CDs dispersed in ethanol. The fluorescence intensity of N-CDs in C2 H5 OH is lower than that in water and little variation of the PL intensity is observed with temperature increasing from 20 to 80 °C (Fig. 15b). Hence, the strong hydrogen bonds play a key role in the temperature-dependent PL property of the N-CDs. Figure 15c is a schematic mechanism for the temperature-dependent fluorescence intensity of N-CDs [94].
However, our group used the same experimental strategy as Yang group; in both cases, the r-CDs and e-CDs emissions were quenched linearly with increasing temperature, in the same way as the original results of their CDs (Fig. 16). Thus, our results ruled out the synergistic effects of abundant oxygen-containing functional groups and hydrogen bonds [77].
아 , b Fluorescence spectra of reduced CDs (r-CDs) and CDs in ethanol (e-CDs) at temperatures (20 to 60 °C). ㄷ , d Linear correlation between fluorescence intensity and temperature (°C) for r-CDs and e-CDs respectively. (Reproduced from the supplementary information of reference [77])
In literature, only a few articles explored the temperature-responsive fluorescent properties of CDs in biological imaging. Prior to such experimentations, in vitro cytotoxicity analysis is crucial for CDs because they make it possible to estimate the CD’s toxicity in living subjects. In vitro cytotoxicity analysis evaluates the effect or influence of the nanomaterial on cultured cells [89].
Yang et al. [94] verified that the CDs could be used as an effective thermometer in living cells; HeLa cells were washed with PBS after treatment with CDs for 6 h. Bright-blue fluorescence of the CDs in HeLa cells is observed when the temperature is 25 °C as shown in Fig. 17a. With the temperature increasing to 37 °C, the blue fluorescence becomes weaker (Fig. 17b), the fluorescence of N-CDs is recovered when the temperature was decreased to 25 °C (Fig. 17c). As a thermos-imaging in vivo, the fluorescent images of mice were collected immediately after being injected with N-CDs at different temperatures. By setting the fluorescence intensity at 28 °C as the reference (I 오 ), 나 /나 오 of the area where CDs were injected varies from 1.0 to 0.87 with the increase of temperature from 28 to 34 °C (Fig. 17d, e). With temperature further increasing to 43 °C, I /나 오 declines to 0.52 and the fluorescence becomes nearly undetectable (Fig. 17f). And I /나 오 can be reversibly enhanced back from 0.66 to 1.0 with the temperature decreases from 39 to 28 °C (Fig. 17g–i). All of these results indicated that N-CD could be used as an effective in vitro and in vivo nanothermometer [94].
a–c Fluorescent images of a single Hela cell at 25, 37, and 25 °C after treatment with N-CDs, respectively. d –f Fluorescent photographs of a mouse given an injection of N-CDs at increasing temperatures. 지 –나 Fluorescent photographs of a mouse given an injection of N-CDs at decreasing temperatures. ( Reproduced from reference [94])
In an exploratory experiment, Kalytchuk et al. tested the capacity of CDs for intracellular temperature monitoring in human cervical cancer HeLa cells. Figure 18 shows the measured intracellular temperatures of HeLa cells incubated with CDs (500 μg/mL). The CDs’ PL decay curves at each temperature were highly reproducible and could be fitted with a single-exponential function at all recorded temperatures. In Fig. 18a, the recorded PL decay curves for temperatures between 25 and 50 °C (with a step size of 5 °C) are indicated by symbols, while the corresponding single-exponential fits are represented by solid lines. They were able to confirm that the PL signal in these PL lifetime measurements was derived exclusively from the CDs for the CD concentration of ≥ 100 μg/mL. The intracellular temperature in each measurement was determined from the calibration curve between PL lifetimes as the temperature increases from 2 to 80 °C. The temperatures determined in this way (T meas ) are plotted as functions of the PL lifetime in Fig. 18b. Independently, the temperature of the cell solution was determined using a calibrated reference thermometer (shown in Fig. 18b as Tset ). The temperatures reported by the luminescent CD probe and the reference detector are in good agreement. These results show that the PL lifetime of nanoprobes based on CDs can be reliably used to measure intracellular temperatures [89].
In vitro intracellular PL lifetime thermal sensing using CDs. 아 PL emission decays of HeLa cells incubated with CDs (500 μg/mL) at different temperatures (T set ). ㄴ Temperatures determined using the calibration (T meas ) and set temperatures (T set ) plotted against the PL lifetime. ㄷ –f Applicability of CDs for long-term remote intracellular temperature monitoring. ㄷ PL lifetimes extracted from PL transients recorded every 15 min for 24 h of HeLa cells incubated with CDs (500 μg/mL). d Temperatures determined using the calibration curve. 이 Temperatures measured with a reference thermometer (T ref ). 에 Histogram showing the distribution of temperature differences between the obtained and reference temperatures; the solid line is the distribution curve. (Reproduced from reference [89])
To further evaluate the potential of luminescent CD nanoprobes for long-term real-time temperature monitoring, PL decay profiles of HeLa cells incubated with CDs (500 μg/mL) every 15 min for 24 h were recorded. The PL lifetimes extracted from the measured PL decay values during this period were then plotted as functions of time, as shown in Fig. 18c. Using these results, the temperature variation over time was calculated using the calibration curve, as shown in Fig. 18d. In addition, the sample’s temperature at each measurement point was determined using a reference thermometer with a temperature reproducibility of 60 mK. The temperature determined with the reference thermometer is plotted in Fig. 18e, which shows that there was excellent agreement between the measured and reference temperatures. The high accuracy of the PL-based temperature measurements is further demonstrated by statistical analysis of the differences between the measured and real (reference) temperatures (Fig. 18f). Using these data, the absolute average accuracy of temperature detection by the presented method was calculated to be 0.27 °C. This experiment confirms the potential of CD-based thermal probes in biological systems [89].
Macairan et al. [29] displayed that the prepared CDs can be used for thermal sensing inside cells using intensity and ratiometric approaches. HeLa cells treated with CDs were allowed to equilibrate at 32, 37, and 42 °C (Fig. 19). Excitation at 640 nm was used to selectively monitor the red fluorescence of the CDs in the cells. The thermal changes could be due to changes in intracellular concentration or not correlate with a change in intensity (λex + 640 nm). This could be due to changes in intracellular concentration or localization of the CDs at higher temperatures. Thus, simply relying on changes in fluorescence intensity leads to accurate intracellular thermal sensing.
Fluorescence microscopy images of CD-treated HeLa cells. Fluorescence signals from the CDs (λex =640 nm; left and 405 nm; right) fluorescence ratios are 1.8 at 32 °C, 2.0 at 37 °C, and 2.3 at 42 °C. The control shows untreated HeLa cells at 42 °C with no fluorescence signal as expected. (Reproduced from reference [29])
In contrast, these limitations are excluded using the ratiometric approach. The CDs maintain dual blue and red fluorescence in cells following excitation at 405 nm, as previously observed for the colloidal dispersions (Fig. 19). The red-to-blue ratio increases with increasing temperature, with values of 1.8 at 32 °C, 2.0 at 37 °C, and 2.3 at 42 °C. The ratiometric relationship of the red-to-blue fluorescence of the CDs highlights the advantage of ratiometric temperature sensing in the development of fluorescent nano-thermometry probes. The relative red-to-blue emission ratio remains unaffected, regardless of the amount of CDs taken up by the cells, which can be affected by various factors such as confluency and is not concentration-dependent. Lastly, the CDs have shown fluorescence reversibility with respect to changes in intracellular temperature. Following incubation in HeLa cells, they were subjected to a heating/cooling cycle from 32/42/32 °C. This emphasizes the robustness of the proposed CD-nanothermometer and these findings further demonstrate the fluorescence reversibility [29].
Confocal laser scanning microscopy was used to thermal image colon cancer cell HT-29 using N, S, and I-doped CDs, as shown in Fig. 20 [100]. The fluorescent spots were temperature-dependent as shown in Fig. 20g–i, as the most intense is at 15 °C, while the weakest point was at 35 °C. Interestingly, the fluorescence spots were reversible, and the spots were very photostable after 20 min of continuous excitation [100]. Shin et al. [96] also used confocal laser scanning microscopy for Hela cells, shown in Fig. 20e–g.
a–d Are confocal microscopy images of N, S, I-CDs-colon cancer cell HT-29 with corresponding fluorescence field at 15, 25, 35, and 15 °C, respectively. (Reproduced from reference [100]). 이 –지 Confocal microscopy images of N, S-CDs-stained cells with corresponding fluorescence field at 25, 35, and 25 1C, respectively. (Reproduced from reference [96])
Li et al. 103 prepared a nanocomposite composed of MnOx-CDs to be used as a nano thermos responsive fluorophore for biological environments. HepG2 cells were incubated with MnOx-CDs at different culture temperatures. As illustrated by confocal laser scanning microscopy (excited at 405 nm), the blue luminescence of the MnOx-CDs in the HepG2 cells is weak when the environmental temperature was 40 °C (Fig. 21a), and the blue luminescence of the MnOx-CDs in HepG2 cells enhances as the temperature decreased to 30 °C (Fig. 21b) even to 20 °C (Fig. 21c). Due to the temperature-responsive properties, the as-synthesized MnOx-CDs can be readily applied in the biomedical fields like bioimaging and photothermal therapy in cancer treatment [103].
Confocal laser scanning microscopy images (excited at 405 nm) of MnOx-CDs in HepG2 cells at 40 °C (a ), at 30 °C (b ), and 20 °C (c ). (Reproduced from reference [103])
Carbon nanodots exhibit unique properties to be exploited for nanothermometry, such as thermal-sensitivity, low-cost, and photostability. Flexible surface modification and facile preparation will pave the way to establish an enormous number of thermal sensitive nanomaterials for a variety of applications. The overall trends in thermo-sensing nanomaterials are aimed at enhancing photostability and thermal-resolution with using low-cost and safe materials. CDs can be classified as a new generation of thermometer that can fulfill these requirements and can be used for biomedical thermometry applications, such as temperature monitoring during hyperthermia treatment. Facile-preparation protocols, biocompatibility, and easy functionalization of CDs are promising criteria which make the CDs alternative next-generation nanothermometer materials. More efforts are required to promote basic research in this field. Limitations should be overcome to produce carbon dot-based nanothermometers comprising enhancing thermal sensitivity, and working in a broader range of temperature. A better understanding of the fluorescence thermal-sensing mechanism is another key issue to be able to design and manipulate the structure of CDs and enhance thermal resolution. More experiments and theoretical modeling are necessary to understand the correlation between the methods of fabrication of CDs with their thermal behavior.소개
나노온도계
나노 온도계로서의 탄소 점


Mechanism of Thermo-sensing


Bioimaging in Living Cells (Thermal Imaging)


Conclusions and Future Perspective
나노물질
미국 워싱턴주 모세 레이크에 있는 SGL Carbon의 다중 라인 시설에 있는 탄소 섬유 생산 라인은 원래 BMW용 탄소 섬유를 만들기 위해 설립된 공장에서 50k 견인 탄소 섬유를 생산합니다. 출처:SGL 카본. 출처 | SGL 카본 특수 화학 대기업 Solvay(벨기에 브뤼셀)와 탄소 섬유 제조업체 SGL Carbon(독일 비스바덴)은 대형 토우 기반 복합 재료 최초의 시장 출시를 위한 공동 개발 계약(JDA)을 체결했다고 3일 보고했다. 중간 모듈러스(IM) 탄소 섬유. 비용 및 CO2 절감의 필요성을 해결하는 데 도움이
유인 잠수정 서비스 제공업체인 OceanGate Inc.(미국 워싱턴주 에버렛)는 우주항공 등급의 우선 제공업체로 Toray Composite Materials America Inc.(CMA, Tacoma, USA)를 선정했다고 3월 23일 보고했다. 심해 유인 잠수정에 사용하기 위한 새로운 탄소 섬유 압력 용기 제조에 사용하기 위한 프리프레그 탄소 섬유 재료입니다. 새로운 압력 용기의 생산은 올해 말에 시작될 예정입니다. “CMA는 항공우주 산업에서 오랫동안 신뢰할 수 있는 공급업체였으며 프리프레그 복합 재료의 개발 및 혁신