

자동화 제어 시스템

산업 제조
Sure Controls에 홈메이드 맥주 기계가 있다는 것은 잘 지켜진 비밀입니다. 맥주 기계는 항상 우리가 고객에게 제공하는 모든 시설 투어의 하이라이트입니다. Plant Intelligence 기능 중 일부를 시연하는 매우 멋진 방법이 될 수도 있다고 생각했습니다! 몇 주 전에 상주하는 양조장인 Josh가 몇 개의 배치를 양조했습니다. 그가 맥주를 양조하는 동안 우리는 고객 프로젝트의 내부 테스트에 사용하는 사내 Historian을 연결하고 데이터를 수집하는 데 사용했습니다. 이 기사를 통해 설명하고 싶은 것은 프로세스에 연결하여 데이터를 전달하고 데이터가 수집되면 데이터를 보는 데 사용할 수 있는 방법입니다.
파트 1 – 데이터 수집
이전 블로그 "Demystifying Data Collection"에서 표준 및 프로토콜에 대해 자세히 설명했습니다. 여기서 자세히 다루지는 않겠지만 이 연습은 우리가 고객을 위해 실행하는 프로젝트에 접근하는 방법의 좋은 예입니다. 먼저 우리가 수집해야 할 정보의 중요한 포인트가 무엇인지 결정하기 위해 양조 마스터 Josh와 함께 앉았습니다. 기본적으로 양조 과정에는 Mash, Boil 및 Break의 세 단계가 있습니다. 이 단계에서 모니터링해야 할 중요한 항목은 온도입니다. 또한 우리는 데이터 수집 시스템에 우리가 어떤 프로세스 단계에 있는지 알려주는 방법이 필요했습니다.
온도 데이터를 수집하기 위해 우리는 맥주 기계를 분석했고 조리 용기의 히터를 제어하기 위해 배선된 온도 컨트롤러가 있음을 확인했습니다. 프로세스에서 사용됩니다. 운 좋게도 이러한 컨트롤러에는 통신 기능이 있으므로 필요한 표준 및 프로토콜을 결정하기만 하면 됩니다. 이러한 특정 컨트롤은 Modbus를 통신 프로토콜로 사용합니다. Modbus는 매우 일반적이고 대화하기 쉽기 때문에 이것은 훌륭합니다. 한 가지 문제는 컨트롤러 자체가 통신을 위해 직렬 링크만 사용하고 Historian 서버가 어느 정도 멀리 떨어져 있다는 점이었습니다. 이를 해결하기 위해 직렬 대 TCP/IP 게이트웨이 장치를 사용했습니다. 이를 통해 Historian 서버는 Modbus TCP를 사용하여 컨트롤과 직접 통신하고 필요한 온도 데이터를 수집할 수 있었습니다. 다음으로 프로세스 단계 문제를 해결합니다.
프로세스의 어느 단계에 있는지 파악하기 위해 소형 PLC와 HMI를 사용하기로 했습니다. 다행스럽게도 애플리케이션 테스트에 사용하는 작은 PLC와 판매 데모에 사용하는 HMI가 있었습니다. 우리는 텍스트 데이터를 저장하는 레지스터로 PLC를 프로그래밍했습니다. We then programmed the HMI with some simple buttons for our brew master Josh to select which step of the brewing process he was in. By pressing the “Mash” button for example, the HMI would then write the value “Mash” into the register programmed in the PLC. The PLC was connected to the Ethernet network, and Historian could then read the register directly logging the process step. This will aid later when viewing the data, in order to give it context.
Part 2 – We have data – now what?
Once the batch of beer was brewed, we used the process steps logged by the PLC as our flags for pulling the data. By noting when the process steps change, we could capture the start and end points for each step of the process. We then brought up each step of the process in a trend view:
The Mash
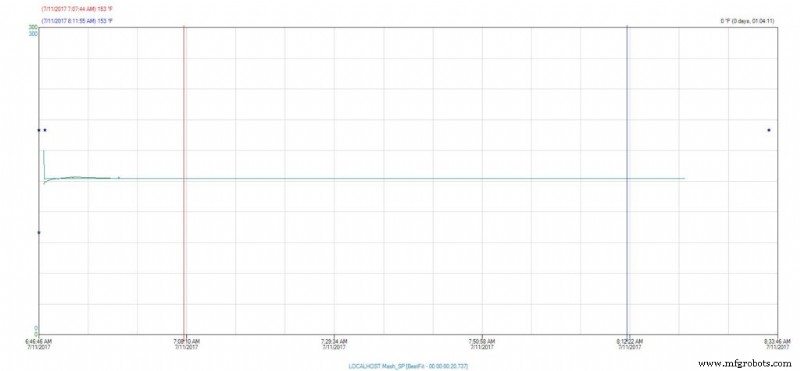
Here we can see that during the Mash phase of the brewing process, our temperature maintained a steady 153° Fahrenheit.
The Boil
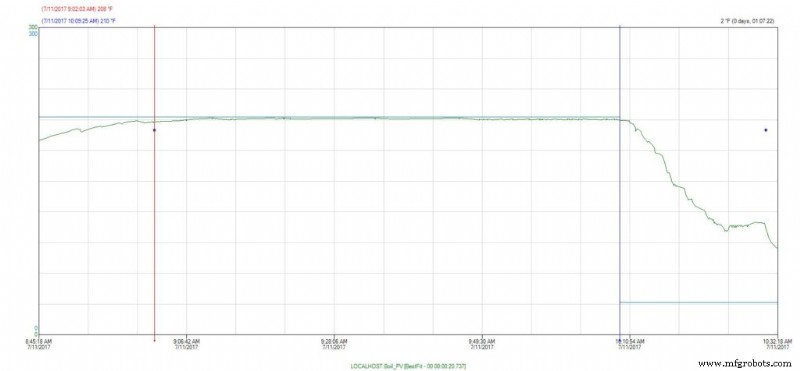
The same thing holds true for the boil phase, our temperature holds at a steady 210° Fahrenheit.
The Break
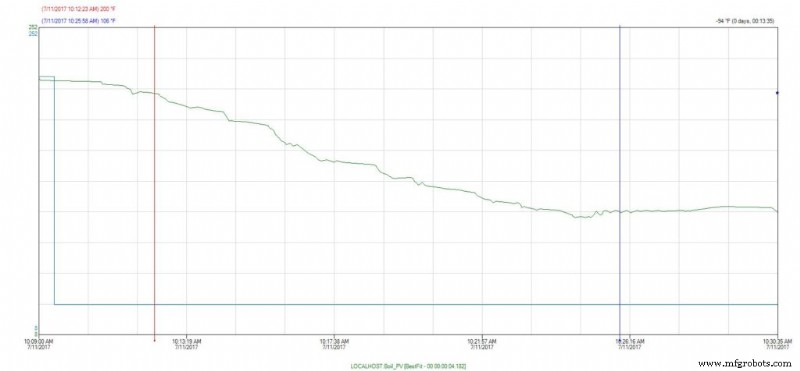
This step is considered critical to the brewing phase, as it is important to bring the Wort (this is what the liquid is called during the brewing process – it’s not beer yet) down to a temperature where it is safe to pitch the yeast. We can see here by our trend that it took approximately 13 minutes to bring the Wort from 200° down to 100° Fahrenheit. All in all, it appears our brew master did an excellent job with this particular batch of beer.
Let’s talk a bit more about the data. We used trends for our initial analysis. Presenting the data visually in this way allow us to quickly spot any anomalies that might have cropped up during the process. If, for example, during the boil phase, if we saw a sudden drop in temperature for a small period of time, then we would start to ask what happened? Did a fuse pop, causing an actual loss in temperature, thus putting the batch in peril? Or did a sensor become detached and thus the data is skewed, but once reattached we could see the temperature was holding constant, so the batch is likely okay? This kind of analysis can become very useful in identifying “what went wrong” if something didn’t pass quality tests for example.
So, what if we just want a simple summary of what happened during the batch? Using the Query tool from our Historian client, I can do a simple summary like this:
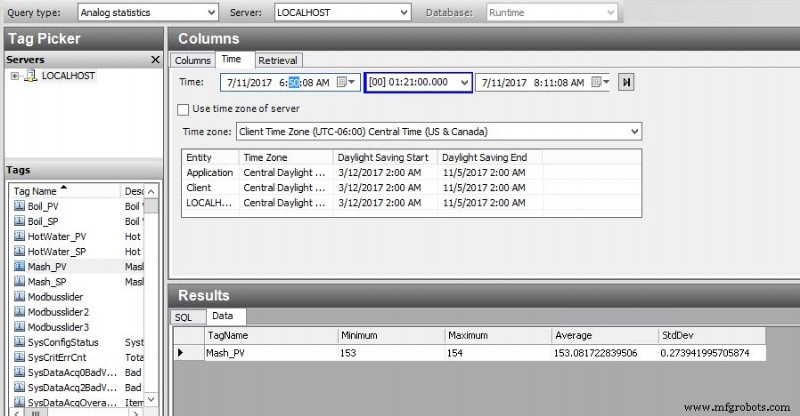
This is a very simple statistical analysis of the temperature of our Wort during the Mash phase. I pulled Min, Max, Average and Standard Deviation. This gives us a great one line view of what happened. I can see that the temperature stayed within one degree of setpoint, and averaged almost exactly at setpoint for the duration of the time.
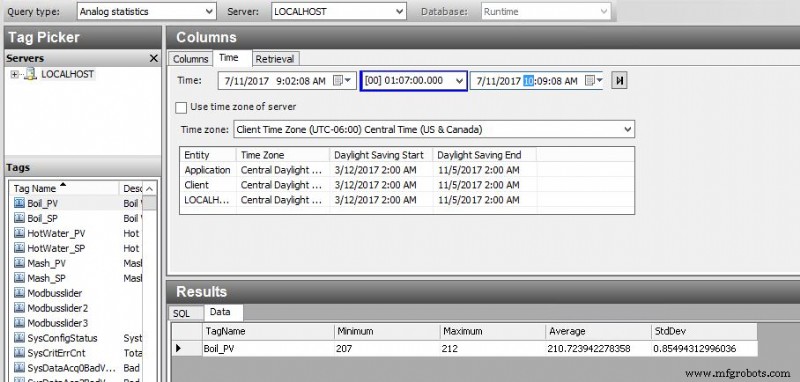
I can see that there is a slightly larger variation during our Boil process, but still well within acceptable parameters.
Finally, if I really want to do a “deep dive” into the data, I can easily export to Excel which is a familiar tool and I can view the raw data directly, create my own charts and reports for doing additional analysis:
Some additional “Tips and Tricks” for data collection. If we were a real brewery, it would be a very good idea to assign a batch number to this batch, and log that value to Historian as well. Then, the next time I brewed the type of beer “Citra Tripel”, I could go back and compare my latest batch to the previous batch. If my beer taster(s) note anything extraordinary about a particular batch, we can then analyze what happened, and then update our recipe in order to replicate that improvement in future batches, or just compare how we did. Also, using the trend tool, we can pull up data from both batches simultaneously using the “time offset” feature, allowing a nice detailed visual comparison by overlaying both batches within the same trend.
I hope you enjoyed this article. This really just scratches the surface for what automated data collection can do for process improvement. In a future article, I will discuss additional techniques for capturing downtime data and analyzing causes. In addition, I will talk about how we can leverage the data collection system to notify our process team when an event is occurring, instead of analyzing what happened “after the fact”.
자동화 제어 시스템
글로벌 무역 정책은 전 세계 여러 지역의 고객에게 영향을 미칩니다. 이는 고객 수요를 방해하고 공급망 기능을 저하시키며 생산 비용을 증가시킬 수 있습니다. 이러한 장애물을 상쇄하고 북미 고객에게 보다 수직으로 통합된 솔루션을 제공하기 위해 Impro의 고정밀 가공 및 주조 작업은 멕시코 지역으로 확장되고 있습니다. 당사의 정밀 가공 작업은 현재 시설에서 남쪽으로 불과 18km, 산 루이스 포토시 국제공항에서 남쪽으로 45km 떨어진 WTCII 산업 단지의 새로운 위치에서 시작됩니다. Impro의 멕시코 제조 능력 2,053,7
뛰어난 반응성 Sure Controls에서 우리는 우리가 할 수 있는 모든 방법으로 회사 모토를 실천하게 된 것을 매우 자랑스럽게 생각합니다. 우리의 모토는 미소를 얻으려면 미소를 지어라입니다. 직장에서만이 아니라 벽에 걸려 있고 우리 마음 속에 간직되어 있습니다. 지난 몇 주 동안 COVID -19는 전 세계를 휩쓸었고 모든 사람의 삶에 영향을 미쳤습니다. 여기 위스콘신에서는 이 팬데믹의 최전선에 있는 용감한 남녀를 돕기 위한 개인 보호 장비에 대한 요청이 있었습니다. Sure Controls 팀이 매년 크리스마스를 보내는 것처