작은 희토류 불화물 나노입자는 전기적 극성 상호작용을 통해 종양 세포 성장을 활성화합니다.
초록
나노입자와 막횡단 신호 수용체 사이의 국소화된 세포외 상호작용은 암세포 성장을 잘 활성화시킬 수 있습니다. 여기에서 작은 LaF3 및 PrF3 DMEM+FBS 현탁액의 나노입자는 3가지 다른 인간 세포주(A549, SW837 및 MCF7)에서 종양 세포 성장을 자극했습니다. 나노입자의 크기 분포, AKT 및 ERK 신호전달 경로의 활성화 및 생존력 테스트는 작은 크기의 나노입자(<10nm) 앙상블의 상승 작용을 통해 인테그린과 EGFR의 리간드 접착 결합 부위의 기계적 자극을 지적했습니다. 작은 크기의 나노입자가 EGFR의 활성화와 잘 연관될 수 있지만 나노입자와의 인테그린 상호작용은 다면적인 문제로 남아 있습니다. 이론적 모티프는 필요한 pN 힘 규모 내에서 각 리간드 접착 결합 부위가 전기적 쌍극자 상호작용을 통해 작은 크기의 유전체 나노입자에 의해 활성화될 수 있음을 보여줍니다. 남아있는 활성 나노입자의 크기는 리간드 접착 결합 부위와 나노입자의 표면 전하량과 이들 사이의 분리 거리에 의해 지정됩니다. 전기 쌍극자 힘의 극성 구성 요소는 나노 입자 크기의 2승에 반비례하여 유지되어 작은 크기의 유전체 나노 입자만이 전기 쌍극자 상호 작용을 통해 암세포 성장을 자극할 수 있음을 보여줍니다. 이 작업은 암세포의 다양한 세포골격 스트레스 모드를 인식하는 데 기여합니다.
<섹션 데이터-제목="배경">
배경
종양 형성은 게놈 변화와 관련된 다차원적인 문제입니다. 그것은 또한 게놈 프로그래밍을 변경할 수 있는 다중 부분 세포력으로부터 인테그린과 유사한 메카노센서의 스트레스를 통해 발현되는 스캐폴드와 세포골격 구조 사이의 세포-세포외 기질(ECM) 상호작용에 의해 활성화됩니다[5]. 종양 미세 환경과 ECM 지지체의 상호 작용은 일반적으로 세포의 막 초점 접착 단백질 및 막횡단 신호 수용체(TSR), 표피 성장 인자 수용체(EGFR), 혈관 내피 성장 인자(VEGFR) 또는 신경 성장 인자 수용체(NGFR)를 활성화합니다. 기계 센서는 인산화 반응의 눈사태를 촉발함으로써 세포의 세포외 활성 도메인[6,7,8,9]과 세포내 F-액틴 필라멘트 사이의 신호 교환을 통해 종양 세포 성장을 조절합니다.
TSR 경로의 단백질 형태 변화와 여기는 활성화력이 pN 힘 범위에 있어야 하며 확실히 nN 게이지 아래에 있어야 합니다[10]. 무작위 기계적 스트레스 및 활성 화학적 친화력 강도 외에도 나노입자(NP)와 세포막 단백질 사이의 결합 효율(결합 강도)은 단거리 또는 장거리 전기 극성 또는 기타 유형의 분산 상호작용을 통해 조절될 수 있습니다. 나노입자의 제한된 표면적에서는 특정 수의 단백질만이 생물학적으로 활성이 될 만큼 충분히 오랫동안 부착될 수 있으며[11], 생물학적 환경과 공간적으로 제한된 국부적 상호작용은 일련의 다양한 세포 기능에 대한 책임이 있는 것으로 인식되었습니다. 경로 [12]. 결과적으로, 단백질-NP 상호작용의 신호 전달 경로는 NP에 대한 안전성 문제를 신호하고 있습니다[11, 13].
NP의 세포에서 호의적이거나 부정적인 반응이 유형 특이적이므로[11], NP와 생물학적 표지 사이의 연관성은 사례별로 확립되어야 합니다[14, 15].
NP에 노출된 종양 세포의 상반된 결과(절제 또는 종양 성장 효율성 또는 NP의 가변 독성 수준[16, 17])도 안전성 문제를 표면화하고 있습니다. 그럼에도 불구하고, 진보에도 불구하고 오늘날에는 NP가 진핵 세포와 상호 작용하는 특정 경로에 대한 지식이 부족하여 보편적인 NP 치료 접근법의 식별을 배제합니다. 크기가 다른 NP와 다양한 표면 화학은 일반적으로 NP-막 수용체 결합 및 TSR 활성을 포함한 세포 반응을 전환하기 때문에 NP의 독성은 계면활성제의 형태, 전하 상태, ECM의 단백질 및 나노 물질의 농도 및 구성과 관련이 있습니다. [18,19,20,21] 그리고 마지막으로 NP와 세포 표현형 사이의 분자 결합 강도 [22].
실리카, 금 나노입자 및 탄소 나노튜브에 노출된 흑색종 및 자궁경부 암종에 대한 이전 연구에서는 나노입자 크기가 종양 세포 성장을 선택적으로 활성화한다는 것을 인식했습니다[23,24,25,26,27]. 인간 SK-BR-3 암세포주에서 TSR 신호와 변형된 금 및 은 나노입자의 크기 사이의 상관관계는 2-100 nm 크기의 나노입자가 신호 전달을 재형성했지만 세포가 –50 nm 크기의 NP[26]. 최근에는 금 나노입자의 크기를 5nm에서 40nm로 변경하면 A549 및 95D 암 세포주의 성장률이 조정될 수 있다고 제안하기도 했습니다. 구체적으로, 5nm 크기의 NP는 두 세포 유형의 증식을 억제한 반면 ~ 10nm 크기의 NP는 세포 성장에 영향을 미치지 않았습니다[27]. 마찬가지로, SiO2에 노출된 A549 및 THP-1 세포 NP는 크기 의존적 세포독성을 보였을 뿐만 아니라 15 nm 크기의 NP도 높은 세포독성 수준과 상관관계가 있었다. 반대로 60 nm 크기의 나노입자는 독성이 더 낮았다. 마지막으로, 200 nm 크기의 나노입자는 ERK1/2 활성화를 통해 줄기세포 성장을 증가시킨 반면, 2-4 μm 크기의 나노입자는 다른 신호 전달 경로를 활성화할 수 있었습니다[28]. 작은 크기의 NP는 EGFR을 결합하고 세포 성장을 자극하는 단백질 키나제 B(AKT) 및 세포외 신호 조절 키나제(ERK) 신호 전달 경로를 켭니다.
희토류 나노입자(RE-NPs)는 또한 금속 이온 의존성 접착 부위(MIDAS), MIDAS에 대한 조정(ADMIDAS), 상승적 금속 이온 결합 부위(SyMBS) 및 리간드 접착 결합 부위(LABS)와 같은 특정 도메인과 상호 작용할 수 있습니다. , αν에 위치 β3 소단위 또는 기타 인테그린 소단위 [29, 30].
마찬가지로, RE-NP는 종양 NP 상호작용에서 추가적인 유연성을 수반합니다[31,32,33,34]. 세리아 나노입자(나노세리아)는 다양한 라디칼에 의한 세포 손상에 대한 보호 작용을 나타냈지만[35], 변형된 세리아 나노입자의 낮은 농도 수준은 AKT/ERK 신호 전달 경로의 활성화를 통해 세포자멸사를 감소시켜 간암 세포 증식을 크게 증가시켰습니다[36]. 일반적으로 세포를 둘러싸고 있는 NP의 앙상블은 세포골격 스트레스에 취약하고 화학적, 나노 열역학(Hill)[37], 엔트로피 또는 NP와 기계 센서 사이의 전기적 쌍극자 상호 작용을 동일하게 견뎌냅니다. 그러나 지금까지 NP, TSR 및 세포 간의 상호 작용에 대한 이해의 대소문자는 모호하고 사용할 수 없습니다.
원칙적으로 RE 화합물의 강한 이온 특성은 전기적 상호작용을 통해 세포의 메카노센서를 자극해야 합니다. 또한 RE 이온은 다양한 응용 분야에서 널리 사용되기 때문에 적절한 공중 보건 보호 프로토콜을 암시하기 위해 종양 세포 성장에 대한 잠재적 기여를 조사하는 것이 중요합니다. 불화란탄(LaF3 ) 및 프라세오디뮴 플루오라이드(PrF3 )은 형광등, 방사선 색안경, 광섬유, 에나멜 응용 분야 및 전극에 사용됩니다. LaF3 특정 유형의 유리, 인광체 램프 코팅, 수처리 및 촉매에 대해 자세히 설명되어 있습니다. 또한 상업용 불화물 유리(ZBLAN)의 필수 구성 요소로, 유로퓸 플루오라이드와 혼합되어 적외선 투과율이 좋은 이온 선택성 불화물 전극의 결정막과 광통신용으로 사용됩니다. 마찬가지로, PrF3 영화 산업의 탄소 아크 조명, 스튜디오 조명 및 프로젝터 조명에도 사용됩니다. 프라세오디뮴이 도핑된 불소 유리는 단일 모드 광섬유 증폭기에도 사용됩니다.
따라서 이 연구는 작은 크기의 RE-NP가 전기적 쌍극자 상호작용을 통해 종양 세포 성장을 자극하는 효능이 있음을 보여줍니다.
기사는 세 부분으로 구성되어 있습니다. 먼저 동적 광산란(DLS), 원자간력현미경(AFM), 투과전자현미경(TEM), X선 회절(XRD), 2차원 고속을 적용하여 NP의 크기 분포, 상호 작용 및 기하학을 분석합니다. 푸리에 변환(2D-FFT) 분석 및 진공 자외선 분광법(VUV 110–180 nm). 다음으로, 크기 분포와 LaF3의 농도에 따른 3가지 다른 인간 암 세포주(A549, SW837 및 MCF7)의 성장 수준 간의 상관 관계 및 PrF3 NP가 설정됩니다. 마지막으로, 메카노센서를 활성화하고 후속적으로 종양 세포 성장을 위한 1pN의 필수 힘 한계 내에서 종양 세포의 생존 능력은 하나의 RE-NP와 하나의 LABS 사이의 전기적 쌍극자 상호작용의 이론적 모티프 내에 적합합니다. 이 작업은 다양한 유형의 세포골격 스트레스 및 NP와 암세포의 기계감각 간의 상호작용을 식별하고 분류하는 데 기여합니다.
<섹션 데이터-제목="결과">
결과
NP의 크기 및 구조
첫째, DLS, AFM, TEM, XRD, FFT, VUV 분광법 및 t 액체 현탁액에서 RE-NP의 크기 분포를 추출하기 위해 테스트 통계가 적용되었습니다(그림 1, 2, 3, 4, 5, 6 및 7). 다음으로, 세포의 생존력 테스트와 웨스턴 블롯팅(Wb) 분석을 사용하여 RE-NP에 의한 특정 메카노센서의 활성화를 확인했습니다.
<그림>
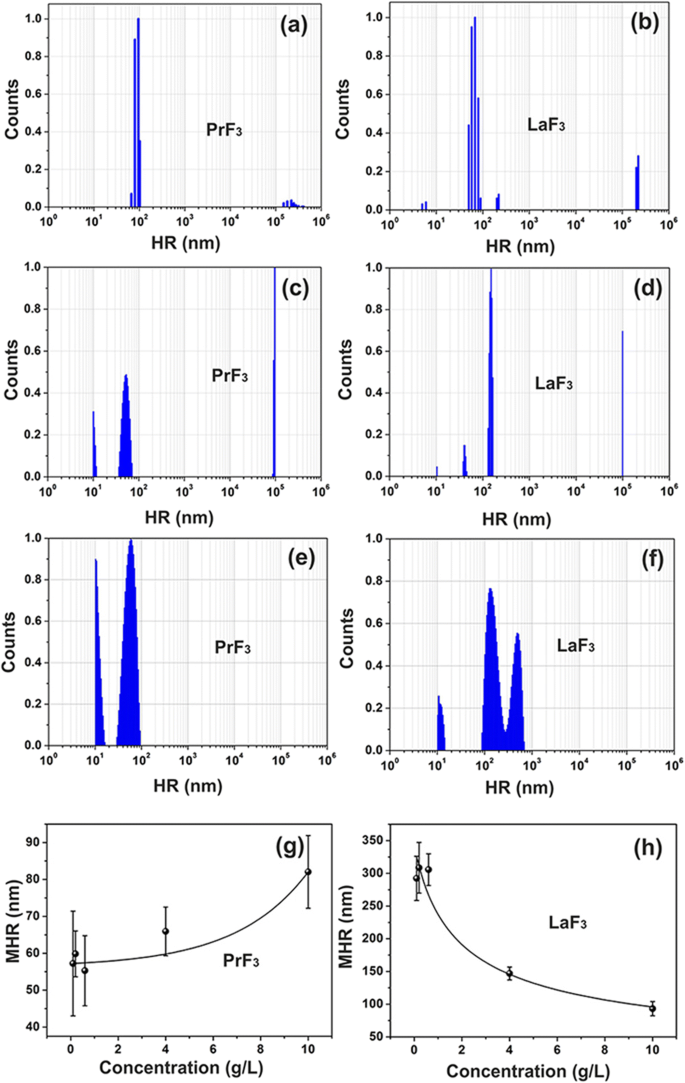
RE 현탁액의 DLS 크기 분포 스펙트럼. 아, 나 PrF3 및 LaF3 물에서 NP(5g/L). c, d PrF3 및 LaF3 DMEM+FBS의 NP(5g/L). , f PrF3 및 LaF3 DMEM+FBS의 NP(0.1g/L). 그, h 표준편차가 PrF3인 평균 유체역학적 반경(MHR) 및 LaF3 다른 농도 수준에서 DMEM+FBS의 NPs
<그림>
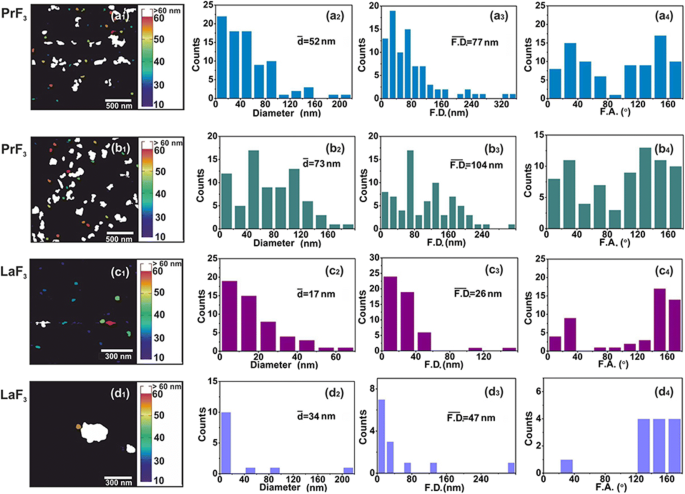
AFM 디지털(x , y ) RE-NP의 크기 히스토그램. (a1–d1 ) PrF3 (2 × 2μm
2
) 및 LaF3 (1 × 1μm
2
) DMEM+FBS 현탁액의 NP. (a2–d2 ) (x , y ) RE-NP의 평균 동일 원 면적 직경 \( \left(\overline{d}\right) \)의 크기 히스토그램. (a3–d3) (x , y ) RE-NP의 페렛 면적 지름 \( \left(\overline{\ F.D.}\right) \)의 크기 막대 그래프. (a4–d4 ) x에 대한 페렛 각(F.A.) 히스토그램 -중심선. RE-NP는 ±(44–60°)
사이의 두 가지 주요 방향을 따라 배향되었습니다. <그림>
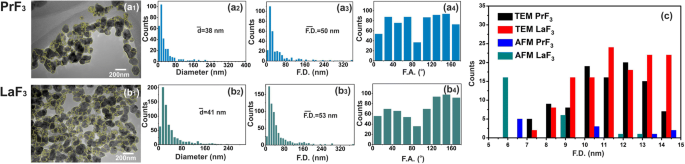
TEM 디지털(x , y ) RE-NP의 크기 히스토그램. (a1, b1 ) RE-NP의 TEM 이미지. 노란색 선은 RE-NP 사이의 2D 경계를 나타냅니다. (a2, b2 ) (x , y ) RE-NP의 평균 동일 원 면적 직경 \( \left(\overline{d}\right) \)의 크기 히스토그램. (a3, b3 ) (x , y ) RE-NP의 페렛 면적 지름 \( \left(\overline{\ F.D.}\right) \)의 크기 막대 그래프. (a4, b4 ) x에 대한 페렛 각(F.A.) 히스토그램 - ±(44–60°)에서 우선적인 방향을 가진 축. (ㄷ ) 4μm
2
에 대한 AFM 및 TEM 이미지 모두에서 추출한 작고 작은 크기의 RE-NP의 페렛 직경의 크기 히스토그램 지역
<그림>
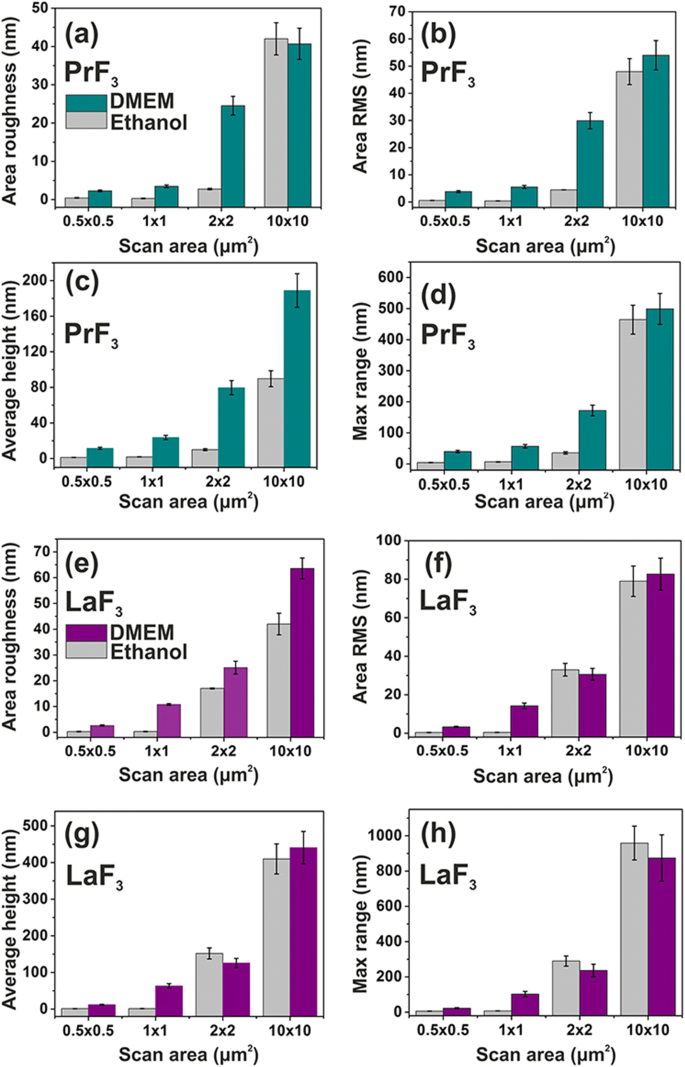
PrF3의 표면 매개변수 히스토그램(z 높이) 및 LaF3 DMEM+FBS의 유리 기판에 있는 RE-NP와 다양한 스캔 영역에 대한 에탄올. 아 , e 면적 거칠기. ㄴ , f 영역 RMS. ㄷ , 지 평균 키. d , h최대 z -범위
<그림>
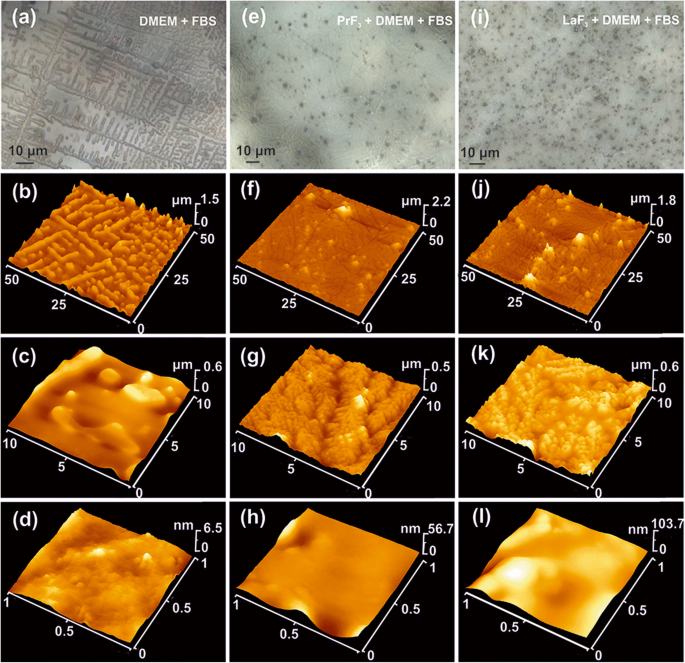
DMEM+FBS에서 건조된 RE-NP의 AFM 및 광학 이미지. 아 –d 광학(a ) 및 AFM 이미지(b –d ) 5 μm 자가 조립 구조를 나타내는 DMEM+FBS. 이 –h CCD(e ) 및 AFM 이미지(f –h ) PrF3 500 nm 수상돌기 자가 조립 구조를 나타내는 DMEM+FBS 매체의 NP. 나 –나 CCD(i ) 및 다른 배율의 AFM 이미지(j –나 )의 LaF3 100 nm 수상돌기 자가 조립 구조를 나타내는 DMEM+FBS의 NP
<그림>
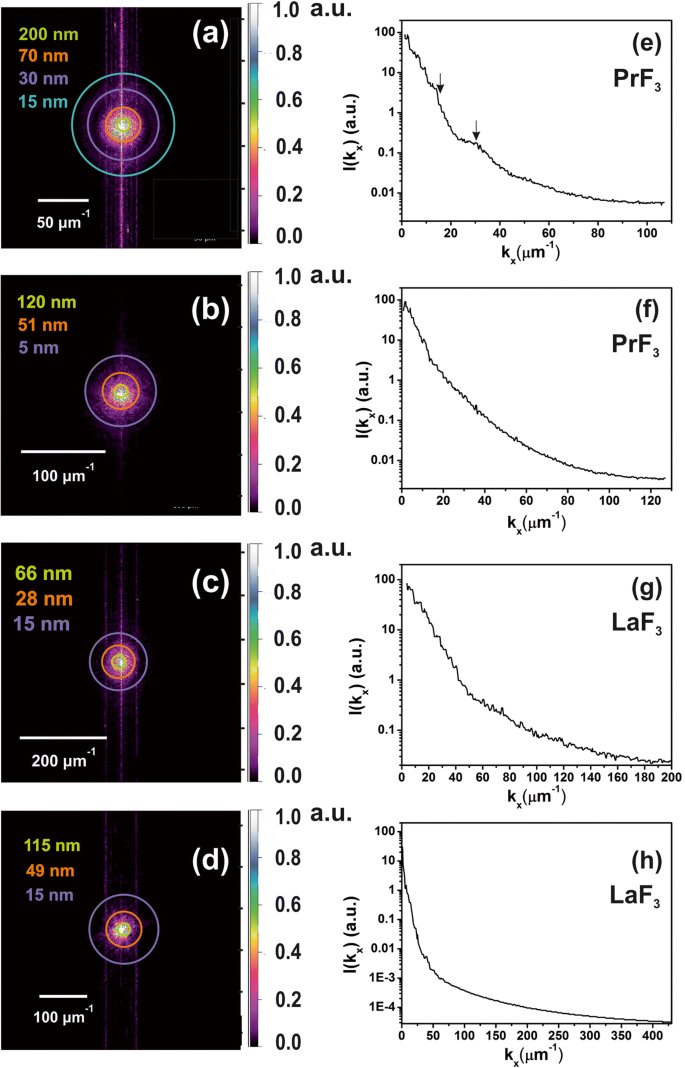
z의 2D-FFT 스펙트럼 - 액체 현탁액에 작은 크기의 NP가 존재함을 나타내는 DMEM+FBS 배지에서 건조된 RE-NP의 높이 분포. 아 , b PrF3의 z 높이 분포 AFM 이미지의 NP, 그림 2(a1, b1). 작은 z -높이 특징(~ 5 nm)은 (b에서 식별되었습니다. ). ㄷ , d LaF3의 z 높이 분포 AFM 이미지의 NP, 그림 2(c1, d1). 이 , fz의 전력 스펙트럼 -PrF3의 높이 파동 벡터 x에 따른 NP -중심선. 지 , hz의 전력 스펙트럼 -LaF3의 높이 파동 벡터 x에 따른 NP -축
<그림>
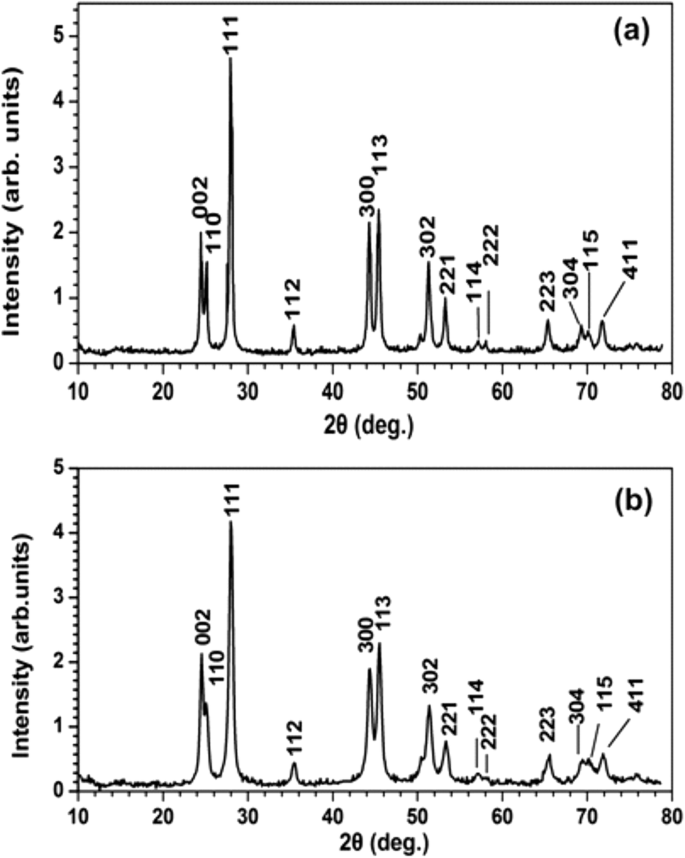
a의 XRD 스펙트럼 PrF3 그리고 b LaF3 NP. PrF3의 평균 표면적 직경 및 LaF3 NP는 각각 ~ 23 ± 4 및 ~ 15 ± 4 nm였습니다.
DLS
흐린 이종 혼합물은 처음에 세포 배양 배지에 RE-NP를 추가하여 형성되었으며, 이는 액체 현탁액에서 RE-NP 간의 상호 작용의 복잡성을 보여줍니다. PrF3에 대해 RE-NP의 작은(<10 nm), 작은(> 10 및 <20 nm) 및 큰(> 20 nm) 구조가 확인되었습니다. 및 LaF3 용해성(그림 1a-d).
대형 RE-NP(PrF3의 경우 55–83 nm)의 평균 유체역학적 반경(MHR) 값 LaF3의 경우 99–296 nm )는 NP의 농도 수준(0.1–10 kg m
-3
)에 직접 및 반비례하여 추적되었습니다. ) 액체 Dulbecco의 변형된 Eagle's with fetal bovine serum(DMEM+FBS), 그림 1g, h. 또한 소형 LaF3의 MHR 및 PrF3 NP는 RE-NP의 다른 농도 수준에서 각각 10.66 ± 0.74 nm 및 10.64 ± 0.40 nm로 일정하게 유지되었습니다. RE-NP의 MHR은 최소 6일 동안 변하지 않았습니다. RE-NPs 현탁액을 건조시킨 후, 강한 상호작용에 의해 안정화된 큰 크기의 덩어리가 침전을 일으키기 때문에 RE 분말을 다시 재용해하는 것은 불가능했습니다.
RE-NP의 AFM 및 TEM 이미징 및 표면 분석
0.1kg m
−3
에서 DMEM+FBS에서 작은 크기의 RE-NP에 대한 신뢰할 수 있는 크기 분포 및 통계 AFM(스캔 영역 1 × 1 및 2 × 2 μm
2
) 및 TEM 이미징도 적용되었습니다(그림 2(a1-d1) 및 그림 3(a1, b1)). DMEM+FBS의 RE-NPs의 액적을 유리 기판으로 옮긴 후, NP의 평균 크기와 평균 Ferret 직경 모두에서 비교적 많은 수의 응집되지 않은 작은 RE-NP가 확인되었습니다[38]. 그림 2(a2-d2, a3-d3) 및 그림 3(a2, b2, a3, b3)). 또한 AFM 및 TEM 페렛 직경(NP의 더 큰 치수에 대한) 각도 분포의 히스토그램은 두 RE-NP가 ±(44–62
o
), x에 상대적 -축(그림 2(a4-d4) 및 그림 3(a4, b4)).
그럼에도 불구하고 z -NP의 높이 분포는 전체 NP 크기 분포에 대한 직접적인 정보를 제공하지 않았으며, (x)의 첫 번째 추정을 위한 편리한 비교 도구입니다. , y ) z-높이 및 (x , y ) 분포는 상호 관련성을 유지합니다[38].
두 PrF3의 평균 표면 매개변수 및 LaF3 다른 AFM 스캔 영역에 대한 건조 현탁액도 그림 4에 나와 있습니다. 작은 z -높이 값은 매우 균일한 z를 나타냄 -작은 1 × 1 μm
2
에 대한 두 RE-NP의 높이 분포 스캔 영역. 반대로 RE-NP와 더 큰 스캔 영역 모두에 대해 z - 높이 분포가 훨씬 더 넓어졌습니다. 낮은 z - 작은 스캔 영역의 높이 분포 값은 액체 현탁액에 작은 크기의 RE-NP가 존재함을 반영합니다. DMEM+FBS 배지의 표면 매개변수 값은 평균적으로 에탄올보다 크며, 단백질과 RE-NP 사이의 복잡한 반응성 상태를 나타내며, 이는 도 5의 다면적 구조 및 2D-FFT 데이터와 일치한다(도 6). ). 전체적으로 LaF3 NP는 건조 현탁액에서 흥미로운 반응을 보였고 PrF3보다 더 광범위한 표면 거칠기 매개변수를 나타냈습니다. NP.
FFT
2D-FFT 스펙트럼에서 선택한 반경에 유색 링이 추가되었습니다(그림 6a-d). 주기는 픽셀 크기(1.9–3.9 nm)와 같은 작은 크기에서 ~ 2 μm의 상당한 크기까지 유클리드 공간에서 서로 다른 NP 크기 분포를 나타냅니다. 이는 z -축(그림 6e-h). z - AFM 팁의 반경이 있는 높이 값은 z에서 실제 분해능을 제공합니다. - ~ 5 nm의 높이 분포. 2D-FFT 스펙트럼은 평균 z - ~ 44 nm의 RE-NP 높이. FFT 패턴은 2D-FFT 스펙트럼에서 확인된 다분산된 넓은 작은 크기 구조로 인해 점진적으로 번지는 후광 구조를 나타냅니다. 두 2D-FFT 스펙트럼 모두에 대해 회절 패턴 없이 후광만 스펙트럼에 나타났기 때문에 규칙적인 자체 조립 구조가 누락되었습니다. PrF3의 고리 모양의 2D-FFT 패턴에서 얻은 특성 상관 길이 및 LaF3 DLS 스펙트럼에서 추출한 MHR 값과 일치하여 각각 ~ 51, 70 nm 및 28, 49 nm였습니다.
XRD
XRD 분광법은 결정 구조를 특성화하고 PrF3 크기에 대한 보완 정보를 제공했습니다. 및 LaF3 NP(그림 7). 두 RE-NP의 표준 육각형 상 구조에 해당하는 날카로운 회절 피크는 응집상의 높은 결정 상태를 나타냅니다. Scherrer 공식(\( \tau =\frac{0.9\lambda }{\beta \cos \left(\theta \right)}\Big) \)을 사용하면 평균 평균 동일 면적 원 지름(MEAC) τ PrF3 및 LaF3 NP는 각각 ~ 23 ± 4 및 ~ 15 ± 4 nm로 추정되었습니다.
VUV 분광기
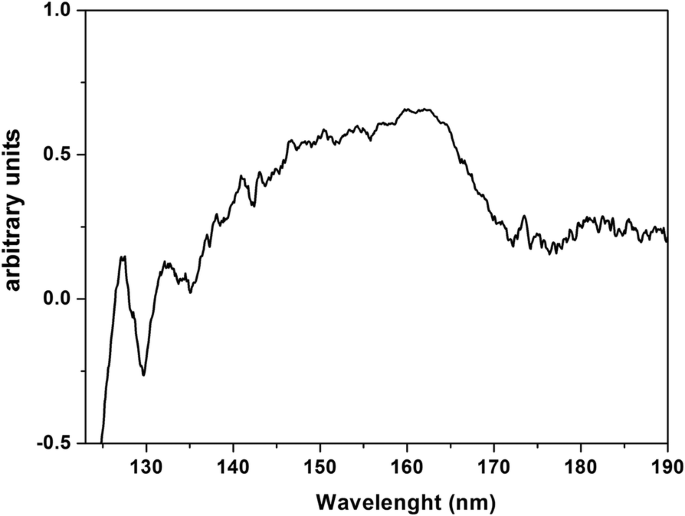
흡습성 PrF3의 VUV 투과 스펙트럼 CaF2에 증착된 NP 층 125 nm(~ 10 eV)에서 190 nm(~ 6.5 eV)로의 기판이 그림 8에 나와 있습니다. VUV 피크는 이전에 Pr
3+
의 전이에 기인한 140–170 nm에서 피크 지상의 3가 이온 4f4f5d의 Stark 구성 요소에 대한 전자 상태 구성 YF3 내부의 전자 구성 , LaF3 , KY3 F10 및 LiLuF4 단결정 매트릭스는 물 VUV 흡수 밴드와 중첩되어 PrF3에서 결합된 물 분자의 존재를 나타냅니다. 및 LaF3 수정.
<그림>
PrF3의 VUV 투과 스펙트럼 건조된 CaF2에 침착된 물 현탁액의 NP 기질. 스펙트럼은 PrF3 내에서 수분 부착 및 트래핑을 나타냅니다. NP
생존력 테스트
RE-NP의 크기 분포 분석 및 통계에 이어, PrF3의 독성을 모니터링하기 위해 수용성 테트라졸륨염(WST) 생존력 테스트가 사용되었습니다. 및 LaF3 폐암에서 유래한 A549, 결장암에서 유래한 SW837, 유방암에서 유래한 MCF7의 3가지 인간 암 세포주에 대한 NP. DMEM+FBS(A549, SW837) 및 Roswell Park Memorial Institute 배지와 Fetal Bovin Serum(RPMI+FBS)(MCF7)에 3가지 농도의 RE-NPs 현탁액(0.5, 1 및 5mM)을 사용했습니다. 세포주는 처음에 96-웰 플레이트에 놓고 밤새 부착되도록 두었다. 세포 성장의 선형 영역 내에 있고 포화를 피하기 위해(그림 9a) 하루 후 PrF3를 포함하는 새로운 배지 및 LaF3 현탁액이 추가되었고 생존력 테스트는 RE-NP를 추가한 후 24시간 및 48시간 후 또는 세포 도금의 초기 순간 이후 48시간 및 72시간 후에 수행되었습니다. 그러나 세 가지 농도 및 세 가지 배양 세포주에 대해 배지를 교체하지 않고 추가 RE-NP를 배양물에 첨가하지 않은 경우 과성장 차이가 감지되었으며, 이는 실험의 초기 조건을 변경하는 관행입니다. 또한 ~ 5 × 10
4
미만의 세포 농도를 도금하는 것은 불가능했습니다. 3개의 세포주에 대한 합류가 측정 가능한 세포 성장을 보장하기에는 너무 작았기 때문입니다. 최적의 실험 설정은 ~ 5 × 10
4
에 대해 설정되었습니다. 웰당 세포 수.
<그림>
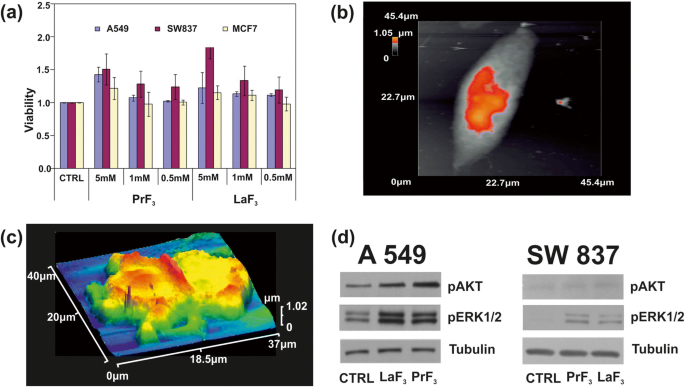
아 서로 다른 농도의 PrF3로 처리된 3개의 서로 다른 암세포주(A549, SW837, MCF7)의 WST 생존력 분석 히스토그램 및 LaF3 생물학적 매체의 NP. ㄴ 단일 A549 암세포의 AFM 이미지. ㄷ DMEM+FMS의 RE-NPs에서 분할된 A549 암세포의 AFM 이미지. d AKT 및 ERK 경로가 있는 A549, SW837 세포의 Wb 인산화 분석
더 높은 농도(5mM)에서 두 RE 현탁액 모두에 대해 모든 세포주에 대해 상승하는 성장이 얻어졌습니다(그림 9b, c). 그 중 SW837 라인이 가장 높은 성장 값을 보였다(86%, LaF3 ). 덜 뚜렷하지만 여전히 관련성이 있는, 5mM에서 MCF7 세포주에 대해 세포 과증식(15%)이 관찰되었습니다. 그 테스트 통계 분석(p 그리고 피셔 F 값) 종양 세포 생존율은 종양 세포의 성장이 24시간에 불포화됨을 보여주었다; RE-NPs의 생존 가능성과 농도를 연결하는 알려지지 않은 물리적 법칙을 따랐습니다(추가 파일 1).
인산화 분석
두 단백질의 인산화 상태도 테스트했습니다(그림 9d). A549 및 SW837 세포주에서 특이적 항체 및 Wb 분석을 사용하여 5mM의 LaF3와 함께 DMEM+FBS에서 성장했습니다. 및 PrF3 24시간 동안 NP, 대조군 세포(CTRL)에 비해 처리된 세포에서 ERK1/2 및 AKT의 높은 인산화 활성이 얻어졌습니다.
토론
암세포의 상대 성장률은 두 RE-NP의 더 높은 농도 수준에서 상승했습니다(그림 9a). 그러나 DMEM+FBS에서 RE-NP의 MHR 값은 직접 추적되었습니다(PrF3 ) 및 반비례(LaF3 ) 0.1–10 kg m
−3
의 RE-NP 농도까지 (그림 1g, h). 따라서 평균 크기가 ~ 55 nm 이상인 RE-NP는 세포 성장에 영향을 미치지 않아야 하며 작은 크기의 NP만 종양 성장에 실제 역할을 할 수 있습니다.
RE-NP의 크기 및 구조
작은 RE-NP 식별
실험 데이터에서 RE-NP의 평균 크기, 분포 및 통계적 매개변수를 추출했습니다. t를 적용하여 건조된 PrF3에서 NP의 "평균 동일 면적 원"의 "무효 가설"에 대한 테스트 통계 및 DMEM+FBS 정지, p 무작위로 선택한 두 AFM 이미지 사이의 NP 직경 값은 ~ 0.001(추가 파일 2)입니다. MEAC 직경(63 nm) 값은 AFM 데이터에서 확실하게 추출되었으며 이는 DLS 데이터의 MHR 값과 비슷했습니다(그림 1g).
반대로 무작위로 선택된 LaF3에서 MEAC 직경의 값은 샘플은 더 높은 거부 확률 값(p)과 함께 26nm의 평균 MEAC 직경을 보여주었습니다. =0.07), LaF3의 발산 동작을 나타냅니다. 액체 현탁액에서. MEAC 직경과 DLS(296 nm)의 MHR(그림 1) 사이의 불일치는 LaF3의 상호 작용의 복잡성 때문입니다. 다시 정지. 실제로 2 × 2 μm
2
의 경우 AFM 팁 스캐닝 영역, 평균 z -높이는 ~ 140 nm였으며, 큰 크기의 LaF3의 존재를 나타냅니다. NP는 기판의 액체 현탁액에서 옮겨집니다(그림 4). "무작위로 선택된 TEM 샘플의 동일한 MEAC 직경 값"의 "영무 가설"의 경우, p 값도 작았습니다(p =0.001). 두 RE-NP의 경우 PrF3에 대해 결합된 TEM 및 XRD 데이터에서 추출된 평균 MEAC 직경 값 및 LaF3 높은 p 표시 값, p =0.29 및 0.06, 따라서 TEM과 XRD 데이터 사이의 상관 관계를 허용하지 않습니다. TEM, AFM만(PrF3 ) 및 DLS 데이터는 MEAC 직경 및 코어-쉘 값을 추출하기에 충분히 신뢰할 수 있었습니다(추가 파일 2).
또한 Feret 직경의 비등방성 각도 분포는 두 PrF3 및 LaF3 이방성 각도 분포가 나노결정 사이의 강한 전기적 극성 상호작용을 나타내기 때문에 구조는 고도로 극성화된 유전체였다. LaF3의 다양한 편광 상태 현탁액에서 응집 상태의 상대적 효율성을 축소하고 건조 샘플에서 표면 거칠기 매개변수를 확대하는 역할을 했습니다.
5μL 및 농도 0.1kg m
−3
에 대한 무작위 AFM 이미지의 소프트웨어 입자 분석 15 nm 및 10 nm보다 작은 크기의 ~ 22 및 ~ 11 RE-NP를 식별했습니다(p =0.001), TEM 이미지의 ~ 60 RE-NP 수(p =0.001) ~ 4μm
2
의 영역 , 따라서 서스펜션에 작은 크기의 RE-NP가 존재함을 확인합니다(그림 3(c), 추가 파일 2). DLS에서는 감지되지 않습니다.
RE-NP의 구조 및 기하학
RE-NP의 크기 분포는 에탄올과 DMEM+FBS 현탁액에서 다양합니다(그림 4). 다양성은 흡착된 단백질, 탄수화물, 전해질 및 RE-NP의 표면 사이의 서로 다른 분자 상호작용을 소유하여 RE-NP와 세포의 특정 상호작용을 조절하는 고도로 복잡한 유기 망토(코로나)의 형성을 초래합니다. DMEM+FBS 배지.
흡습성 RE-NPs와 DMEM+FBS에 갇힌 물 분자 사이의 상호작용도 코어-쉘 형성에 중요했습니다. 또한 준비 초기 단계에서 단백질과 중간 상호작용의 구조적 변화에 중대한 영향을 미쳤습니다. NPs의 표면 대 부피 비율이 현탁액에서 높은 값을 나타내면서 단백질을 흡수하는 능력을 포함하여 RE-NPs의 효과적인 안정성과 물리화학적, 기계적 및 흐름 특성이 매우 다양했습니다[39,40,41] .
AFM 및 TEM을 통한 액체(DLS)의 RE-NP 및 응고된 현탁액의 비교 크기 분포는 RE-NP가 RE-코어를 둘러싸는 단백질 쉘인 코어-쉘 유전체 구조를 형성하는 유기 형태 내부에 캡슐화되었음을 보여주었습니다. 유리 기판에 증착된 DMEM+FBS 현탁액의 응고된 RE-NP에서 이미지화된 AFM은 또한 다면적 RE-NP 및 단백질 코로나 복합체의 형성을 나타냅니다(그림 5). 건조된 매체가 결정 구조의 규칙적인 자기 조립 패턴을 형성하는 동안(그림 5a-d), 건조된 RE-NPs 현탁액은 AFM의 디지털 카메라로도 볼 수 있는 몇 개의 검은 반점이 있는 비정질 층 구조를 나타냈습니다(그림 5e-l). . 더 높은 광학 배율에서 배지 단독보다 작은 구형 모양의 개별 덩어리가 DMEM + FBS의 두 RE-NP와 수상 돌기 유형 구조에 대해 모두 감지되었습니다. 둘 다 상호 작용의 복잡성을 보여줍니다. 표면 매개변수 결과(그림 4). 가장 높은 AFM 분해능(1 × 1 μm
2
영역), 그림 5의 마지막 레인에서 분리된 RE-NP 응집체는 ~ 5 nm의 분해능 한계 내에서 두 RE-NP에 대한 건조 구조에서 확인되지 않았습니다. 광학 이미지에서 볼 수 있는 1-2 μm 길이의 검은색 구형 균사체는 코어-쉘 RE-NP의 큰 덩어리 덩어리였습니다. RE-NP와 DMEM+FBS 사이의 복잡한 반응은 순수한 DMEM+FBS에서 장기간 자가 조립된 긴 구조가 수상돌기 구조로 변형되는 것을 통해 시각화되었습니다.
결과는 단백질 껍질 내부에 캡슐화된 단일 RE-NP 코어 구조의 그림을 가리킵니다. 이러한 구조는 RE-NP와 교차 반응하는 유기물과 전해질로 둘러싸여 있기 때문에 감지할 수 없었습니다. PrF3의 VUV 스펙트럼 140에서 170nm 사이의 일부 스펙트럼 피크를 보여줍니다(그림 8). 이온 전이는 최대 168nm에서 4f6s의 스펙트럼 서명만 최대의 전자 구성 132 및 127 nm에서 스펙트럼에 존재했습니다. However, these bands could evince the presence of water in the high hygroscopic PrF3 suspensions. Water has a rich, structured absorption band in the VUV spectral range centred at 122 nm, revealing the presence of water molecules in the core-shell NPs.
Activation of Mechanosensors
Activation of Integrins by External Forces
The activation of oncogenic pathways by RE-NPs [24], besides the 3D structural nature of TSRs, is based on some Natural Evolution principles for sustaining the viability of cells. First, upon binding a specific external ligand in a LABS, conformational changes along the entire TSR spectrum underline a series of cascading pathways, triggering tumour cell growth (Fig. 9c, d). The transmission of signals advances through the plasma membrane via various protein chains. Signal transduction was via conformational transformations of integrins responding to a high affinity external force (Fig. 10a, b).
Simplified layout of integrin activation by NPs and signal transaction pathways. 아 Structure and conformational geometries of integrins at a low (A), medium (B) and high-affinity strengths (C). ㄴ AKT and ERK1/2 signal transaction pathways activated by RE-NPs via external integrin stimulation
Because of “life sustainability” and “survival laws” that prevents cancer cell growth by random “noise”, it is required that the strength of the external force should be within a bounded range of values and also the external strength stimulus should apply for a long period on a large number of mechanosensors in a cancer cell. The external strength that stimulates cancer must be slightly larger than the strength of the interatomic molecular forces under normal conditions. For a thermal energy of a ligand at room temperature (kT = 0.025 eV, T = 298 K), and for a regular thermal stress of molecular bonds of ~ 0.05 nm, the mean thermal force acting on the LABS stays for 1.2 × 10
−12
N. In principle, a force above ~ 10 × 10
−12
N acting coherently on the whole set of mechanosensors on a cell should activate signal transduction in tumour cells. Consequently, ignoring any thermal and mechanical stressing in the ECM normal conditions, integrin activation via electrical polar interactions between LABS and NPs has the potency to start signal transduction in cancer cells and to initiate tumorigenesis.
Integrin Structure and Geometry
An integrin receptor in the upright conformation state extends ∼ 20 nm upwards from the cell membrane [42] (Fig. 10a). For no contacts between the two α- and β-subunits, other than those in the headpiece near the ligand-binding pocket, the α- and β-subunits are well separated with their cytoplasmic tails extended out up to ∼ 8 nm [42]. A conic projection geometry (20 nm slant height, 5–10 nm diameter of its circular base), bounded by the α- and β-subunits, defines a projected area on the surface of cell’s membrane between ~ 19 and ~ 80 nm
2
, for a typical mean radius of a tumour cell Rㄷ ≈ 5 μm (equivalent surface area of a spherical cell \( {S}_c=4\pi {R}_c^2=3.14\ \mathrm{x}\ {10}^8\ {\mathrm{nm}}^2 \)). By dividing the area Sㄷ of a spherical tumour cell surface with the projected area of an integrin on a cell surface, an upper limit of the number of integrin receptors for these projected areas was nint = 1.6 x 10
7
and 3.9 × 10
6
각기. These numbers are compared with the mean number of integrins on a cell \( {\overline{N}}_{int}\approx 2\ \mathrm{x}\ {10}^5 \) and for an average interspacing of 45 nm between adjacent integrin receptors [43]. Nevertheless, \( {\overline{N}}_{int} \) might be larger because of an uneven surface structure, different separating distances between integrins and variable size of tumour cells (Fig. 9c), but the number of integrins on a cell membrane stand between nint and \( {\overline{N}}_{int} \).
Interaction of Mechanosensors with RE-NPs
ERK ½ and AKT Activation
The TEM images and the elemental mapping of F, La and Pr showed that RE-NPs were unable to penetrate inside the cell. They gathered around the A549 cell membrane (Fig. 11), confirming that an external force can stimulate cell growth because of TSRs activation [44]. The Pr atoms were distributed around the boundaries of the cell’s membrane. The small numbers of F, La and Pr identifications inside the cell were not associated with endocytosis of RE-NPs, but they were images of RE-NPs from the projections of the two cells hemispheres on cell’s equatorial cycle.
TEM images and elemental analysis of RE-NPs at the surface boundaries of A549 cells. 아 TEM image of small size LaF3 NPs surrounding the A549 cells. ㄴ Elemental analysis of F atoms in RE-NPs distributed around the cell. ㄷ Elemental analysis of La atoms. The low concentration of La atoms was associated with a rather small scattering efficiency of the X-rays. d –f The same as for (a –ㄷ ) for PrF3 RE-NPs
It was also evident that both RE-NPs were able to enhance AKT phosphorylation, especially in A549 cells (Fig. 9d), where the steady-state level of AKT pathway activity was higher for the SW837 cell line. The phosphorylation level for the MCF7 cell line was below the detection limit, in agreement with the relatively low levels of growth. High phosphorylation levels of ERK1/2 [36] and AKT were detected in A549 and SW837 cell lines. Cell growth was started once NPs with a proper size interact with the mechanosensors of the cells to provide the correct force for initiating cell growth [45, 46]. ERK and AKT pathways were frequently active in several cancer cell types via extracellular springing, as they were stimulated by the TSRs, upon a selective binding with various mitogenic ligands, or via the activation of the mechanosensory group. The interaction was responsible for a continuous intracellular stimulation that, according to the cell’s phenotype, driven the cancer cells to uncontrolled and endless growth. Viability tests were also run for 48 and 72 h, but the growth of all cell lines was saturated at 48 and 72 h after the initial moment of Cell plating.
Interaction of Cells with Ions
Likewise, as fluoride anions are the most reactive electronegative elements and, the mean radii extension of the unscreened 4f electronic configuration of La and Pr trivalent ions are relatively large, high electric surface charges could be developed via electric dipole interactions [47].
One crucial question stands whether a single ion binding on a specific site can activate tumour cell growth. Because the projected area of the 4f electronic configuration of a single RE ion is S4f = 0.040 and 0.043 nm
2
(for an approximated spherical geometry of the 4f electronic configuration and a 4f mean orbital radii ~ r4f =0.113 and 0.117 nm for Pr and La ions, respectively), a typical upper limit number of single RE ions, or other equivalent size ions, over the whole area of the cell membrane was ~ Sc / S4f = N4f ~7.9 × 10
9
RE ions; a number which is at least two orders of magnitude above the upper limit of the mean number of integrins on a tumour cell. As the relative overgrowth of cells was ascending with rising concentration (Fig. 9a), it is unlikely that tumour cell growth is triggered by a specific binding of single trivalent RE ions [48] on the ligand sites [49,50,51]. Indeed, the large number of RE ions should have saturated the cell’s growth and thus the viability of cells should have remain independent from the concentration of the RE ions.
Interaction of Integrins with RE-NPs
Within the requisite force range of few pN, and for efficient activation of integrins from NPs, the interaction between NPs and LABS should activate a large fraction of integrins of the cell for a long time. In the most extreme favoured case for cell growth, the number of NPs had to remain equal with the number of integrins on the cell’s surface, and the interactive force between LABS and NPs has to be attractive for obtaining a constant (long-term) action. A thin spherical shell of spherical NPs surrounding a tumour cell occupied a volume\( {V}_{sc}\approx 4\uppi {R}_c^2x \), where Rㄷ = 5 μm is the cell radius and x ≈ 20 nm is half the separating distance between adjacent integrin receptors and Vsc ≈ 6.3 x 10
9
nm
3
. For justifying the requirement that each integrin receptor interacts only with one NP, a first estimation of the size of NPs to meet the above requirements for the whole set of integrins on a cell is obtained by dividing the volume of the spherical shell Vsc with the number of integrins. A simple calculation for a cell radius 5 μm shows that the limits of radii of NPs activating the whole set of integrins within the spherical shell volume Vsc ≈ 6.3 x 10
9
nm
3
covering the cell is obtained by divided the volume Vsc with the number of integrins \( {\overline{N}}_{int}\approx 2\ \mathrm{x}\ {10}^5 \) and nint ≈ 1.6 x 10
7
. The volume of the spherical NPs stands for 3.15 × 10
4
and 3.93 × 10
2
nm
3
각기. Therefore, the radii of the NPs interacting with an integrin lay between ~ 20 and 5 nm. Allowing for one order of magnitude variations in the number of integrins \( {\overline{N}}_{int} \), the radii of the NPs interacting with integrins is between ~ 27 and ~ 3 nm respectively.
By also applying similar simple calculations and within the experimental limits of concentration levels of RE-NPs (0.1–10 kg m
−3
), the maximum numbers of PrF3 with MHR 55–83 nm and LaF3 with MHR 296–100 nm NPs (Fig. 1g, h) covering the surface of a tumour cell Vsc stood for 4.1 × 10
4
–2.1 × 10
4
and 17.1 × 10
2
–1.5 × 10
4
NP. These values are placed well below the number of integrins on the cell surface. For rising concentrations of PrF3 and LaF3 from 0.1 and 10 kg m
−3
, the number of PrF3 and LaF3 NPs in the suspensions must go up for either descending or ascending size of NPs. As viabilities of cancer cells are raised at higher concentration levels, it is unlikely that 55–296 nm sized RE-NPs are responsible for cancer cell mitosis under the current experimental configuration.
Also, from the DLS data, the size of both RE-NPs between 10 and 20 nm remained constant (10.6 nm) at different RE concentrations. The number of RE-NPs with this size covering the cell surface is between 3.7 × 10
5
and 1.5 × 10
6
. This number is comparable with the mean number of integrins \( {\overline{N}}_{int}\approx 2\ \mathrm{x}\ {10}^5 \) on a cell surface. Therefore, only small size RE-NPs have the potency to stimulate cancer cell growth by stimulating all the integrins on a cell surface, in agreement with the experimental observations (Figs. 1g, h and 9a).
The number of tiny sizes RE-NPs with MEAC diameter (TEM) from 2 to 10 and 10 to 15 nm on the cell surface (Sㄷ = 314 μm
2
) stands for 1.3 × 10
4
and 1.8 × 10
4
RE-NPs, respectively. Those values stayed one order of magnitude below \( {\overline{N}}_{int}\approx 2\ \mathrm{x}\ {10}^5 \) and therefore tiny size RE-NPs had also the potency to justify the experimental results of rising viability values with concentration (Fig. 9a). Also, the rough surface of tumour cell (Fig. 9c) is able to form cavities, where small size RE-NPs are trapped, triggering thus cell’s mechanosensors. Most important, only tiny size RE-NPs have the potency to activate integrin receptors via electrical dipole interactions (vide infra).
Interaction of EGFR with RE-NPs
An upper limit of small size NPs capable of stimulating cell’s overgrowth via the EGFR was set previously to 14 nm [52], but a realistic size of NPs stimulating the EGFR should be < 5 nm [53] (Fig. 12). The area number density of EGFR on the surface of tumour cells stands for ~ 1.4 × 10
−4
nm
−2
and the total number of EGFR on the surface Sㄷ of cells remains between ~ 4.2 x 10
4
and 10
5
[54,55,56]. RE-NPs with 5–10 nm size stayed for a number of 34 NPs (Fig. 3). Extrapolating this number to the surface of a cell Sㄷ , the total number of RE-NPs remained at ~ 10
4
NPs, a number which matches the number of EGFR receptors on a A549 cell. Therefore, the EGFR have the potency to be activated synergistically also by a number of tiny size RE-NPs.
AKT and ERK1/2 signal transduction pathways activated by RE-NPs via EGFR stimulation. EGFR is activated only by tiny size ~ 5 nm NPs
Electric Dipole Interaction Between RE-NPs and LABS
The above experimental results are supported by the hypothesis of cancer cell growth from LABS stimulation by tiny size core-shell RE-NPs via electrical dipole interactions, Appendix.
Indeed, the mean electrical dipole force \( \left\langle {\overrightarrow{F}}_{V_2}\right\rangle \)acting on LABS from a core-shell RE-NP includes two terms (Fig. 13d and Appendix, Eq. A22). The first radial term is inversely proportional to the forth power of separating distance r1 between the RE-NPs and LABS and is also proportional to the size of NP. The second polar term is inversely proportional to both the separating distance r1 and the square power of the size of NP,
아 Electrical dipole interaction between one core-shell RE-NP and one LABS. ㄴ , ㄷ RE core-shell NP near a MIDAS (b ) and ADMIDAS (c ) adhesion sites. d Locus area (green) of the size of RE-NPs and separating distance between a LABS and a core-shell RE-NP for two electrical charging states
식에서 1, G 그리고 G1 are the geometrical factors of NPs, describing either core-shell or core spherical structures, Appendix, Eqs. A6 and A14; 아니1 , N2 are the numbers of surface electrons on the a RE-NPs and LABS surfaces; d 그리고 b are the effective characteristic spatial extension of atomic orbitals of LABS, ~ 0.1 nm, and the radius of RE-NP; 이 그리고 ε0 are the electron charge and the vacuum permittivity and \( \theta =\frac{d}{r_1}<0.01\ rad \). Because the core of the RE-NPs is a crystalline semiconductive material, an inherent large number of surface and volume defective sites were accountable for a high density of pseudo-electron energy levels that allowed the electrons to move freely within the core volume [46]. Consequently, a core-shell structure had the potency to be highly polarised. Therefore, LABS can be activated efficiently by core-shell RE-NPs via electrical dipole interactions at close separating distances. The high polarised efficiency of the core nucleus was confirmed experimentally via the selective orientation of NPs along two distinct directions (Fig. 2(a4–d4) and Fig. 3(a4, b4)).
The polar interaction force is also proportional to the geometrical factor G1 , Appendix, Eq. A14. Typical values of dielectric constants of the culture media, shell configuration and RE core components stand for ε1 = 78, ε2 = 10 and ε3 = 15. When the ratio of core-shell to core radii b/a sets within 1 and 50, the geometrical factors G , G1 retain almost constant values (G = 0.2, G1 = 0.01) and they are self-same for both a spherical core (b/a = 1) and a spherical core-shell. Any permanent or induced polarisation of an open or closed a-I-MIDAS domain forming the LABS domain has its origin on six coordinated water oxygen atomic orbitals with Mn
2+
or Mg
2+
ions, arranged in a spherical geometric configuration [7] (Fig. 12a–c).
As the electrical dipole force in Eq. 1 stands for the vector sum of a radial (first term) and a polar component (second term), the last term prevails over the first one provided that
$$ {r}_1>\sqrt[3]{6G}b\sim b\kern0.75em (2) $$
In this case, a LABS is activated from the polar force component for all (b/a) ratios and, most important this term is inversely proportional to the second power of the size of NPs, in agreement with the experimental results that only tiny or small size LaF3 NPs activated cancer cell proliferation.
The prevailed polar force term for different r1 그리고 b values and for different Ν1 , Ν2 charging states activating the LABS/MIDAS stay within the limits [57,58,59,60].
Inequality 3 relates the size b of the RE core-shell NPs, the separating distance r1 and the number of the bound or free electrons Ν2 , Ν1 on the surface of the two dipoles. The locus of points (r1 , b ) satisfying the inequality 3 for different surface charge states Ν1 , Ν2 is bounded by the black, red and blue lines (Fig. 13c). As there was no specific assumptions for the type of RE-NP, results can be equally applied for any type of polarised NPs.
When the algebraic product of the number of the surface electrons N1 및 N2 (bound or free) on the LABS and the RE-NP, respectively, was N1아니2 = 2, the locus of RE-NPs size and separating distance for integrin activation was < 1 nm. At higher charging states, N1아니2 =10
4
, the locus area spans a wider RE-NPs size and separating distance area set of values, from 0.5 nm–19 nm to 2.5–15 nm, respectively.
From the above analysis, it is found that only tiny or small size NPs can activate LABS at a certain separating distance r1 and the electrical dipole interaction strength decays inversely proportional to the second power of the size of NPs. From Fig. 13c and for a charging state with N1아니2 = 5 x 10
4
, the size of NPs capable to activate LABS is bounded by the limits
$$ 2.5\ \mathrm{nm}
Most important, from Fig. 13c, both the locus area (green area) and the size of RE-NPs increase for higher electrical charging states.
결론
Cancer is a complex disease. Tumours are highly heterogeneous, and cell growth, among other factors, depends on dynamical interactions between cells and the continually changing extracellular matrix. Besides random genomic mutations, signal transductions in cells, activating cell growth can be triggered by mechanical, thermodynamic and electrical polar interactions between the microenvironment of the extracellular cell matrix and the membrane’s mechanosensors. Here, we demonstrated that tumour cell proliferation in three different human cancer cell lines (A549, SW837, MCF7) had the potency to be activated by a synchronised and synergetic activation of EGFR or via electrical dipole interactions between tiny size RE-NPs and the LABS of integrins on a cell.
Because the prerequisite force for integrin activation should stand between 10
−12
and 10
−9
N, the size of the active RE-NPs causing cell growth should be within certain limits. Cancer activation is specified by both the electrical surface charges on the LABS and the NPs and by their separating distance. This electric dipole activating force follows an inversely proportional square power law of the radius of NPs, evidencing that only tiny or small size RE-NPs have the potency to stimulate cancer cell growth via electrical dipole interactions, in agreement with the experimental results.
Methods
Synthesis of RE-NPs
PrF3 NPs were synthesised via co-precipitation. Briefly, 4 g of Pr2 O3 were added to 110 mL of 10% nitric acid in a polypropylene glass beaker together with 3 g of NaF under stirring. The mixture was heated to 50 °С and stirred for 45 min until a clear light-green solution appeared. Then it was filtered. The pH of the mixture adjusted to 4 by adding 25% of ammonium hydrate. Next, the mixture was stirred again for 20 min. Finally, the precipitated NPs washed with distilled water by centrifugation.
LaF3 NPs were also synthesised by applying the same protocol in a mixture of La2 O3 (4 g) and NaF (3 g). From both preparations, an aliquot of the suspensions containing NPs was air-dried for structural analysis and the remaining part kept as water suspension for the biological studies.
The suspensions of NPs were prepared in complete DMEM+FBS cell culture medium by adding water suspended NPs directly to the medium to a final concentration of 5 mM. Then, starting from the 5 mM stock solution, some subsequent dilutions using DMEM as a solvent were prepared to a final NPs concentration of 1 mM and 0.5 mM, respectively.
Size Distribution of RE-NPs
XRD
The crystal structure and the size of PrF3 and LaF3 NPs were characterised by XRD spectroscopy, with an X-ray diffractometer (Shimadzu XRD-7000S) in the 2θ range from 10° to 80° using the graphite monochromatised Cu-Ka radiation (1.5406 Å). The weighted average of τ for all peaks was used in the statistics. Weighting, besides β, took into account the relative intensity of every peak of the XRD spectra. The corresponding errors incorporate the reading error (0.3 mrad) and the standard error of the mean (se = σ / √ Ν ).
DLS
The size distribution and the MHR of RE-NPs in water and DMEM+FBS suspension were determined for comparison by DLS at 632.8 nm and right angles at 37 °C with a multi-angle dynamic and static light scattering instrument (PHOTOCOR-FC). The values of the MHR (Stokes radius) and the size distribution of NPs were calculated from the autocorrelation spectra and the Stokes-Einstein relation with the DynaLS software. Because the intensity of scattered light in pure DMEM+FBS was 20 times lower than with RE-NPs additives, the level of aggregating proteins in pure DMEM+FBS was negligible compared with mixed suspensions of RE-NPs in DMEM+FBS medium. MHR and RE-NPs size distribution and size errors were obtained by fitting and processing the data from the DLS instrument with the DynaLS software that allows the MHR to be calculated in different spectral domains of the main size distributions, from 10–10
2
to 10
2
–10
3
nm, Additional file 2.
AFM
Because size distribution below 15 nm was close to the low limit range of DLS, AFM was also applied to evaluate small size distribution. At low concentration of RE-NPs in liquid suspensions and slow drying rates of droplets on glass substrates, the deposits reflected the size distribution in the liquid suspensions [37]. Following the dispersion of RE-NPs in ethanol or DMEM+FBS, a drop of suspension was placed on a clean glass substrate using a micropipette, and then it was dried in air at room temperature for AFM imaging and analysis (diInnova, Bruker). AFM was performed in the tapping mode, in ambient conditions with a phosphorus-(n)-doped silicon cantilever (Bruker, RTESPA-CP), having a nominal spring constant of 40 nN/nm and operating at a resonance frequency of 300 kHz. Surface areas of various sizes (0.5 × 0.5–50 × 50 μm
2
) were imaged with high spatial resolution (512 px × 512 px) at a scanning rate of 0.2 Hz to identify domains with different size distributions via “scan area filtering” [37]. From the morphological analysis by the SPM LabAnalysis V7 software, the particle’s size distribution, shape and aggregation stage were determined.
The size of NPs for different scanning areas was also noticeable by the particle analysis chromatic bar (Fiji integrated ROI colour coder based on MEAC diameter) (Fig. 2(a1–d1)). The AFM image was transformed into a binary image using an appropriate z -height threshold. Every pixel of the processed image contained information not only for the z -height in the pixel area but also for the presence of particles in the pixel area. x -histograms of MEAC and Ferret diameter (Fig. 2(a2–d2, a3–d3)) were extracted by using the “Image J 1.51n Fiji distribution software”, with the correct z -height threshold values. The size resolution per pixel was 3.9 and 1.9 nm for PrF3 and LaF3 respectively.
The particle identification, the noise extraction and the particle area data were processed by the “Particle Analyser function” of Fiji software (Fig. 2(a1–d1)). The particle diameter histograms were also analysed. Both the equal area circle diameter (Fig. 2(a2–d2)) and Feret diameter or “calliper diameter” (maximum diameter of a particle among all directions) (Fig. 2(a3–d3)), whose direction was the Feret angle (Fig. 2(a4–d4)), were analysed. The mean equal area circle diameter and the mean Feret diameter were calculated taking into account all particles identified. The associated errors incorporated the actual pixel size in every AFM image and the standard error of the mean (se = σ / √ Ν ).
그 test was performed for every set of AFM images based in the “null hypothesis” that the mean particle diameter was the same for all the AFM images between randomly selected figures (Fig. 2(a1–b1, c1, d1)). 피 value (probability that the null hypothesis based on t distribution is not valid) is shown in Additional file 2.
TEM
The same technique was followed for calculating the above parameters in TEM imaging (Fig. 3(a1–b4)). Atomic resolution TEM (Hitachi HT7700 Exalens) imaged either extracellular or intracellular RE-NPs attachment on the A549 cells fixed in glutaraldehyde. Elemental analysis of F, La and Pr were also carried out (Oxford Instruments X-Max 80T).
2D-FFT
Additional information on the NPs size distribution in the (x , y ) plane was also extracted from the 2-D Fourier transform of AFM images of NPs using the relation
여기서 f (x , y ) is a size function at a point (x, y ), kx , 카와 are the associated wavevectors in the inverse Eukledian space at the same point and I (카x , k와 ) is the “spectral density” of the function f (x , y ) at the point kx , 카와 . For most applications, f (x , y ) is the z -height of the NPs at the point (x, y ) and z = f (x , y ).
For a set of discrete data, such as the digitised AFM images, the 2D-FFT was used instead of 2D Fourier transform in the continuous space. For a m × n X-matrix (pixels of an AFM image), the 2D-FFT transform takes the form
where \( {\omega}_m^{jp}={e}^{2 pi/m},{\omega}_n^{kq}={e}^{2 pi/n} \) are the associated frequencies. Then, an appropriate shift along the y -axis was performed and the integers m, n, p, q, k were translated into lengths and inverse lengths respectively by a multiplication with the pixel’s size of the image.
Water Trapping in RE-NPs
VUV Spectroscopy
To appraise the state of water in RE-NP’s complexes during the initial stage of suspension preparation, the adsorption of water molecules on the surface of the hygroscopic PrF3 NPs was identified with a laboratory-made VUV (110–180 nm) absorption spectrometer. It consists of a hydrogen lamp operating in a longitudinal stabilised discharge mode at 10 kV, a stainless steel vacuum chamber and a VUV monochromator (Acton VM502), equipped with a solar blind photomultiplier (Thorn EMI 9412 CsTe) and a laboratory-made data collection system. Thin layers of PrF3 NPs suspensions in water were prepared and dried on 1-mm-thick VUV-grade CaF2 substrates by applying the “drop-casting method”. Then, the CaF2 substrates were placed in the optical path between the hydrogen lamp and the VUV monochromator in a vacuum. The stainless steel 316 vacuum chamber was evacuated initially to 10
− 7
mbar using two turbomolecular pumps at a differential pumping configuration (Edwards EXT 100/200, pumping speed 150 ls
−1
). However, a high outgassing rate of PrF3 sets an upper limit to the background pressure in the vacuum chamber ~ 8.5 × 10
−5
밀리바. The relatively low background pressure of both compounds irreversibly damages the VUV optics and the turbomolecular pump after few hours of operation and therefore it sets certain experimental constraints, preventing an equivalent registration of LaF3 spectrum because of high outgassing rates and a low background operating pressure (< 10
−4
mbar). The experimental data (light transmitted through the sample film on CaF2 window) were fitted to a logarithmic response for calculating the transmittance.
Cell Culture and Growth Assay
Cell Growth
The A549 and SW837 cell lines were maintained in DMEM+FBS, whereas the MCF7 lines were in RPMI+FBS. Both media supplemented with 10% fetal bovine serum (FBS), 1 × penicillin, 1 × streptomycin and 2 mM l-glutamine. Cells were incubated at 37 °C, 5% CO2 in a humidified atmosphere.
The WST viability test was used to monitor the intrinsic toxicity of PrF3 and LaF3 NPs for three human cancer cell lines, A549, SW837 and MCF7. For the viability assay, three different concentrations of RE solubles (0.5, 1 and 5 mM) in DMEM+FBS (A549, SW837) and RPMI+FBS (MCF7) were used. The initial number of cells seeded in the 96-well plates was ~ 5 × 10
4
세포/웰. This amount of cells was plated 24 h prior to the RE-NPs treatment of cells in order to allow enough time for the cells to attach properly to the plate (wells) and to attain the optimum growing conditions. Subsequently, the viability test was performed 24 h after RE-NPs addition, or 48 h after the initial cell cultures were placed in the wells. As we did not observe any cell reduction, but on the contrary cell-overgrowth, especially with the SW620 cell line at 5 mM, the cell confluence quickly reached 80–90% of its initial value after 24 h of the addition of RE-NPs or 48 h from the initial plating.
Five microliters of WST solution was added to each well and the plate was incubated for 1 h during the growth state. The absorbance at 450 nm of each well was measured using a microplate reader (Biorad, x Mark). Each experimental point for each cell line and each RE suspension was extracted from two samples and triplicated every 2 days (total of 108 samples).
F test was used for every set of cell viability measurements. Here, the “null hypothesis” was that the relative to the CTRL “mean viability value was the same at different concentrations within the same cell line”. With this null hypothesis, an unknown law connecting tumour cell viability and RE-NPs concentration was identified. 피 value (probability the null hypothesis to be rejected) was also tested from the F distribution Additional file 1.
Western Blotting and Antibodies
Total proteins were extracted with 60 μL of radioimmunoprecipitation assay (RIPA) lysis buffer (20 mM Tris-HCl (pH 7.5); 150 mM NaCl, 1 mM Na2 EDTA; 1 mM EGTA; 1% NP-40; 1% sodium deoxycholate; 2.5 mM sodium pyrophosphate; supplemented with proteases inhibitors 1 mM β-glycerophosphate; 1 mM Na3 VO4 1 μg/ml; leupeptin) and the Wb assay was performed according to standard protocols (Fig. 9b). Briefly, total proteins (50 μg) were separated by SDS-polyacrylamide gel electrophoresis (SDS-PAGE) and transferred to nitrocellulose membrane. Blots were incubated overnight at 4 °C with appropriate primary antibodies. The antibodies used were tubulin code sc-8035, from Santa Cruz (final concentration 1:1000 in blocking buffer); p-ERK (E-4) code sc-7383, from Santa Cruz (final concentration 1:500 in blocking buffer); and p-AKT (Thr308) code 9275S, from Cell Signaling (final concentration 1:1000 in blocking buffer).
Wb bands are collected from different blots showing quality control of antibodies specificity. Numbers at the top of the phosphorylation images show grey scale levels from 0 (black) to 168 (grey) (maximum value ), indicating activation at a non-saturated mode.
약어
2D-FFT:
Two-dimensional fast Fourier transform
ADMIDAS:
Adjacent MIDAS
AFM:
원자력 현미경
AKT:
Protein kinase B
CTRL:
Control cells
DLS:
동적 광산란
DMEM:
Dulbecco’s modified Eagle’s medium
ECM:
Cell-extracellular matrix
EGFR:
Epidermal growth factor receptors
ERK:
Extracellular signal-regulated kinase
F.A.:
Feret angle
F.D.:
Feret area diameters
FBS:
Fetal bovine serum
LABS:
Ligand adhesion binding site
MEAC:
Mean equal area circle
MHR:
Mean hydrodynamic radius
MIDAS:
Metal ion-dependent adhesion sites
NGFR:
Nerve growth factor receptor
NP:
나노입자
RE-NPs:
Rare-earth nanoparticles
RIPA:
Radioimmunoprecipitation assay
RMS:
제곱 평균 제곱
RPMI:
Roswell Park Memorial Institute medium
SDS-PAGE:
Sodium dodecyl sulfate-polyacrylamide gel electrophoresis