자체 분해성 나노 입자를 기반으로 한 정확한 리소좀 pH 지시약에 대한 확립 및 적용 연구
초록
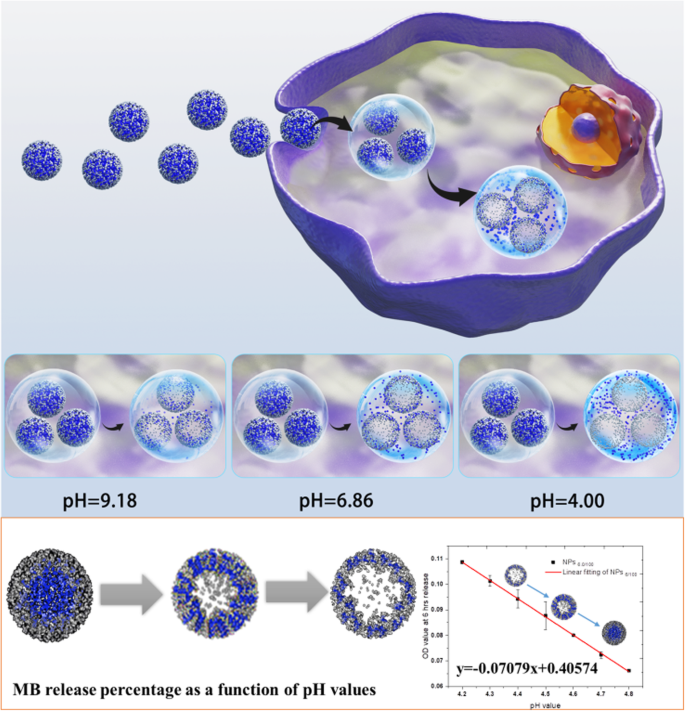
리소좀의 산성 pH는 자가포식과 밀접한 관련이 있습니다. 따라서 정확한 리소좀에 대해 잘 알려진 pH 변화는 자가포식 과정 및 상태에 대한 더 많은 정보를 제공합니다. 그러나 지금까지는 비교적 넓은 범위의 pH 변화만이 표시될 수 있었으며 정확한 리소좀 pH 검출은 도달한 적이 없습니다. 본 연구에서는 자가 분해성 SiO2를 기반으로 하는 엔도/리소좀 pH 지시약을 설정했습니다. 특정 합성 매개변수가 있는 나노 입자 시스템. 중앙 중공 구조 나노 입자의 중앙 농축 메틸렌 블루(MB)는 리소좀의 pH 범위인 pH 4.0–4.8에서 pH 값의 함수로 민감한 방출을 나타냅니다. 광학 밀도(OD) 값과 pH 값의 선형 상관 관계가 구축되었으며, 이는 6개의 다른 세포주에서 리소좀 pH의 검출에 사용되었습니다. 또한 이 시스템을 통해 BPSi(Black Mesoporous Silicon) NP endocytosis 전후의 리소좀의 pH 평균 변화를 정확하게 감지하는 데 성공하여 BPSi endocytosis 후 autophagy 종료 메커니즘을 명확히 했습니다. 따라서 자가 분해성 나노 입자 기반 루미날 pH 표시기는 리소좀 pH를 더 잘 알 수 있는 새로운 방법론 및 전략을 제공하고 자가포식 과정 또는 대사에 대한 기타 중요한 신호에 대한 자세한 정보를 나타낼 수 있습니다.
소개
리소좀은 고분자의 최종 목적지 역할을 하며, 여기서 고분자는 낮은 pH에 의해 활성화된 가수분해 효소에 의해 분해됩니다[1]. 세포질에서 리소좀 내강으로 양성자를 펌핑하는 액포형 H + −ATPase(v-ATPase)[2]에 의해 유지되는 리소좀의 산성 pH는 ~ 60가지 유형의 가수분해 효소[3]의 활성을 유지하기 위한 것이었습니다. 더욱이 최근 문헌 보고에서는 리소좀의 산성 pH가 자가포식과 밀접한 관련이 있음이 밝혀졌기 때문에[4], 리소좀의 정확한 pH 변화에 대해 잘 알려져 있으면 자가포식 과정과 상태에 대한 더 많은 정보를 얻을 수 있을 것입니다. 우리의 연구와 문헌 검토에 따르면, 아민 양성으로 대전된 나노입자 세포내이입은 아마도 1차 및 2차 아민 PEG로 장식된 나노입자 또는 입자 표면의 일부 친수성 장식과 같은 엔도/리소좀의 pH 변화를 증가시킬 것입니다[5, 6].
아민 나노입자의 엔도사이토시스에 의해 유도된 pH 증가는 전사 인자 EB(TFEB) 핵 국소화를 극적으로 증가시킬 것이며[7], 이는 경로의 전사 상향 조절을 초래할 뿐만 아니라 리소좀 기능 장애를 일으켜 궁극적으로 자가포식 흐름의 차단을 초래한다[7]. 7,8,9]. TFEB가 자가포식을 조절하기 때문에 결과적으로 TFEB의 과발현은 배양된 세포에서 자가포식소체 생산을 크게 증가시킵니다.
따라서 autophagy 과정과 autophagy의 세부 사항을 예측하기 위해서는 리소좀의 정확한 pH와 그 변화 측정이 매우 중요합니다. 지금까지 문헌[10]을 나타내는 엔도/리소좀 pH 값과 엔도/리소좀 pH 값을 검출하기 위한 상용 제품에서 비교적 넓은 범위의 pH 변화만 나타낼 수 있었고 정확한 리소좀 pH 검출은 결코 도달하지 못했습니다. . 따라서 autophagy의 자세한 통찰력을 알기 위해서는 정확한 luminal pH 변화 감지 방법의 수립이 중요한 접근 방식입니다.
자가 분해성 SiO2에 대한 이전 경험을 기반으로 합니다. 나노 입자, 이 연구에서 우리는 내강 pH 변화 감지를 실현할 수 있는 정확한 pH 지시자를 확립했습니다. SiO2 나노 입자는 조정 가능한 크기와 생체 적합성에서 좋은 이점을 가지고 있습니다[11]. 특정 합성 매개변수를 설정하여 확립된 자체 분해성 SiO2 pH 지시약은 pH 4.0–4.8의 페이로드 메틸렌 블루(MB)를 민감하게 방출할 수 있으며, 이는 정확히 리소좀의 pH 범위입니다. 더욱이, MB 방출은 pH 값 변화와 선형 상관관계를 나타냈다(도식 1). 그런 다음, 우리는 6개의 다른 세포주를 도입하여 세포 수준에 대한 pH 표시기의 실행 가능성을 테스트했으며, BPSi(검은 메조다공성 실리콘) NPs endocytosis 전후에 리소좀의 평균 pH 변화를 결정하는 데 성공하여 BPSi 후 자가포식 종료 메커니즘을 명확히 했습니다. 엔도사이토시스. 따라서 자가 분해성 나노 입자 기반 루미날 pH 표시기는 리소좀 pH를 더 잘 알 수 있는 새로운 방법론 및 전략을 제공할 수 있으며, 자가포식 과정 또는 대사에 대한 기타 중요한 신호에 대한 자세한 정보를 나타낼 수 있습니다.
<그림>
MB@SiO2의 개략도 살아있는 세포의 리소좀 pH 측정
자료 및 방법
자료 섹션
나트륨 실리사이드(NaSi) 및 Si 웨이퍼(직경 20 cm, p + (100), 0.01–0.02 Ω cm)는 각각 SiGNa Chemistry Inc. 및 Ocmetic Inc.에서 제공했습니다. 암모늄 브로마이드(NH4 Br, 99%), 브롬화나트륨(NaBr, 99%), 톨루엔(무수, 99.8%), 염산(HCl, 37%), MB 및 테트라에틸 오르토실리케이트(TEOS)는 Sigma-Aldrich에서 구입했습니다. 0.5 kDa 메톡시-PEG-실란 및 2 kDa 메톡시-PEG-실란은 Fluorochem Ltd. 및 Laysan Bio Inc.에서 별도로 구입했습니다. RPMI 1640 배지는 Life Technologies에서 제공했습니다. 소태아혈청(FBS)은 TianHang 생물학적 기술에서 구입했습니다. 중탄산나트륨, 스트렙토마이신 설페이트, 페니실린 G, HEPES, 리소자임 용액, CellLight Early-endosomes-GFP, LysoTracker™ Red DND-99, Pierce® BCA 단백질 분석 키트, 향상된 화학 발광, pHrodo™ Red Transferrin 접합체, Live Cell Imaging Solution 및 Trizol 시약은 Thermo Fisher Scientific에서 구입했습니다. 에탄올과 암모니아수는 Sinopharm에서 제공했습니다. BioRT Master HiSensi cDNA First-Strand Synthesis 키트는 Hangzhou Bioer Technology Co., Ltd.에서 구입했습니다. RIPA 용해물은 Heart Biological Technology Co., Ltd.에서 구입했습니다. P62, TFEB 및 β-액틴 항체는 Proteintech Group에서 구입했습니다. , Inc. LC 3B 항체는 Abcam에서 제공했습니다. 2-(4-피리딜)-5-((4-(2-디메틸아미노에틸-아미노카르바모일)메톡시)페닐)옥사졸(PDMPO)은 Yeasen Biotech Co., Ltd.에서 제공했습니다.
연구의 목표, 설계 및 설정
이 연구의 목적은 (1) HepG2 세포에서 자가포식에 대한 BPSi 나노입자의 영향을 탐구하고, (2) 자가포식에 영향을 미치는 리소좀 pH 값 변화의 기본 메커니즘을 찾고, (3) 측정할 수 있는 정확한 리소좀 pH 지시약을 확립하는 것입니다. 리소좀의 pH는 정확하고 마지막으로 (4) pH 변동이 자가포식에 미치는 영향을 나타냅니다. 위의 연구 목적을 실현하기 위해 우리는 BPSi 나노 입자를 공급 한 후 HepG2 세포에서 transcriptome 유전자 변화를 탐색하기 위해 transcriptome 시퀀싱 실험을 사용하고 RT-qPCR 및 Western 실험으로 확인했습니다. PDMPO와 같은 형광 염료를 사용하여 BPSi를 공급한 후 HepG2 세포의 리소좀 pH 변화를 측정했습니다. 리소좀의 pH를 정확하게 측정하기 위해 MB@SiO2를 개발했습니다. 10개의 매개변수를 가진 나노입자를 생성하고 DLS 및 HR-TEM과 같은 실험을 통해 이러한 10가지 나노입자의 특성을 테스트했습니다. 10 시리즈 자체 분해성 나노 입자 시스템의 MB 로딩 효율 및 방출 동역학 연구는 다양한 pH 용액과 HepG2 세포에서 테스트되었습니다. 세포에 들어간 후 나노입자의 세포내 위치를 확인하기 위해 세포 TEM 실험과 살아있는 세포 공초점 현미경을 시행했습니다. 마지막으로 MB@SiO2의 보편성을 확인하기 위해 BPSi를 공급한 후 6가지 세포의 리소좀 pH 변화를 측정했습니다. 리소좀 pH 변화를 측정하기 위한 나노입자.
BPSi 나노입자 합성
BPSi 나노입자는 우리의 이전 방법[12]에 의해 준비되었고 우리의 협력자(Wujun Xu, University of Eastern Finland 응용 물리학)가 제공했습니다. BPSi, NaSi, 암모늄염 및 NaBr(NaSi:NH4 Br:NaBr 1:4:4, w/w/w)를 Ar 분위기의 글로브 박스에서 분쇄했습니다. 그들은 N2 아래의 튜브 오븐에서 반응하도록 허용되었습니다. 240 °C에서 5 시간 동안 대기(식 1). 주위 온도로 냉각시킨 후, 얻어진 미립자를 0.5M HCl 및 1.0M HF 용액으로 개별적으로 헹구어 정제하였다. 마이크로 입자를 에탄올에서 1000 rpm으로 15분 동안 볼 밀링하고 원심 분리 속도를 조정하여 원하는 직경의 BPSi 나노 입자를 수집했습니다.
Dynamic Light Scattering 실험을 통해 나노입자의 직경분포와 표면전하를 연구하였다. 모든 나노입자는 세포에 도입되기 직전에 약간의 초음파(용액에 균일하게 분산되도록 5 s, 초음파 세척기 SB-5200DT, Ningbo Scientz Biotechnology Co., Ltd.)로 멸균 후 배지에 분산시켰다.
10 시리즈 자가분해 나노입자 시스템 구축
10 시리즈 자체 분해성 나노 입자는 수정된 매개변수를 사용하여 이전에 보고된 방법론에 의해 합성되었습니다[13,14,15,16]. 일반적인 절차에서는 에탄올(75 mL)과 암모니아-수용액(25%, 3.4 mL)의 혼합물에 일정량의 MB를 먼저 첨가한 다음 일정량의 TEOS를 첨가했습니다. 시리즈 자체 분해성 MB@SiO2 NP는 24시간 동안 교반한 후 얻어졌으며 건조되기 전에 3번 세척되었습니다. 프로토콜에 추가된 MB 및 TEOS 양은 표 1에 설명된 대로입니다. NP에서 1.0/100의 의미1.0/100 1.0 mg의 MB와 100 μL의 TEOS로 나노 입자를 합성할 때 MB와 TEOS의 목록을 나타냅니다. 그리고 NP1.5/100에서 1.5/100의 의미 나머지는 1.0/100과 일치합니다.
세포 배양
자가분해성 나노입자를 기반으로 하는 pH 지시약의 효율성과 보편성을 검증하기 위해 특정 종양유래 암세포주에 대해 실험을 하였다. 이에 간암, 폐암, 결장암, 흑색세포종 세포주를 연구 대상으로 선정하였다. 인간 결장암 세포 HCT116, HCT8 및 HCT15의 세포주; 인간 간암 세포 HepG-2; 인간 폐암 세포 A549; 및 마우스 흑색종 세포 B16은 10% 열 불활성화 FBS, 2.0 g/L 중탄산나트륨, 0.1 g/L 스트렙토마이신 설페이트, 0.06 g/L 페니실린 G 및 5.958 g가 보충된 RPMI 1640 배지(Life Technologies)에서 유지되었습니다. 헤페스. 세포는 5% CO2가 포함된 습한 분위기에서 37°C의 표준 세포 배양 인큐베이터에서 유지되었습니다. .
10 시리즈 자체 분해성 나노입자 시스템의 특성
모든 시리즈 나노 입자의 형태는 STEM 모드가 있는 HR-TEM으로 특성화되었으며 Si 매핑은 EDS 요소 매핑으로 연구되었습니다. 나노입자 크기 분포 분석은 무작위로 선택된 STEM 이미지에서 나노입자 직경을 계산함으로써 ImageJ 소프트웨어에 의해 수행되었습니다. 나노입자의 제타 전위와 다분산 지수(PDI)는 특정 pH 값을 갖는 직렬 버퍼에서 동적 광산란(DLS) 연구에 의해 측정되었습니다. 데이터는 SPSS15.0으로 분석되었으며 통계 결과는 평균 ± S.D.
로 표시되었습니다.
10 시리즈 자체 분해 나노 입자 시스템의 MB 로딩 효율 및 방출 역학 연구
MB 로딩 효율과 방출 역학을 연구하기 위해 시리즈 농도에서 MB의 표준 곡선이 먼저 설정되었습니다. MB의 흡수는 660 nm에서의 흡광도를 갖는 UV-Vis 스펙트럼에 의해 수행되었으며, 이는 λ 단위체 MB의 최대. MB 로딩 효율은 MB 로딩 효율(%) =캡슐화된 MB의 양/(MB 입력의 총량)이라는 공식으로 계산되었습니다.
10 시리즈 나노입자로부터의 MB 방출은 다양한 pH 값(pH 4.0, pH 6.86, pH 9.18)과 리소자임 용액(Thermo Scientific™
#
90082). 또한, 다양한 pH 완충액에서 특정 기간 후 MB 방출 동역학도 조사했습니다. 그런 다음 660 nm에서의 OD 값과 시간에 따른 MB 방출 비율을 연구했습니다.
자세한 내용은 MB 릴리스 연구를 아래 프로토콜에 따라 수행했습니다. 10 시리즈 나노입자를 각각 리소좀 용액과 함께 pH 4.0, 6.86 및 9.18의 15mL 표준 완충액에 용해했습니다. 37 °C의 Hula 믹서에서 MB 방출을 수행했습니다. 다음 15 일 동안 각 샘플의 1 mL를 수집한 다음 12000 rpm에서 10분 동안 원심분리했습니다. 상층액과 침전물은 200–800 nm에서 흡수 스펙트럼을 측정했습니다.
또한, 4.1에서 5.5 사이의 pH 범위에서 리소자임 용액을 사용하여 정확한 pH 버퍼에서 MB 방출을 위의 동일한 프로토콜로 조사했습니다. 특정 기간(6 h, 12 h 및 24 h)을 관찰 시점으로 지정했습니다. 660 nm에서의 흡수가 각 샘플에서 기록되었습니다. 각 pH 용액의 흡수의 선형 관계와 잔류물의 제곱의 합을 각 시점에서 각각 세었습니다.
세포에서 MB 방출 프로필을 감지하기 위해 HepG-2 세포를 75 cm
2
배양 플라스크에 넣고 세포가 배양 플라스크의 70%까지 증식했을 때 NP(300 μg/mL)를 공급했습니다. 30분마다 세포를 수집하였다. 세포를 반복적으로 동결 및 해동하여 세포 내의 MB를 완전히 방출시켰다. 세포 용해물을 12000 r/min에서 10분 동안 원심분리했습니다. 상층액을 얻고 660 nm에서 흡광도를 측정하여 방출된 MB의 총량을 계산했습니다. 이 연구에서 HepG2 세포는 빠른 세포 증식으로 인해 10개의 모든 테스트 그룹 간의 편차를 최소화할 수 있기 때문에 연구 대상으로 선택되었습니다.
10 시리즈 나노입자의 세포 공동국재화 및 6개의 다른 세포주에서의 방출 성능
세포 TEM은 표준 세포 TEM 프로토콜에 따라 엔도/리소좀에서 나노입자의 공동 국소화를 연구하는 데 사용되었습니다. 세포는 1 × 10
6
의 강도로 시딩되었습니다. 세포/플라스크에 넣고 24 h 동안 배양하여 세포 부착을 허용합니다. 동일한 농도(100 μg/mL)의 배지에서 10개의 일련의 나노입자를 각각 다른 12시간 및 24시간 동안 세포와 함께 인큐베이션했습니다. 그런 다음 세포를 PBS로 3회 세척하여 과량의 나노 입자를 제거한 다음 2.5% 글루타르알데히드 용액에 1 일 이상 고정했습니다. 그런 다음 고정된 세포를 세척하고 탈이온수 중 1% 오스뮴 테트라옥사이드로 1시간 동안 염색한 다음 PBS로 3회, 탈이온수로 2회 세척했습니다. 다음으로 고전적인 세포 TEM 프로토콜[17, 18]을 수행하고 TEM 관찰을 위해 두께가 90 nm인 섹션을 수집했습니다. pH 값의 함수로서의 MB 방출은 두 NP6/100가 있는 6개의 세포주에서 연구되었습니다. 및 NP7.5/80 . 또한, MB 방출에 따른 OD 값과 MB 방출 비율을 데이터 분석을 위해 기록하였다.
MB@SiO2의 세포내 흡수 조사2 나노입자
MB@SiO2의 세포 흡수 및 세포 내 운명을 평가하기 위해 라이브 셀 공초점 현미경이 사용되었습니다. 나노 입자. HepG-2 세포 초기 엔도솜을 16 시간 동안 염색했습니다(CellLight Early-endosomes-GFP, BacMam 2.0 ThermoFisher Scientific C10586, 여기/방출 ~ 488/510 nm). 그런 다음 세포를 NP6/100와 함께 배양했습니다. 특정 시간 간격(2 h, 2.5 h, 3 h, 5 h 및 6 h)에서 100 μg/mL의 나노입자 농도에서 (MB 여기/방출:640/650–700 nm). 이미지를 촬영하기 전에 lysotracker를 LysoTracker™ Red DND-99(Thermo Fisher Scientific L7528, 여기/방출:577/590 nm)로 40분 동안 염색했습니다. 그 후 얼룩 용액을 제거하고 PBS로 세포를 2-3회 세척합니다. 이미지는 Nikon A1R 공초점 현미경을 사용하여 촬영되었습니다.
BPSi 공급 후 유전자 발현 변화를 평가하기 위한 전사체 시퀀싱
대조군 및 BPSi 처리군의 총 RNA 추출은 표준 작동 절차에 따라 Trizol 시약을 사용하여 수행되었습니다. 시퀀싱 실험을 위한 초기 총 RNA 샘플의 품질은 NanoDrop ND-2000 분광 광도계를 사용하여 감지되었습니다. 품질 관리를 통과한 총 RNA는 후속 시퀀싱 실험에 사용되었습니다. 유전자 발현의 비교는 차세대 시퀀싱으로 수행하였다. 모든 시퀀싱 프로그램은 BGISEQ-500 플랫폼을 사용하여 BGI-Shenzhen Corporation(Shenzhen, China)에서 수행했습니다. 시퀀싱을 통해 얻은 원시 데이터는 시퀀싱 데이터가 후속 분석에 적합한지 여부를 결정하기 위해 품질 관리를 수행합니다. 통과되면 유전자 발현 수준에 따라 유전자의 정량 분석을 수행하고 선별된 샘플 사이에서 차등적으로 발현되는 유전자에 대한 유전자 온톨로지(GO) 기능의 유의미한 농축 분석을 수행합니다.
TFEB-CLEAR 유전자 네트워크의 활성화를 확인하기 위한 역전사 정량적 중합효소 연쇄 반응(RT-qPCR) 분석
Trizol 시약을 사용하여 대조군과 BPSi 처리군의 배양된 HepG-2 세포에서 총 RNA를 추출하고 BioRT Master HiSensi cDNA First-Strand Synthesis Kit(Hangzhou Bioer Technology Co., Ltd)를 사용하여 cDNA로 역전사했습니다. .) 무작위 프라이머로. cDNA를 사용하여 액틴을 참조 대조군으로 사용하여 Applied Biosystems™ 7500 실시간 PCR 시스템(Applied Biosystems, Life Technologies, Carlsbad, CA)을 사용한 정량적 PCR에 의해 TFEB-CLEAR 유전자 네트워크를 증폭했습니다. 정량적 RT-PCR에 사용된 프라이머는 표 S4에 나열되어 있습니다.
BPSi 공급 후 자가포식이 활성화되었는지 확인하기 위한 웨스턴 블롯 분석
대조군과 다른 농도의 BPSi 처리군의 세포 단백질은 RIPA 용해물(Heart Biological Technology Co., Ltd.)로 추출하였다. 프로테아제 억제제를 RIPA 용해물에 첨가하고 얼음 위에서 미리 냉각시켰다. 미리 냉각된 PBS로 세포를 3회 세척했습니다. 액체를 완전히 버리고 접시를 2 분 동안 얼음에 넣었습니다. 400 마이크로리터의 RIPA 용해물을 전체 접시의 표면에 첨가하고 피펫으로 여러 번 피펫팅하고 얼음 위에서 30분 동안 배양하고 접시를 여러 번 흔들어 세포를 완전히 용해시켰다. 용해된 세포액을 1 ml Eppendorf 튜브로 옮기고 4 °C, 10분 동안 13,000 rpm에서 원심분리했습니다. 얻어진 상층액을 물에 10분 끓인 후 -20 °C에 두어 나중에 사용한다. 단백질 농도는 Pierce® BCA 단백질 분석 키트(Thermo Scientific)를 사용하여 정량화되었습니다.
25 μg 총 단백질을 함유하는 세포 추출물을 SDS-PAGE에 직접 처리하고 옮겼습니다. 막을 5% 탈지유로 차단하고 P62를 인식하는 1차 항체(Proteintech
#
18420–1-AP), TFEB(Proteintech # 13372–1-AP), LC 3B(Abcam
#
ab192890) 및 β-액틴(Proteintech
#
20536–1-AP). 2차 항체는 1차 항체의 기원 종에 따라 선택하고 향상된 화학발광(Pierce) 또는 Bio-Rad ChemiDoc XRS + Gel Imaging System(Bio-Rad, USA)을 사용하여 검출했습니다. β-액틴에 대한 P62, TFEB 및 LC 3B의 정규화된 밴드 강도는 BPSi 그룹에서 ImageJ 소프트웨어를 사용하여 농도계에 의해 정량화되었으며 데이터는 평균 ± S.D입니다. 세 가지 독립적인 실험에서.
공초점 현미경으로 PDMPO 및 pHrodo™ Red Transferrin Conjugate로 세포 pH 측정
PDMPO 연구
1 × 10
5
HepG-2 세포를 멸균 공초점 플레이트에서 밤새 배양하고 BPSi 나노입자에 100μg/mL 농도를 공급하였다. 다음날 면역형광 염색 전에 슬라이드를 0.01 M 인산완충식염수(PBS), pH 7.4로 3회 세척한 다음 1 μM PDMPO 염료(Ex/Em =329/440)를 첨가했습니다. PBS로 3회 세척한 후 신선한 RPMI-1640 배양액으로 세포를 배양한 후 CCD 카메라로 형광현미경(Nikon A1R, Japan)으로 관찰하여 5분 이내에 청색과 녹색 형광강도의 비율로 사진을 촬영하였다. 그런 다음 Chen et al.의 절차에 따라 리소좀에서 계산되었습니다. [19].
pHrodo™ 레드 트랜스페린 접합체 연구
HepG-2 세포를 24시간 동안 세포 부착을 위해 동일한 방식으로 공초점 플레이트에 플레이팅한 다음, 플레이트를 10분 동안 얼음 위에 두었다. 20 mM 포도당과 1% BSA를 포함하는 차가운 Live Cell Imaging Solution으로 세포를 세척했습니다. pHrodo™ Red Transferrin 접합체(Ex/Em =560/585 nm)를 Live Cell Imaging Solution에 25 μg/mL로 추가하고 37 °C에서 20 분 동안 배양한 다음 Live Cell Imaging Solution에서 세포를 세척했습니다. 관찰은 또한 공초점 현미경으로 수행되었습니다. 현미경 이미지의 강도에 대한 정량적 분석은 ImageJ 소프트웨어로 수행되었습니다.
세포 리소좀 pH 검출
A549, HepG-2, HCT8, HCT15, HCT116 및 B16 세포는 75 cm
2
에서 배양되었습니다. 배양 플라스크에 넣고 세포가 배양 플라스크의 70%까지 증식하면 NP를 공급하고 6 h 후에 세포를 수집하였다. 세포를 반복적으로 동결 및 해동하여 세포 내의 MB를 완전히 방출시켰다. 세포 용해물을 12000 r/min에서 10분 동안 원심분리했습니다. 상층액을 얻고 660 nm에서 흡광도를 측정하여 방출된 MB의 총량을 계산했습니다. NP의 흡광도6.0/100 표준 pH에서 비교하여 각 세포의 pH 값을 구했습니다.
통계 분석
통계 분석은 독립 그룹에 대해 양방향 분산 분석(ANOVA)을 사용하고 다중 비교 테스트에 Tukey HSD 방법을 사용하여 SPSS15.0 소프트웨어로 수행되었습니다. 통계적 유의성은 P 값을 기반으로 했습니다. <0.05.
결과 및 토론
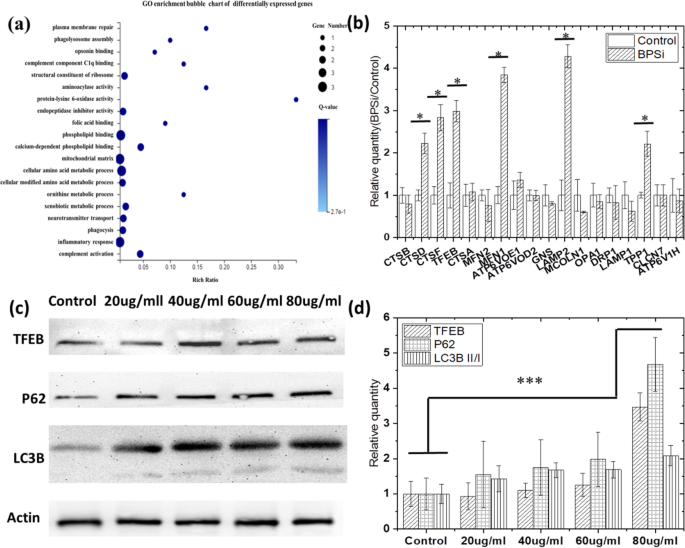
우리는 먼저 이중 PEG 기능성 흑색 다공성 실리카 나노입자(BPSi NPs)가 공급된 세포에서 차등 유전자 발현을 감지했습니다(우리 공동 연구실에서 제공 [12]). − 18.5에서 + 2.8 mV로의 제타 전위 변화는 표면 이중 PEG화가 성공적임을 나타냅니다(그림 S1a). BPSi 나노 입자의 평균 직경은 156 nm였습니다(그림 S1b). 차등 유전자 발현의 클러스터 히트 맵(그림 S2)을 기반으로 추가 조사를 위해 2배 이상의 차등 유전자 발현을 선택했습니다. Go와 KEGG는 차등 유전자를 분석하기 위해 도입되었습니다. Go 농축 버블 맵(그림 1a)에서 phagolysosome 조립, phagocytosis 및 xenobiotic 대사 과정을 포함한 대사 및 리소좀 관련 유전자가 추가 분석을 위해 선택되었습니다. 특히, TFEB-CLEAR [17] 관련 유전자 발현이 크게 증가했습니다. RT-PCR 결과(그림 1b)도 유전자 염기서열 분석 결과, CTSD, CTSF, TFEB, MFN1, LAMP2 및 TPP1과 같은 TFEB-coordinated lysosomal expression 및 CLEAR(coordinated lysosomal expression) 경로의 유전자가 유의하게 증가했음을 확인했습니다. . 이 유전자는 그림 S3과 같이 리소좀 경로에 표시되어 있습니다. 이들의 발현은 대조군보다 높고 통계적 유의성을 갖는다(PBPSi 대 제어 <0.05). 그리고 TFEB는 리소좀 유전자의 발현을 긍정적으로 조절하고, 리소좀 개체군을 조절하며, 리소좀 기질의 세포 분해를 촉진합니다.
<그림>
Autophagy는 BPSi를 공급한 후 HepG-2 세포에서 활성화됩니다. 아 전사체 시퀀싱에 의해 발견된 차등적으로 발현된 유전자의 GO 농축 버블 맵. ㄴ RT-qPCT 실험으로 처리한 BPSi 후 TFEB-CLEAR 유전자 네트워크의 유전자 변화 확인. ㄷ BPSi 처리 후 P62, TFEB, LC3B II/I 단백질 발현. d 대조군에 따른 BPSi 처리군에서 P62, TFEB, LC3B II/I 단백질의 정규화된 밴드 그레이 강도. 데이터는 평균 ± SD로 표시되었습니다.
또한, TFEB는 자가포식을 조절하며, TFEB 유전자의 주요 기능은 리소좀의 생합성을 유도하고 자가포식의 발생을 촉진하기 때문에 과발현은 배양된 세포에서 자가포식소체 생산을 크게 증가시킨다[20]. 세포에 BPSi NP가 공급될 때 자가포식이 발생했는지 여부를 입증하기 위해 웨스턴 블롯 분석도 사용되었습니다. Western test의 목적은 BPSi 공급 후 TFEB의 발현이 증가하고 세포 자가포식의 발생을 추가로 확인하는 것이었습니다. LC3B 및 P62 단백질은 모두 자가포식 마커입니다. 자가포식이 발생하면 미세소관 관련 단백질 1A/1B-경쇄 3B(LC3B) II/I의 발현이 증가합니다. p62는 자가포식에 의해 분해되는 소포에 대한 수용체이자 유비퀴틴화된 단백질 응집체가 제거되는 수용체이기도 하며, 자가포식이 발생하면 그 발현이 감소합니다. 그래서 우리는 서양 실험에서 이들 단백질의 발현을 측정했습니다.
도 1c, d, TFEB(P80 μg/ml VS 대조군 =0.000008), LC3B II/I(P80 μg/ml VS 대조군 =0.000297) 및 p62(P80 μg/ml VS 대조군 =0.000016) 단백질은 모두 크게 상향 조절되었습니다. autophagy의 활성화를 나타내는 TFEB 및 LC3B II/I 단백질의 상향 조절 [18]로, 우리는 BPSi endocytosis가 autophagy의 발생을 촉진한다고 의심했습니다. 그러나 p62 단백질은 엔도좀을 리소좀으로 가져오고 최종적으로 분해되는 운반체 단백질 특성으로 인해 자가포식 과정에서 하향 조절되는 것으로 추정됩니다. 우리 연구에서 p62의 상당한 상향조절은 엔도-리소좀 융합 과정 동안 분해의 종료를 나타냈으며[21], 이는 아마도 엔도-리소좀 소포의 pH 증가에 의해 야기되었을 것입니다. 따라서 BPSi endocytosis는 먼저 autophagy의 발생을 유도한 다음 amide 알칼리성으로 인해 endo/lysosome pH 값을 증가시켜 autophagy 과정을 억제할 수 있습니다.
BPSi 엔도사이토시스에 의한 엔도/리소좀의 pH 증가 특성을 입증하기 위해 두 개의 상용 pH 형광 프로브인 pHrodo™ Red Transferrin Conjugate(Thermo Fisher
#
P35376) 및 RatioWorks™ PDMPO.
상용 세포내 pH 지시약인 pHrodo™ Red는 일반적으로 중성 pH에서 약한 형광성을 나타내지만 pH가 떨어지면 형광성이 증가합니다. 560/585 nm의 여기/방출과 함께 ~ 6.5의 pKa로 9-4 범위의 세포 세포질 pH를 정량화해야 했습니다. 우리는 6개의 세포주 결정에서 BPSi NP의 엔도사이토시스가 약화되는 적색 형광 신호로 인해 엔도/리소좀의 pH 값을 증가시키는 능력이 있다는 질적 분석 결론을 얻을 수 있었습니다(그림 S4 및 S5). 그러나 제품 작동 프로토콜에 따라 여러 번 실험을 반복한 후에 강도와 설정된 pH 값 사이에 상관 관계가 없기 때문에 BPSi NP를 공급하기 전후에 서로 다른 세포주에서 감소한 정확한 pH 값을 거의 정량적으로 분석하지 못했습니다.
그런 다음 PDMPO는 BPSi 엔도사이토시스 후 pH 값 변화를 나타내는 더 나은 솔루션으로 사용되었으며, 이는 pH 정량적 측정에서 비율 이미징 기술을 도입합니다. PDMPO [2-(4-피리딜)-5-((4-(2-디메틸아미노에틸-라미노카르바모일)메톡시)페닐)옥사졸]은 산성 이중 여기 및 이중 방출 pH 프로브로 특징지어집니다. 낮은 pH에서 강렬한 녹색 형광을 방출하고 높은 pH에서 강렬한 파란색 형광을 나타냅니다. 이 독특한 pH 의존적 형광으로 인해 PDMPO는 pKa =4.47인 산성 소기관에 이상적인 pH 프로브가 됩니다. PDMPO는 살아있는 세포의 산성 소기관(예:리소좀)에 선택적으로 레이블을 지정하고 두 개의 뚜렷한 방출 피크를 사용하여 비율 측정에서 살아있는 세포의 pH 변동을 모니터링할 수 있습니다. 그러나 우리는 BPSi 공급 전후에 6개의 세포주에서 pH 값을 측정하는 데 여전히 실패했습니다. 그림 S6에 나타난 결과와 같이, BPSi 공급 전후에 모든 6개 세포주에서 유의한 차이가 관찰되지 않았다. Blue/Green 비율과 pH 값 사이에 상관 관계가 설정되었지만(그림 S7) pH 4–5의 비선형 상관 관계로 인해 PDMPO 방법은 BPSi 공급 전후의 엔도/리소좀 정량 분석에 실패했습니다.
위의 두 가지 상용 pH 지표 데이터에서 우리는 먼저 PEG 사슬에 아미드가 있는 PEG 장식 나노입자가 아미드의 알칼리성 특성으로 인해 엔도/리소좀 pH를 증가시킬 수 있다는 의심을 입증했습니다. 그러나 정확한 pH 변화(0.1 pH 범위)에 대한 정량 분석 없이는 autophagy 상태와 endo/lysosome pH 값 간의 상관 관계를 설정할 수 없으므로 autophagy 예측에 실패했습니다.
자기 분해성 나노 입자에 대한 이전 연구 [13, 14] [15, 22]를 기반으로 하여 75% 에탄올에서 동일한 농도의 수산화 암모늄을 유지했지만 MB 및 TEOS 농도를 조정했습니다. 서로 다른 쉘 두께와 기공 크기를 얻기 위해 두 가지 시리즈의 TEOS 양을 100 μL 및 80 μL로 설정했습니다. 10개의 시리즈 MB 양은 센터 중공 구조와 MB 로딩 효율의 다른 크기를 얻기 위해 설정되었습니다.
프로토콜에 추가된 MB 및 TEOS 양은 아래 표 1과 같습니다.
그림 2a, b에서 볼 수 있듯이 TEOS 농도(100 μL 및 80 μL) 모두에서 MB 양이 증가함에 따라 나노입자 크기가 증가했습니다. 동일한 MB 농도에서 입자 크기는 TEOS 양이 증가함에 따라 증가했습니다. Moreover, with the increase of the TEOS amount, the shell thickness grew up, which has been proved by the element mapping (shown as Fig. 2c). The polydispersity index (PDI) and surface charge of the nanoparticles are shown in Fig. S8 and Table S1. The morphology studies predicted that with the increase of MB amount, the loading efficiency will grow up, leading to the faster release profile, while with the increase of TEOS amount, the release will slow down. And we need to find out the appropriate MB and TEOS concentration, with which we could obtain the optimized nanoparticle systems, that we may be able to make the MB release profile linear correlated with the pH changes.
Morphology characterization of 10 different self-decomposable nanoparticles with specific MB or TEOS amount. 아 STEM figures. ㄴ Nanoparticle size distribution analysis. c Si mapping of 10 self-decomposable nanoparticles. Scale bars in all figures are 100 nm. The size distribution analysis was performed by randomly chosen 100 nanoparticles from STEM figures and measured by ImageJ software. Data was presented as mean ± S.D.
The MB loading efficiency was determined by UV-Vis spectrum. The standard curve (Fig. S9) of MB was firstly drawn using series concentrations of MB solution (from 6.25 to 46.88 μg/mL), with the equation as y = 67.63x + 0.10919, R
2
= 0.9987. As calculated with the equation above, we obtain MB loading efficiency of 10 self-decomposable nanoparticles with specific parameters, detailed data shown in Fig. S10.
Before the study of the MB release profiles in different pH solutions, the release profiles in pure water have been studied. As shown in Fig. S11 and Fig. S12, all the nanoparticles with TEOS amount of 80 μL presented increased MB release along with the duration increase, which was reflected by the UV–Vis absorption. Moreover, with the MB encapsulated amount increase, the growth trend of MB release becomes more significant. Also, the release velocity grows faster. However, as the TEOS amount increase to 100 μL, the particle surface became more densed and the release becomes slower when the MB amount below 3.0 mg; almost no increase trend could be observed in the MB release in water during 14 days of release. As long as the MB amount increases to above 4.0 mg, an obvious increase trend of MB release could be observed. One thing to be noticed is that the nanoparticle parameter of both NPs7.5/80 and NPs6.0/100 presented solid growth as the time prolongs, almost showed a linear increase trend during the first 7 days, and then reached the platform.
Then, we focused on the MB release behavior in different pH buffers to figure out whether self-decomposable nanoparticles with specific parameters could have the linear pH-dependent MB release.
Firstly, we carried out the MB release experiments at pH 4.0 buffer solution. From Fig. S13, we could easily reach the conclusion that with the same TEOS amount of 100 μL, the MB release velocity presented a similar trend was observed in the 5 nanoparticle systems of TEOS at 80 μL (Fig. S14), the center positive correlation with the MB encapsulated amount.
Concentrated MB diffuses into the surrounding solution via diffusion due to concentration difference. The bigger concentration gradient makes the faster MB release. Compared with the MB release in pure water, we found that the acidic environment speeded up the release of MB (Fig. S13 and S14 compared with Fig. S11 and S12), indicating that the MB release is not only driven by diffusion; however, in acidic solutions, electrostatic repulsion is also an important driven force due to the positive charge nature of MB. We then calculated the release percentage of each nanoparticle parameter according to the MB loading efficiency, MB standard curve, and the dilution ratio at measurements. The release percentage reflected the release speed of MB in pH 4.0 acidic solution, and the results (Fig. 3) showed that only the release percentage of NPs7.5/80 presented linear release in pH 4.0 solution. Other nanoparticle systems with specific MB and TEOS parameters showed similar release trends, and the release percentage did not have a linear growth. One exception is NPs6/100 , and the MB release reached the platform in only 72 h; thus, it was hard to tell whether the MB release could grow linear before that duration at this stage.
MB release percentage of 10 series self-decomposable nanoparticles after a specific duration in pH 4.0 buffer. All experiments were triple repeated, and the data were shown as mean ± S.D.
Meanwhile, we tested the MB release profiles in near-neutral and alkali buffers (pH 6.86 and pH 9.18). The results in both Fig. S15, S16, Fig. S17, and S18 demonstrated that the MB release slowed down with the solution pH increase to 6.86; moreover, with the central MB concentration increased, the MB release percentage decreased. At pH 9.18, all nanoparticles with 10 specific parameters presented a very slow MB release (Fig. S19 and S20); no matter in UV–Vis absorption or the release percentage, the trend was similar with the one in pH 6.86 buffer, but with even lower release percentage. So, it was clear that the self-decomposable nanoparticles only presented MB release linear growth in acidic solutions. We thought back to the endo/lysosomes pH, from 4 to 5, which is exactly the pH range of MB linear growth as a function of time in a specific MB/TEOS parameter. Thus, we get more confident that the self-decomposable nanoparticle system may be an accurate measuring tool for quantitative determining the endo/lysosome average pH, then provide evidence on the exact pH value of autophagy status.
The precondition of using the specific self-decomposable nanoparticles as an endo/lysosome pH indicator is that the nanoparticles stay stable in the endo/lysosome during the whole measurement process. Secondly, the MB release in endo/lysosome should occur smoothly when the measurement carried out.
The colocalization of the nanoparticle in the endo/lysosomes by cell TEM study and the MB release in 6 different cell lines were studied. From the cell TEM results, all of the 10 series nanoparticles stayed in the endo/lysosomes without escaping, after 24-h incubation with the HepG-2 cells (Fig. 4). Since the diameter of HepG2 cells used in Fig. 4 is about 10–20 μm and the diameter of MB@SiO2 nanoparticles is between 75 and 200 nm, it will be very difficult to clarify the nanoparticle morphologies using the images with low magnification (as shown in Fig. S21). We also investigated the intracellular location of the nanoparticles in the other 5 cell lines, and 4 nanoparticles were randomly selected to demonstrate the nanoparticles were trapped in the endo/lysosomes (Fig. S22). The nanoparticles with all parameters showed a central hollow structure in all other 5 cell lines after 24-h incubation, indicating the MB release. Moreover, under more precise observation, we noticed the MB release may be different due to different hollow sizes, pointing to the fact that (1) the endo/lysosome pH in different cells is different and (2) the MB release from the nanoparticles is very sensitive to the endo/lysosomes pH, especially for the NPs6/100 and NPs7.5/80 . From Fig. S23, we can find that nanoparticles have already realized the endocytosis and stayed in the vesicles 2 h after nanoparticle feeding, then nanoparticles gradually accumulated in lysosomes.
The colocalization of the nanoparticle in the endo/lysosomes by cell TEM study after 12 and 24 h incubation with the 10 series nanoparticles. The scale bar is 200 nm in the TEM images
We then evaluated the correlation between the pH values and the OD values in pH 4.0–4.8. From the results in Fig. 5 and Fig. S24, for NPs6/100 and NPs7.5/80 nanoparticle systems, the MB release presented a linear decrease as a function of pH in the pH range from 4.0 to 4.8.
MB release as a function of pH values in NPs6/100 and NPs7.5/80 after specific incubation duration, 6 h, 12 h, and 24 h. The linear correlation equations were also calculated for 6 h and 12 h for MB release from both NPs6/100 and NPs 7.5/80 as a function of pH values. All experiments were carried out triplicated, and the data were shown as mean ± S.D.
We then converted the OD value to the MB release percentage according to the MB loading efficiency and feeding amount. As shown in Fig. S25, in the first 6 h, the MB release percentage in NPs6/100 and NPs7.5/80 nanoparticle systems also presented as a function of pH values. We then calculated the residual sum of squares and Pearson’s related coefficient at 6 h and 12 h release duration, respectively, as the residual sum of squares present a negative correlation with closeness of linear fitting, while the closer the absolute value of Pearson’s related coefficient to 1, the more linear it is. As shown in Table S2 and S3, the highest degree of linearity is the fitting of NPs6.0/100 nanoparticle systems, followed by the one of NPs7.5/80 at 6 h release.
Till then, we were so excited by the results that the method for precisely monitoring the pH values has been established, especially with the accuracy less than or equal to 0.1 pH value interval. That means, we have great possibilities to figure out the correlation between endo/lysosome pH values and the autophagy status, which is of great significance for better studying the autophagy mechanism and predicting the autophagy process. As we can see in Fig. S26, the MB release in HepG-2 cells have already reached the plateau after incubation for 4 h. Thus, we chose 6 h as the observation time point.
We then carefully investigated the MB release of NPs6.0/100 in 6 cell lines in the nanoparticle cell interaction duration of 6 h, including liver cancer HepG-2 cell line, colon cancer HCT8, HCT 15, and HCT 116 cell lines, lung cancer A549 cell line, and myomelanocytic cancer B16 cell line.
As shown in Table 2, we clearly differentiate the endo/lysosomes in 6 cancer cell lines, with the accuracy at 0.01 pH values, which is impossible to be done with the commercial intraocular pH indicator kits.
Moreover, we re-evaluated pH values in endo/lysosomes of the HepG2 cells before and after cultured with BPSi nanoparticles. We reached the conclusion that BPSi uptake significantly increases the endo/lysosome pH values, from 4.70 ± 0.09 to 5.59 ± 0.05, perfectly illustrating the reason for BPsi uptaken induced the autophagy initially then terminated the autophagy flux. The intracellular uptake of BPSi makes the quantities of the endo/lysosomes increased, which was consistent with the results of gene sequencing, that autophagy-related genes (TFEB-CLEAR) were activated. Meanwhile, the autophagy termination by the increased pH values in endo/lysosomes also coincide with the results of p62 proteins upregulation in Western blot study.
토론
Nanoparticles can generally cause autophagy in cells [23], and studies have shown that the autophagic response to nanoparticles presenting a neutral or anionic surface involves enhanced clearance of autophagic cargo. Cell exposure to nanoparticles presenting a cationic surface, on the other hand, results in transcriptional upregulation of the TFEB pathway, but also causes lysosomal dysfunction, ultimately resulting in blockage of autophagic flux [7]. And our results are in consistent with these previous conclusions. In our study, we found that the expression of autophagy-related genes and proteins in HepG2 cells has been increased after feeding of BPSi nanoparticles through transcriptome sequencing, RT-qPCR, and Western experiments. However, the expression level of autophagy-related P62 protein does not decrease as the autophagy is activated. We suspect that the PEG-amine on the surface of BPSi nanoparticles raises the pH value of the lysosome, resulting in inhibition of P62 degradation. Existing lysosomal pH indicators cannot verify our guess. To accurately measure the lysosomal pH of living cells, we established a new method for endo/lysosomes pH qualitative determination based on self-decomposable nanoparticle systems. Ten nanoparticle systems with specific MB/TEOS parameters were employed for obtaining optimized pH sensitively responsive measurement method. The radial MB concentration gradient from inner out served as a major driving force for MB release. The drug release proceeded with simultaneously carrier decomposition, which was driven by a diffusion-controlled mechanism. Moreover, as the pH value decreases, the hydrogen ion concentration increases, and the enhanced electrostatic interaction promotes inner MB to release faster than in neutral solution [24]. The optimized central hollow nanoparticle system could release the central concentrated MB as a linear function of precise pH values in the range of pH 4.0–4.8, which is exactly the pH of lysosomes. Finally, by this qualitative pH indicator based on self-decomposable nanoparticles, we have succeeded in the detection of the average pH values of lysosomes in 6 cell lines. Moreover, by this system, we can qualitatively differentiate the pH changes of lysosomes before and after BPSi nanoparticle endocytosis by HepG-2 cells, clarifying the mechanism of the autophagy occurrence and then termination after BPSi endocytosis. The self-decomposable nanoparticle systems pave a brand new way for studying the luminal pH values, providing new tools to know better of the cell signaling and metabolism, and then providing new ways and methods for the treatment of cancer [25, 26].
결론
In this study, we found that BPSi can promote cell autophagy through transcriptome sequencing, but the amino groups on the surface of the nanoparticles can increase the pH of the lysosome and inhibit the degradation of autophagic flow. Thus, the lysosome pH significantly influences the autophagy stages. And precisely acquiring the information of lysosome pH will promote the perceiving of autophagy. However, the existing fluorescent lysosomal pH indicators could only determine a wide range of lysosomal pH; thus, we established a precise lysosomal pH indicator based on the self-dissociation system. By adjusting the synthesis parameters of MB@SiO2 , the release of MB loaded on the nanoparticles was linearly and negatively correlated with pH. And the nanoparticles mainly stay in the lysosome after entering the cell. By measuring the amount of MB released in the cells, the pH value of the lysosome can be calculated exactly according to the linear function. The established precise pH indicator provided a brand new tool and methodology to precisely study the lysosome pH values and further acquire more information on autophagy.
데이터 및 자료의 가용성
이 연구 동안 생성되거나 분석된 모든 데이터는 이 출판된 기사와 추가 정보 파일에 포함되어 있습니다.