우리는 주파수 변조(FM) 전기장의 적용 시 마이크로/나노 입자에 가해지는 유전영동력을 공식화했습니다. 크로스오버 주파수 f를 커버하도록 FM 웨이브의 주파수 범위를 조정함으로써 X Clausius-Mossotti 요인의 실수 부분에서 우리 이론은 순시 주파수가 주기적으로 f를 횡단할 때마다 유전 영동력의 역전을 예측합니다. X . 사실, 우리는 FM파 유전영동(FM-DEP)을 겪는 소포, 백혈병 세포 및 적혈구의 주기적 U-턴을 관찰했습니다. 또한 FM-DEP로 인한 U턴의 비디오 추적은 fX . FM-DEP 방법은 30초 미만의 짧은 지속 시간이 필요하며 FM 파를 적용하여 여러 U-턴을 관찰하고 f를 측정하는 민첩성이 필요합니다. X 전기장에 의한 용매의 흐름을 최대한 억제하기 때문에 염성 세포 현탁액뿐만 아니라 나노 입자에도 많이 사용됩니다. f의 정확도 X 두 가지 유형의 실험을 통해 검증되었습니다. 먼저, 사인파 전기장의 다양한 주파수에서 교류 유전 영동(AC-DEP)을 경험하는 단일 소포에 가해지는 인력을 측정했습니다. 유전영동력의 주파수 의존성은 f를 산출합니다. X 힘이 사라지는 특성 주파수로. f의 AC-DEP 결과 비교 X FM-DEP 방법에서 얻은 결과로 fX 서로 일치하는 것으로 나타났다. 둘째, <>f의 전도도 종속성을 조사했습니다. X 주변 전해질을 변화시켜 세 가지 종류의 셀에 사용됩니다. 실험 결과에서 우리는 생물학적 세포의 단일 껍질 모델에 대한 정교한 이론을 사용하여 세포질 전도도와 막 정전 용량을 동시에 평가했습니다. 이들 세포에 대해 유사한 세포질 전도도는 이전 보고서의 범위보다 약간 낮았지만 얻은 막 정전용량은 이전에 문헌에서 보고된 것과 잘 일치했습니다.
<섹션 데이터-제목="배경">
배경
전기 표현형의 분극성은 주로 인가된 전기장의 주파수에 의존하는 세포막과 세포질의 전기적 특성 때문입니다. 따라서 비침습적 전기 기술을 사용하여 유전 스펙트럼의 차이로 개별 세포를 식별할 수 있습니다. 전기 기술은 현재 미지의 샘플에서 유용한 표현형을 가진 세포를 분리하는 데 적합합니다[1-15]. 다른 분리 방법과 비교하여 항체에 의한 세포 변형이나 이물질에 대한 부착이 불필요하여 이러한 프로브에 의한 세포 손상 또는 활성화 가능성을 피할 수 있다는 주요 이점을 제공합니다[1-16]. 세포 유전 특성의 특성화는 주로 임피던스 분광법[10, 12, 13] 또는 유전영동(DEP), 진행파 DEP(twDEP) 및 전기 회전과 같은 교류(AC) 동전기를 사용하여 수행되었습니다[1, 9, 15]. 그 중 AC 필드 대신 주파수 변조(FM) 파를 사용하여 유전체 특성화를 위한 새로운 방법을 개발하기 위해 AC-DEP 방법을 확장하는 데 중점을 둡니다.
일반적으로 DEP는 기울기 벡터뿐만 아니라 클라우지우스-모소티(Clausius-Mossotti)의 실수부( CM) 계수 [1–15, 17–21]. 예를 들어, AC 전기장 E에 의해 유도된 DEP 힘을 고려합니다. AC (r ,그 ) 그의 시공간 의존성은 E로 표현됩니다. AC (r ,그 )=A (r ) cosθAC (r ,그 ) 진폭 벡터 A 사용 (r ) 및 위상 θAC (r ,그 ). AC-DEP 힘은 진폭의 공간적 기울기에 의해 생성됩니다(즉, ∇A ) 위에 언급된 것처럼 CM 계수의 실수 부분을 곱한 반면 위상의 공간적 기울기(즉, ∇θAC )에 CM 계수의 허수부를 곱하면 twDEP 또는 전기 회전의 힘이 생성되므로 유전 특성 측면에서 AC-DEP 방법에 보완 정보를 제공합니다[9, 15, 20, 21].
이 편지에서 우리는 FM 필드에 의해 유도된 DEP 힘을 공식화하고 AC 및 FM-DEP 방법을 비교하여 AC 또는 FM 필드가 위상의 공간적 종속성을 고려하지 않도록 하는 것을 목표로 합니다. 따라서 θ를 설정합니다. AC (그 )=2πfAC그 적용된 주파수에 비례하여 fAC . AC-DEP의 중요한 특징은 힘의 방향과 강도가 fAC . 가장 주목할 만한 것은 힘 방향이 크로스오버 주파수 f에서 반전된다는 것입니다. AC =fX AC-DEP를 사용하여 유전체 특성화에 사용할 수 있는 것으로 밝혀진 CM 계수의 실수부의 부호 변화로 인해 [1–15].
AC-DEP 힘의 주파수 의존성은 또한 다음과 같은 조작을 가능하게 했습니다[1-15, 22-31]:전기적으로 제어 가능한 트래핑, 포커싱 및 콜로이드 입자의 변환, 그리고 생물 및/또는 생물의 분류 및 특성화 죽은 세포. 콜로이드 입자의 유전영동 조립 및/또는 조작을 위한 기존 시스템은 종종 집적 반도체 장치 제조의 최근 급속한 발전의 혜택을 받아 AC 전기장이 콜로이드 현탁액에 적용되는 미세가공된 전극을 사용했습니다 [24-30] . 비접촉 조작을 제공하는 이 기술은 현재 정확하고 반복 가능한 처리의 이점을 제공하는 다양한 랩온어칩 시스템과 통합되고 있습니다. 그럼에도 불구하고 AC 필드에서 고강도 스폿을 생성하는 온칩 전극은 광학 조작에서 자유롭게 위치할 수 있는 레이저 초점과 달리 샘플 홀더와 독립적으로 위치를 변경할 수 없습니다. 이전 DEP 방법은 광학 핀셋이 적합한 유형의 작업을 수행하는 데 약간의 어려움과 복잡성을 제시한 온칩 시스템의 한계로 인해 발생합니다. 이러한 어려움을 극복하기 위한 후보 방법은 광학 이미지 기반 DEP[32]입니다.
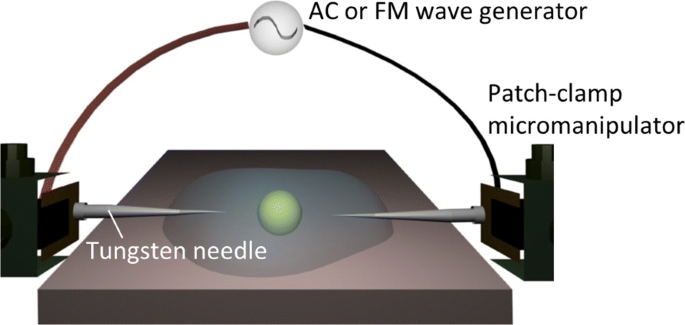
여기에서 주문형 유전 영동 조립 및/또는 광학 장치 없이 조작을 위한 전자 핀셋 기술[22, 23, 33-38] 중 하나를 더 간단한 대안으로 채택했습니다(그림 1 참조). 그림 1에서 볼 수 있듯이 플러그인 스타일 시스템은 콜로이드 현탁액에 외부 전기장을 적용하기 위해 미세 조작기로 제어되는 한 쌍의 미세 전극 바늘을 사용합니다. 전극 프로브는 고정된 것이 아니라 플러그인 스타일로 인해 콜로이드 현탁액에서 움직일 수 있습니다. 그러나 유전 특성화의 실제 사용에 대한 중요한 요구 사항이 남아 있습니다. 즉, 전기장이 염전해질로 둘러싸인 전지에 적용되는 기간을 최소화해야 합니다. 예를 들어, AC-DEP 방법은 다양한 주파수의 AC 필드가 세포 현탁액에 동시에 적용될 수 있도록 미세유체 시스템에 내장된 빗살 모양의 전극을 사용합니다. 이러한 정교한 온칩 시스템은 유전체 특성화와 관련이 있는 것으로 밝혀졌지만 다중 전극쌍 기술은 전자 핀셋 기술에서 자주 사용되는 단일 전극쌍 시스템에는 적용할 수 없습니다[22, 23, 33-38]. .
<그림>
실험 설정. 패치 클램프 미세 조작기로 제어되는 한 쌍의 전극 바늘을 통해 대상 입자에 적용된 AC 또는 FM 전기장을 보여주는 유전영동 조작 시스템의 개략도
단일 전극 쌍 시스템(그림 1)을 사용하여 동시 다중 주파수 측정을 수행하려면 인가된 전기장의 변화를 조사해야 합니다. 이 편지에서 우리는 다음 형식의 FM 파(FM-DEP)로 인한 시변 DEP의 가용성을 다룹니다.
fm 변조 주파수를 나타냅니다. Δ를 만족하는 광대역 FM을 사용합니다. f /fm ≫1, f의 조건이 m /f (그 ), fm /fㄷ , fm /Δf ≪1은 아래 주어진 이론 공식에서 광대역 한계(WBL)로 언급될 것입니다.
이 편지에서는 f의 특성 빈도 사이의 관계에 특별한 주의를 기울입니다. X 그리고 FM-DEP의 궤적. 다음 섹션에서는 사용된 재료와 FM-DEP를 유도하기 위한 플러그인 시스템의 세부 사항을 모두 설명합니다. 세 번째 섹션은 결과와 네 부분으로 구성된 토론을 제공합니다. 먼저, 변조 주파수 f에 의해 주기성이 설명되는 왕복 궤적을 정량화하여 단일 백혈병 세포의 반복 U-턴의 세부 사항을 조사합니다. m , 또는 f의 주기적인 진동 (그 ) 식에 의해 주어진다. (2). 다음으로, 순시 주파수 f에 따라 변조되는 시변 유전영동력을 유도하여 왕복 궤적을 이론적으로 설명합니다. (그 ) WBL 조건을 만족하는 FM 필드. 얻어진 유전영동력의 형태는 f를 결정하는 방정식을 제공합니다. X 관찰된 U턴에서. 셋째, AC-DEP의 인력으로 인해 전극침에 부착된 다층소포(MLV)에 대한 유전영동력의 크기를 측정합니다. 힘의 주파수 의존성은 CM 계수의 실수 부분에서 결정된 스펙트럼 방정식을 사용하여 피팅되었으므로 fX AC-DEP로 인한 인력이 사라지는 특성 주파수로 결정되었습니다. FM-DEP 방법도 f를 제공하기 때문에 X MLV의 왕복 궤적을 분석하여 AC- 및 FM-DEP에서 평가된 크로스오버 주파수 간의 일치 정도를 평가합니다. 마지막으로 세 종류의 세포에 대한 세포질 전도도와 막 정전용량을 모두 f에서 평가했습니다. X 용액 전도도의 증가 함수로서, 얻어진 값을 문헌에 보고된 값과 비교했습니다.
방법
자료
다중층 소포(MLV)를 준비하기 위해 Avanti Polar Lipids에서 구입한 1,2-dioleoyl-sn-glycero-3-phosphatidylcholine(DOPC)을 지질로 사용했습니다. MLV는 다음 절차에 따라 구했습니다. 클로로포름/메탄올(2:1 v)에 용해된 DOPC(1 mL, 20 mM) /v )를 N2로 건조했습니다. 가스를 제거하고 12시간 이상 진공에서 용매를 완전히 제거했습니다. 증발로 인해 유리병에 증착된 박막을 탈이온수를 사용하여 재수화하고 25°C에서 몇 시간 동안 인큐베이션했습니다.
실험에 사용된 2개의 세포주는 인간 T 세포 백혈병(TL)주의 JKT-베타-델과 인간 B 세포 백혈병(BL)주의 CCRF-SB였다. 두 종류의 TL 및 BL 세포는 5 % CO2 37에서 세포 농도가 0.5×10
6
범위 내에 있도록 ~ 1×10
6
세포/mL. 세포 배양을 위한 RPMI 1640 배지는 10% 태아 소 혈청 및 100mM 피루브산나트륨으로 보충되었다. 세포는 370g에서 원심분리에 의해 침전되었습니다. 세포가 피펫팅 전에 RPMI 1640 배지 1ml에 순수하게 재현탁될 수 있도록 3분 동안 두 번. 수득된 세포 현탁액을 필요한 전도도를 갖는 용매를 제조하기 위해 등장성 200mM 자당 용액을 사용하여 추가로 희석하였다.
우리는 또한 다음 현탁액에 분산된 인간 적혈구(RB) 세포를 사용했습니다. 갓 뽑은 전혈 샘플은 20대 초반의 건강한 지원자에게서 얻었습니다. RPMI 1640 배지와 헤마토크릿 3.1%의 혼합물에 현탁된 세포를 상기 백혈병 세포와 함께 필요한 전도도를 갖는 용매를 제조하기 위해 등장성 200mM 자당 용액을 사용하여 희석하였다. 인간 RB 세포를 이용한 유전영동 실험은 모두 전혈 샘플을 채취한 후 10분 이내에 완료되었습니다.
실험 설정
세포 현탁액의 전도도는 전도도 측정기(SevenMulti, Mettler-Toledo, Columbus, OH, USA)를 사용하여 측정되었습니다. 사용된 플러그인 시스템의 개략도는 그림 1에 나와 있습니다. AC 또는 FM파가 있는 외부 전기장은 임의의 파형 발생기(Agilent 33220A, Agilent Technologies, Santa Clara, CA, USA)를 통해 전류와 함께 적용되었습니다. 플러그인 형 미세 전극이 연결된 증폭기 (F30PV, FLC Electronics, Partille, Sweden). 미세 전극은 팁 직경이 0.5 μ인 텅스텐 바늘로 구성되었습니다. 두 세트의 패치 클램프 미세 조작기(NMN-21, Narishige, Setagaya-ku, Tokyo, Japan)에 의해 독립적으로 제어되는 m. 이어지는 모든 실험에서 팁 간격을 100 μ로 유지했습니다. 상기 서스펜션에 외부 자기장을 인가할 때 m이며, 최대 크기는 0.5kV/cm로 설정하였다. 바늘 쌍을 도립 광학 현미경(TE2000-U, Nikon, Nikon, Minato-ku, Tokyo, Japan)에 장착된 샘플 드롭에 삽입하고 CCD 카메라(Retiga Exi, QImaging, Surrey, British)를 사용하여 광학 현미경 사진을 얻었다. 25fps의 프레임 레이트로 캐나다 콜롬비아, 또한, 프레임 레이트로 인한 FM파의 주파수 분해능은 항상 각 데이터의 오차 막대 내에 있음을 확인하였다. 50- μ l 현탁액 한 방울을 도립 광학현미경의 샘플 스테이지에 올려놓았고, 열 조절기를 사용하여 온도를 25°C로 유지했습니다.
플러그인 기술을 사용하면 접촉 없이 좁은 채널로 밀어 넣고 원하는 방향으로 향하게 하는 것과 같은 단일 셀의 다양한 비접촉 조작을 간단한 시스템에서 수행할 수 있습니다. 등장액에서 세포를 소금으로 처리하는 것이 종종 필요하지만, 탈이온수로 둘러싸인 세포의 위의 DEP 조작을 구현하는 것이 가장 쉽습니다. 추가 파일 1:영화 S1~S3에서 플러그인 시스템은 탈이온수에 부유된 규조 세포의 AC-DEP를 유도했습니다. 추가 파일 1:영화 S1~S3에서 무염수에 분산된 이방성 규조류 세포가 AC 전기장(1kV/cm)이 인가된 한 쌍의 미세 전극에 의해 포스트잇 태그처럼 조작되었음을 알 수 있습니다. . 비접촉 작업은 세 단계로 구성됩니다. (i) 먼저 타겟 셀을 30kHz의 주파수에서 쌍극자 정렬과 각 미세 전극의 위치 변화의 조합으로 양전하를 띤 유리 벽에 평행하게 회전했습니다(추가 파일 1:Movie S1 ), (ii) 우리는 이후에 벽쪽으로 밀기 위해 주파수를 100kHz로 변경하여 음전하가 있는 요청 셀을 유리 표면에 정전기적으로 고정하고(추가 파일 1:Movie S2), (iii) AC 주파수를 조정했습니다. 20MHz까지 AC-DEP를 반대 방향으로 유도하여 정전기로 부착된 셀을 빼낼 수 있습니다(추가 파일 1:Movie S3).
결과 및 토론
FM-DEP를 경험하는 백혈병 세포의 실험적 관찰
우리의 플러그인 미세전극(그림 1 참조)을 사용하면 샘플 기판보다 훨씬 위에 떠 있는 입자에 전기장이 가해질 수 있으며, 이는 적절한 세포를 선택하는 데 실용적입니다. 예를 들어, 추가 파일 1:Movie S4는 미세 전극 쌍이 0.5초 간격으로 100kHz에서 500kHz 사이의 주파수 점프로 AC 전기장을 적용한 부동 삼각형 규조 세포에 접근하도록 제어되었음을 보여줍니다. 추가 파일 1:Movie S4에서 FM-DEP를 사용한 다음 조작에 앞서 예비 결과로 주파수 점프로 인해 미세 전극에서 삼각형 셀이 튀는 것을 볼 수 있습니다.
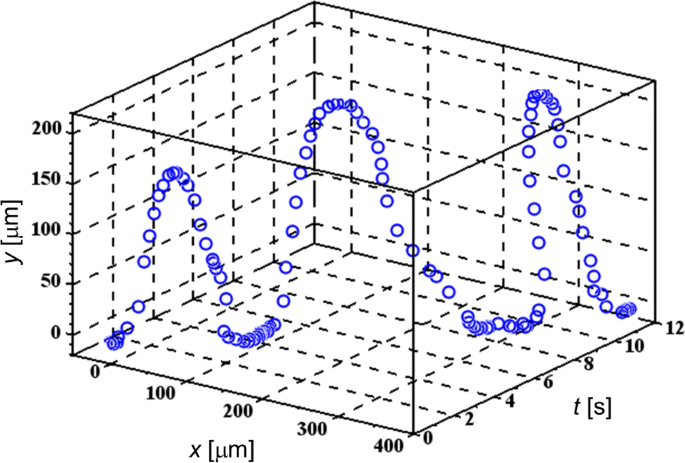
추가 파일 1:영화 S5 및 S6은 단일 전극 AC-DEP를 사용하는 전자 핀셋으로 조작되는 포유동물 세포의 것과 유사한 FM-DEP를 경험하는 여러 TL 세포의 일반적인 동작을 보여줍니다[36]. 그림 2는 (x ,y ) t를 따라 축, 여기서 (x의 상대 좌표 ,y )은 세포-전극 구성을 추출하기 위한 미세전극 바늘의 특정 지점에 위치한 (0, 0)의 원점으로 임시 세포 위치에 할당됩니다. x 동안 축은 (0, 0)에서 전극 표면에 대한 접선을 나타내며, y 접선에 수직인 축은 주로 아래에 설명된 주기적인 U턴의 투영을 반영합니다. 그림 2에서 변조 주파수가 f인 FM 전기장을 적용한 플로팅 TL 셀을 선택했습니다. mf로 설정 m =200kHz ≤f 범위에서 0.25Hz (그 ) ≤ 3MHz. 우리는 Δf /fm , f (그 )/fm <10
−5
, WBL 조건은 Eq. 뒤에 언급된 것처럼 실제로 유지됩니다. (2).
<그림>
표적 TL 세포의 3D 궤적. 주파수 변조로 인한 주기적 U-턴은 FM-DEP를 겪는 TL 셀에 대해 시연됩니다.
추가 파일 1:영화 S5 및 S6과 그림 2에서 주기적 궤적이 미세 전극에서 출발, 접근 및 체류의 세 부분으로 구성되어 있음을 알 수 있습니다. (i) 세포가 미세 전극을 떠남, (ii) 그것은 U-턴을 한 후 미세 전극에 접근하고 (iii) 미세 전극 표면에 머문다. 추가 파일 1:Movie S6에서 관찰될 뿐만 아니라 <x 방향은 Fig. 2와 같다. 용매 흐름의 간섭에도 불구하고 세포가 미세전극 표면을 떠나기 시작하는 순간과 주기적인 궤적으로 U-turn을 하는 순간을 각각 구별할 수 있다. 따라서 우리는 그림 2에서 이러한 U턴이 0.25Hz의 변조 주파수 또는 순시 주파수 f의 4초 주기와 일치하여 4초 간격으로 반복됨을 알 수 있습니다. (그 ).
FM-DEP에 대한 이론적 연구
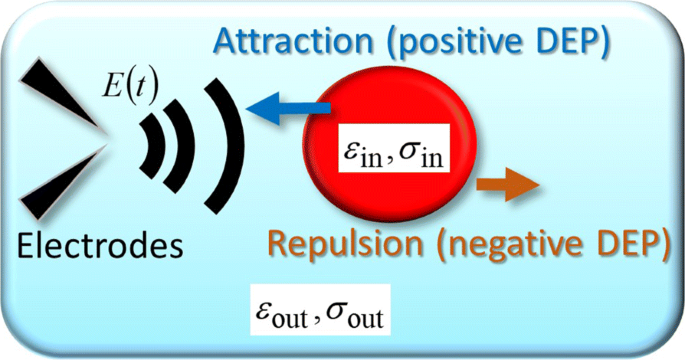
주기적인 U-턴을 포함한 실험 궤적을 설명하기 위해 구형 물체를 단일 셀의 단순화된 모델로 간주하며 임의의 시간에 따라 변하는 전기장 E (r ,그 ) 은 적용되다. 그림 3은 구형 물체에 작용하는 시간 종속 DEP 힘의 개략도를 보여줍니다[9]. 그림 3과 같이 구형체 내부의 유전율과 전도율은 ε로 표현된다. 안에 및 σ안에 , 각각 및 아래 첨자 "out", 예:ε밖 및 σ밖 , 외부를 나타냅니다. 일반적으로 FDEP (r ,그 ) 유도 쌍극자 모멘트 p와 관련이 있습니다. (r ,그 ) [17–19]
이론적인 모델. 유전율과 전도도가 ε인 균일 구 모델로 모델링된 셀에 가해진 FM-DEP 힘의 도식적 표현 안에 및 σ안에 , 각각. 구체는 유전율과 전도율이 ε인 전해질 매체로 둘러싸여 있습니다. 밖 및 σ밖 , 각각. 균일 구 모델은 세포를 막으로 둘러싸인 얼룩진 세포질로 간주하는 구형 단일 껍질 모델을 단순화한 것입니다 [9]
여기서 K하 및 Δτ 다음과 같이 정의됩니다. K하 =(ε안에 −ε밖 )/(ε안에 +2ε밖 ), 반경 R을 사용하여 \(\Delta \tau ^{-1}=\tau _{0}^{-1}-\tau ^{-1}\) 구형 물체와 τ의 두 가지 특성 시간 0 =(ε안에 −ε밖 )/(σ안에 −σ밖 ) 및 τ =(ε안에 +2ε밖 )/(σ안에 +2σ밖 ).
AC 전기장 대체 EAC (r ,그 )=A (r ) 코스(2πfAC그 ) 식으로. (3) ~ (5), 우리는 평균 DEP 힘 <F를 얻습니다. DEP (r ,그 )> AC 필드 [9, 15, 20]의 주기에 대해 평균을 낸 값:
여기서 ARMS 는 \(\boldsymbol {A}_{\text {RMS}}^{2}=\boldsymbol {A}^{2}/2\) 및 χ를 만족하는 제곱 평균 제곱근(RMS) 벡터를 나타냅니다. (fAC )≡2πR
3ε밖 재[K (fAC )] 적용된 주파수 f에 따라 다릅니다. AC Re[K로 인해 (fAC )], CM 계수의 실수부 [9, 15, 20]:
여기서 K엘 =(σ안에 −σ밖 )/(σ안에 +2σ밖 ) 및 K하 위에서 정의한 , 각각 저주파 및 고주파 한계의 실제 CM 값에 해당하며 이러한 한계 값 K엘 및 K하 , 반대 기호가 있어야 fXχ로 정의 (fX )=0이 존재할 수 있습니다[9, 15, 20].
방정식 (6) 및 (7)은 AC 전기장이 적용된 주파수 f에 따라 방향이 달라지는 DEP 힘을 생성함을 나타냅니다. ACχ를 통해 (fAC ) 식에 의해 주어진다. (7), 추가 파일 1:Movie S4에서 튀는 규조류 세포를 다음과 같이 설명합니다(그림 3 참조). 적용된 주파수가 CM 계수의 실수 부분의 더하기 기호를 제공할 때(즉, χ (fAC )>0), 한 쌍의 전극침을 통해 인가되는 교류장의 세기가 가장 큰 전극침 끝단(양의 DEP)으로 유인된 세포를 관찰할 수 있다. 실제 CM 계수의 부호는 f에서 음수로 바뀔 수 있습니다. X , 실제 CM 계수의 소실 주파수(즉, χ (fX )=0), 여기서 Eq. (6). CM 요인의 음의 부호(즉, χ (fAC )<0), 개별 콜로이드는 전극 바늘 쌍(음의 DEP)에서 반발됩니다. 추가 파일 1:영화 S2의 삼각형 규조류 세포는 주파수가 100 및 500kHz인 AC 필드에 의해 유도된 AC-DEP의 반대 방향으로 인해 바운스되었습니다. 식을 결합 (6) 관찰된 유전영동 방향, 우리는 χ (100kHz)>0 및 χ (500kHz)<0.
다음으로, 우리는 Eqs에 의해 주어진 위상을 연결하여 FM-DEP를 고려합니다. (1) 및 (2)를 식으로 (3) ~ (5). 추가 파일 2에서 입증된 바와 같이 FM파의 WBL 조건은 Eq.에서 적분의 대략적인 형태를 검증합니다. (5) 따라서
시간 종속 주파수 f일 때 AC-DEP와 같은 형태가 됩니다. (그 )는 f의 일정한 빈도로 대체됩니다. AC . 따라서 우리는 평균 DEP 힘 <F의 제한 형식을 얻습니다. DEP (r ,그 )> θ 주기에 걸쳐 평균화됨 (그 ) FM 필드(추가 파일 2의 식 (A1), (A13) 및 (A14) 참조):
식과 유사한 형태이다. (6) AC-DEP의 경우. 차이점은 χ의 계수가 {f (그 )}는 t에 따라 다릅니다. f를 통해 (그 ), T 주기로 주파수 변조에 따라 주기적으로 변경 m =1/fm .
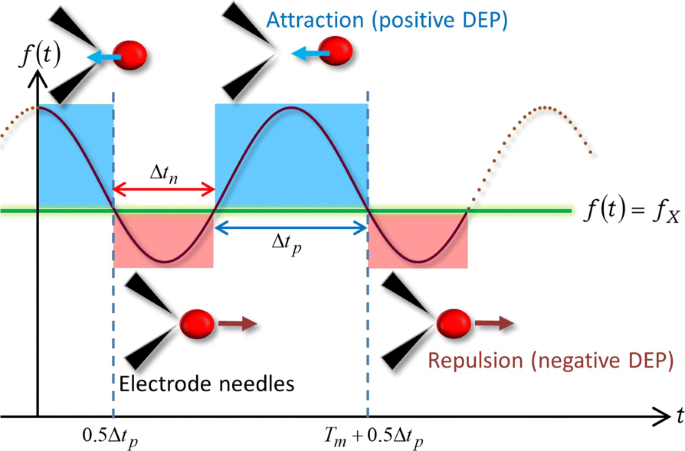
FM-DEP의 간단한 식 (9)를 바탕으로 FM파로 인한 위의 U턴 메커니즘을 그림 4와 같이 설명합니다. 그림 4는 f (그 ) 크로스오버 주파수 f를 다룹니다. Xfㄷ -Δf ≤fX ≤fㄷ +Δf . 그림 4에서 CM 요인의 실수 부분의 주파수 의존성 또는 χ {f (그 )}, 다음과 같이 대체 기호 변경을 제공합니다. 빼기 기호(χ {f (그 )}<0) f (그 )<fX 및 더하기 기호(χ {f (그 )}>0) f (그 )>fX , 우리 실험의 경우입니다. f를 만족하는 이전 기간 (그 )<fX 지속 시간이 있는 반면 후자는 <>f (그 )>fX 나머지 기간 동안 유지되었습니다. 한 주기는 그림 4에서 각각 빨간색과 파란색으로 표시된 두 개의 기간으로 분류됩니다.
<그림>
주파수 변조와 관련된 힘 방향. 시간 종속 주파수가 f인 FM파로 인한 주기적인 U턴의 그림 (그 ) 크로스오버 주파수 커버링 fX
AC-DEP와 유사하게 Eq. (9) 빼기 기호(χ {f (그 )}<0) f (그 )<fX . 결과적으로 세포는 전기장의 크기가 가장 큰 미세 전극 바늘 팁 주변 영역을 떠납니다. 세포는 Δ의 빨간색 기간 동안 음의 DEP를 경험합니다. 그n 4. t 순간 Xf의 솔루션으로 (그X )=fX , χ (f ) 사라지고 기호가 χ로 바뀝니다. (f )>0 동안 f (그 )>fX , 그리고 상응하게 DEP 힘은 t에서 인력으로 전환됩니다. X . t에서 유턴 후 X DEP 힘 방향의 반전으로 인해 표적 세포는 반대 방향으로 이동하는 미세 전극에 접근하기 시작하고 결국 전극 바늘의 끝 사이에 갇히거나 전극 중 하나에 부착됩니다. 세포는 동안 양의 DEP를 경험합니다. Δ의 파란색 기간 그p 그림 4는 T의 변조 주기로 미세전극을 떠나고, 접근하고, 머무르는 주기를 반복해야 함을 나타냅니다. m , 그림 2와 일치:Δ그n +Δ그p =티m . 따라서 그림 4에 묘사된 유전영동 메커니즘은 추가 파일 1:영화 S5 및 S6과 그림 2에서 관찰된 주기적인 U-턴을 설명할 수 있습니다.
방정식 f의 주기적인 해를 고려해 보겠습니다. (그X )=fX . 도 4에서 보는 바와 같이, tXt로 표현됩니다. X =n티m +0.5Δ그p =n티m +0.5(Tm -Δ그n ) n 정수 사용 =0, ±1, ±2,⋯,
지속 시간이 Δ인 경우 FM-DEP 방법이 크로스오버 주파수를 결정함을 명확히 합니다. 그n 미세전극 이탈부터 U턴까지 정밀하게 측정할 수 있습니다.
FM- 및 AC-DEP에서 결정된 단일 MLV의 교차 주파수 비교
우리는 Eq.의 실험 정확도를 조사했습니다. (11). 실험적으로는 생물학적 세포가 전해질에 분산되어야 하는 경우가 많습니다. 그러나 MLV의 경우 재수화 및 희석 준비 과정에서 탈이온수를 사용할 수 있습니다. 따라서 AC-DEP와 FM-DEP에서 결정된 크로스오버 주파수를 비교하기 위해 무염 MLV 서스펜션을 사용했습니다.
표적 MLV의 유전영동 U-턴은 10kHz ≤f 범위의 FM파에 의해 유도되었습니다. (그 )≤ 50kHz(즉, fㄷ =30kHz 및 Δf =20 kHz) fm =0.1Hz이고 이에 따라 FM-DEP는 10초 주기를 갖습니다. 실험에서 타겟 MLV의 몇 가지 U턴이 미세전극을 떠나는 것부터 접근하는 것까지 관찰하는 데 30초 미만이 걸립니다. From the trajectory, we obtained the mean leaving time that \(\overline {\Delta t_{n}}=5.8\pm 0.2\) s. Because the WBL condition applies to the present experiment satisfying that fm /Δf /fm , f <서브>, 나 /f (그 )<10
−5
, the crossover frequency was evaluated to be fX =35±1 kHz from substituting \(\overline {\Delta t_{n}}=5.8\pm 0.2\) s into Eq. (11).
For comparison, we made use of the programmable manipulator in the AC-DEP method that tries to evaluate the crossover frequency of the same targeted MLV to which the sinusoidal electric field with a frequency in the range of 30 to 100 kHz was applied via the electrode needle pair for inducing the AC-DEP. Because the programmable manipulator carries the electrode needle pair at a constant speed in one direction, we can measure the dielectrophoretic force similarly to the laser-trapping experiments [39]. Attaching the MLV on an electrode tip that undergoes uniform linear motion, not only the AC-DEP force but also the hydrodynamic force caused by the one-dimensional motion are exerted on the MLV. With the gradual increase of electrode velocity, FDEP eventually becomes smaller than the hydrodynamic force. As a result, the MLV initially attached to the moving electrode, owing to the DEP attraction, is desorbed by the hydrodynamic force. Defining the critical value, vㄷ , by the maximum velocity value of the microelectrode pair prior to the desorption, the force balance equation between the DEP and hydrodynamic forces reads [39]
$$ F_{\text{DEP}}(f_{\text{AC}})=6\pi\eta R v_{c}, $$ (12)
여기서 FDEP (fAC )e ≡<FDEP> with the unit vector e defined by \(\boldsymbol {e}=\nabla {\boldsymbol {A}}^{2}_{\text {RMS}}/|\nabla {\boldsymbol {A}}^{2}_{\text {RMS}}|\), η the water viscosity at 25 °C and 2R the diameter of the MLV.
Additional file 1:Movies S7 and S8 demonstrates the force measurement using the above AC-DEP method at the applied frequency of fAC =60 kHz. In Additional file 1:Movie S7, the velocity of the electrode pair controlled by the programmed manipulator is 110 μ m/s, which is lower than vㄷ; therefore, the MLV remains attached to one part of the electrode pair owing to the dielectrophoretic attraction. Additional file 1:Movie S8, on the other hand, shows the higher electrode speed of 120 μ m/s, under which the dielectrophoretic force becomes smaller than the hydrodynamic force that is exerted on the MLV, thereby desorbing the MLV from the electrode. Accordingly, vㄷ is evaluated to be 110 μ m/s ≤vㄷ ≤ 120 μ m/s, and we can calculate FDEP (60 kHz) using Eq. (12).
We can determine fX from the experimental results of FDEP at various external frequencies. Figure 5 shows the frequency dependence of FDEP , indicating that the DEP force experienced by the MLVs was reduced by lowering the applied frequency. It is found from Eqs. (6) and (7) that the fitting function of FDEP (fAC ) can be expressed as
Frequency dependence of FDEP . The FM-DEP force (FDEP ) as a function of external frequency (fAC ) of applied AC field where FDEP has been evaluated from Eq. (12), the balance equation between the FM-DEP and hydrodynamic forces exerted on a single MLV. It can be seen that FDEP is increased and saturated as fAC is higher, reflecting a typical behavior of the relaxation spectrum of the real CM factor. The solid line represents the best-fit result of Eq. (13)
Equation (13) is depicted by the solid line in Fig. 5 that has been fitted to the experimental data using the best-fit results of three parameters:L =−21.02 pN, H =19.03 pN, and τ =4.9 μ 에스. Substituting these results into Eq. (14), we evaluate that fX =34.15 kHz, which coincides with the result of fX =35±1 kHz evaluated from the FM-DEP method. The FM-DEP method is thus validated in terms of the consistency with the direct force measurement using the AC-DEP method.
Conductivity Dependencies of the Crossover Frequencies for Biological Cells
Let us return to the dielectrophoretic U-turns of biological cells mentioned in Fig. 2 to assess the practical reliability of the crossover frequencies when the FM-DEP method is applied to cell suspensions. Recently, an elaborate theory [40] has investigated, in more detail than before, the relationship between the homogeneous sphere model (see Fig. 3) and the single-shell model where the inner structure of cell is represented by a smeared-out cytoplasm surrounded by a membrane. As a result, the relation between fX and the suspension conductivity σout has been formulated using radius R of a cell, membrane capacitance Cm , and cytoplasmic conductivity σcyt [40]:
where fX 0 is the extrapolated value to the crossover frequency at σ =0 mS/m and will be treated as a fitting parameter herein. The elaborate treatment adds the squared term, the second term on the right hand side of Eq. (15), to the conventional linear relation which has mainly been used for evaluating Cm from fX [40–45]. Theoretically, it has still been claimed [40] that Eq. (15) is valid within a lower range of σout such that σout <10 mS/m; however, it should be better to include the squared term in the evaluation of Cm , considering that our range of σout is relatively high compared with previous results in the range of 10 mS/m ≤σout ≤ 100 mS/m [40–45]. Hence, we determined σcyt as well as Cm from fitting Eq. (15) to the experimental results of fX as an increasing function of σout .
There are three kinds of biological cell used:TL and BL cells of human leukemia and RB cells of three human volunteers. In all the experiments using any species of cell, the conductivities were within the range of 60 to 160 mS/m, and the modulation frequency was set to be 0.25 Hz. Regarding the instantaneous frequency, most of the experiments adopted the range from 100 to 1.5 MHz (i.e., fㄷ =800 kHz and Δf =700 kHz); exceptionally for leukemia cells, the frequency range was extended to 50 kHz ≤f (그 )≤1550 kHz (i.e., fㄷ =800 kHz and ΔfX =750 kHz) in the conductivity range of 60 mS/m≤σ ≤80 mS/cm because fX in this σ -range has been found to be lower than 100 kHz, and we were unable to observe the DEP U-turns in the range of 100 kHz ≤f (그 )≤1500 kHz. Both of these frequency sets satisfy the WBL condition of Δf /fm , f (그 )/fm <10
−5
as before.
Each time we measured the leaving times of cells dispersed in a suspension, we looked for an appropriate spot at which a few cells having a similar size could simultaneously experience the FM-DEP above the substrate, and the microelectrode tips were placed at the measurable position using the micromanipulator. We continued such scanning inside the cell suspensions until the FM-DEP trajectories of 10 cells were collected in total at a couple of appropriate positions. For each kind of cell, the measurement of 10 cells was repeated twice using different drops of the same cell suspension. As mentioned, it is indispensable for the implementation of the FM-DEP measurement at each spot to suppress the electrically induced solvent flows as much as possible. Hence, we traced only two cycles of the U-turn path so that the duration time of applying the electric field could be adjusted to be less than 10 s, and, correspondingly, the leaving time of each cell is given as the average of each trajectory, including the two U-turns. The mean leaving time \(\overline {\Delta t_{n}}\) of each cell suspension is thus obtained from averaging the leaving times of 20 cells. Particularly for human RB cells, we further averaged three sets of the mean crossover frequencies obtained for three RB cell suspensions of three human beings, supposing that cells of the same species are similar in Cm 및 σcyt as well as in R . The two-step averaging of Δ그n will be denoted by \(\left <\overline {\Delta t_{n}}\right>\). Substituting into Eq. (10) the experimental data of either \(\overline {\Delta t_{n}}\) or \(\left <\overline {\Delta t_{n}}\right>\), the mean crossover frequency <fX> was obtained.
Figure 6 shows the σout -dependencies of <fX> measured for the above three kinds of biological cells using the FM-DEP method. The solid lines in Fig. 6 depict the best-fit results of Eq. (15). We evaluated Cm 및 σcyt from the best fitting of Eq. (15) into which the observed radii (Robs ) were inserted. Table 1 lists the fitting results of Cm 및 σcyt , where we used the observed radii of 10 μ나 ≤ 2Robs ≤ 15 μ m for TL and BL cells, and 7.5 μ나 ≤ 2Robs ≤ 10 μ m for RB cells in evaluating Cm . It is to be noted from Table 1 that different species have different membrane capacitances, which are in good agreement with those reported in the literature [40–47]; the Cm values of RB cells with stationary whole blood samples from normal (healthy) donors are in excellent agreement with our value [46, 47], but are substantially higher than those of washed RB cells in isotonic buffered saline as noted in [47]. The best-fit results simultaneously provided cytoplasmic conductivities, which were consistently similar as seen from Table 1, but were slightly lower than the range of previous reports that 0.2 S/m ≤σcyt ≤1 S/m [40, 45, 48–51]. These results support that the FM-DEP method retains the practical reliability needed for the treatment of living cells.
Conductivity dependences of crossover frequencies. Mean crossover frequency, <fX>, of TL cells (blue triangles), BL cells (green diamonds), and RB cells (red circles) varying with increase of solution conductivity σout . The best-fit results of Eq. (15) are delineated by the solid lines
결론
Our theoretical treatment of the FM-DEP has mainly focused on the WBL condition. In this limit, we have proved theoretically that the direction of the FM-DEP force switches each time when the instantaneous frequency of the FM wave traverses the crossover frequency, thereby implying the periodic U-turns of micro/nanoparticles that undergo the FM-DEP. Two kinds of experiment have demonstrated the accuracy and reliability of fX obtained from the observed trajectories of MLVs and cells using our formulation of the FM-DEP (Eqs. (9) and (11)):While the fX evaluated from the FM-DEP of a single MLV coincides with that obtained from the force measurement of the same MLV experiencing AC-DEP, the conductivity dependencies of fX provide the membrane capacitances of various cells that are in close agreement with the literature values. In other words, it has been validated theoretically and experimentally that the FM-DEP in the WBL limit can be mimicked by the time-varying AC-DEP induced by the AC wave with its frequency changing continuously according to the periodic function of f (그 ). The simple view applies to other electrokinetics, including the twDEP and the electrorotation by applying the FM wave that has the spatial dependence of the phase as well as the magnitude. The AC- and FM-DEPs are associated with the real part of the dielectric spectra (or the CM factor), whereas the electrokinetics due to the spatial gradient of the phase reflect the imaginary part of the CM factor as mentioned before. Therefore, the application of the FM wave to either twDEP or electrorotation will be required for completing the dielectric characterization (the dielectric spectroscopy, in general) using the electrokinetics.
We have treated microparticles such as MLVs and cells for the precise tracking of particle trajectories. In these experiments, sedimented particles as well as floating ones have been observed; we need to increase the magnitude of electric field for inducing the DEP of the sedimented particles which are likely to be aggregated. Accordingly, we have used the plug-in system for applying the FM wave to a targeted particle floating above the substrate.
It is promising to further develop the FM-DEP method for smaller particles with their sizes of submicron to nanoscale, such as dispersed carbon nanotubes, thereby opening up the possibility of real-time spectroscopy using the FM-DEP as described below. When we apply the FM wave to the smaller colloids using the on-chip systems whose electrode configuration is designed to create a constant gradient of the applied electric field, the time-varying velocity vector v (그 ) of the FM-DEP caused by the time dependence of the FM-DEP force is ascribed to the variation in χ (f ) (or the real part of the CM factor):it is found from Eqs. (9) and (12) that
Hence, measuring the velocity vector v (그 ) of a submicron to nanoparticle could provide the frequency dependence of the real part of the CM factor directly, which would be nothing but the electrokinetic FM spectroscopy.