나노 입자의 나노 물질 구성과 혈액 내 단백질 흡착은 약물이 탑재된 나노 입자의 설계에서 매우 중요합니다. 나노입자(NP)와 단백질의 서로 다른 표면 성분 사이의 상호작용을 탐구하기 위해 우리는 세 종류의 풀루란 NP 중합체를 합성했습니다. 카르복실화 풀루란(CHSP). 풀루란 나노입자는 투석법으로 제조하였다. 동적 광산란을 사용하여 3개의 NP의 전하와 크기를 결정했습니다. 폴리머가 동일한 정도의 콜레스테롤 치환을 포함할 때 NP의 크기는 전하 그룹의 수에 의해 변경되었습니다. 제타 전위는 CHAP, CHSP 및 CHP에 대해 각각 + 12.9, - 15.4 및 - 0.698mV였으며 치수는 각각 116.9, 156.9 및 73.1nm였습니다. 등온 적정 열량계는 표면 전하가 다른 NP의 열역학적 변화를 결정하는 데 사용되었으며 적정에 대한 인간 혈청 알부민(HSA)의 영향을 조사했습니다. 엔탈피와 엔트로피의 변화는 NP와 HSA 사이의 상호작용을 보여주었다. 결합 상수(Kb ) CHSP, CHP 및 CHAP의 경우 1.41, 27.7 및 412 × 10
4
M
−1
, 각각 CHAP-HSA의 경우 양전하, CHP-HSA의 경우 충전되지 않은 전하, CHSP-HSA 복합체의 경우 음전하가 있습니다. 형광 및 원형 이색성 분광법을 사용하여 NP와 HSA 사이의 복합체화 후 단백질 구조 변화를 결정했습니다. NP 및 HSA 복합화는 단백질 α-나선형 함량 감소 및 펩티드 사슬 연장으로 구성된 복잡한 과정입니다. CHP NP는 HSA α-나선 함량이 가장 크게 감소했습니다. NP 및 HSA의 모든 화합물의 약물 방출 속도는 48시간 후 자유 약물 및 약물 부하 NP보다 유의하게 낮았습니다. 최고 및 최저 비율은 각각 CHSP-HSA 및 CHP-HSA에서 관찰되었습니다. 약물 방출은 나노입자에 대한 HSA의 흡착에 의해 크게 영향을 받았고, 나노입자의 크기와 표면전하는 이 과정에서 중요한 역할을 했습니다.
<섹션 데이터-제목="배경">
배경
소분자 항종양 약물이 탑재된 나노입자(NP)와 같은 나노 약물 전달 시스템은 약물 방출 특성과 표적화 효과를 지속 및 제어합니다. 나노입자를 이용한 표적 요법은 약물의 부작용을 크게 줄이고 약물 효능을 향상시킬 수 있기 때문에 종양 치료의 초점이 되었습니다[1,2,3].
약물이 탑재된 나노입자는 표적 부위에 도달하기 위해 혈액 순환, 조직 대 세포 경로, 세포 내 이동의 세 가지 경로를 통과해야 합니다[4,5,6]. 그들은 또한 표적 조직에 도달하기 위해 혈관 장벽을 극복하고 표적 세포에 도달하기 위해 세포막 장벽을 극복해야 합니다[7, 8]. 단백질 흡착 및 교환은 모든 NP의 경로에 관여합니다. 마지막으로 단백질이 흡착된 나노입자는 표적 세포에 도달하여 약물을 방출한다[1, 9].
인간 혈청 알부민(HSA), 지단백질, 글로불린과 같은 고농도 단백질은 일반적으로 약물이 로딩된 나노입자의 표면에 흡착되어 생체 내 방출 거동과 나노입자의 표적 위치를 변화시킵니다[10]. 흡착된 단백질의 수와 유형은 혈장 내 단백질 농도 및 나노입자의 친화성과 밀접한 관련이 있습니다[11]. 혈장 단백질 농도가 높을수록 NP의 표면 흡착이 커집니다[12]. 친화도가 높은 단백질은 친화도가 약한 단백질을 대체할 수 있다[13]. 따라서 나노입자의 표면은 고농도의 친화력을 가진 단백질이 차지하여 나노단백질 크라운을 형성하게 된다[14]. 나노 단백질 크라운은 NP의 생체 내 기능에 필수적입니다[15]. 예를 들어, 표면이 폴리소르베이트로 변형되면 나노입자는 혈액-뇌 장벽을 통해 약물을 뇌 조직으로 전달할 수 있습니다[16]. 소수성으로 변형된 다당류 나노물질은 체내에서 HSA와 상호작용하여 약물 방출 조절을 향상시킬 수 있습니다[17].
세포에 의한 나노입자의 흡수는 나노입자의 물리적, 화학적 성질, 나노약물 농도, 단백질 흡착, 세포 부착과 같은 다양한 요인에 의해 영향을 받는다[18]. 단백질 흡착의 유형과 양은 약물 방출 제어 및 표적화를 포함하여 NP의 기능에 영향을 미칩니다. 또한 입자 크기, 전하 및 표면 소수성과 같은 나노입자의 물리적 및 화학적 특성은 단백질의 흡착에 영향을 미칩니다[19]. NP의 특성은 생체 내 과정에서 그 운명을 결정합니다[20]. 소수성으로 변형된 다당류 폴리머와 같은 양친매성 고분자 물질은 나노 크기의 입자로 자가 조립될 수 있습니다. NP의 크기는 표적화 및 약물 방출 조절 기능에 중요한 역할을 한다[21]. 폴리머의 소수성 그룹은 NP의 핵 구조를 형성하는 원동력입니다. 소수성기의 치환도가 클수록 NP는 작아진다[22]. 카르복실기, 아미노기 및 그 유도체를 갖는 고분자 물질은 NP 자가조립에 관여하므로 NP의 크기에 영향을 미치고 표면 전하를 제공하여 반대 전하를 갖는 단백질에 쉽게 부착된다[23]. 표면 전하가 다른 나노입자는 단백질 흡착 능력과 생물학적 기능이 다릅니다[24]. 따라서 우리는 나노입자와 단백질의 서로 다른 표면 성분 사이의 상호작용을 탐구할 필요가 있습니다.
HSA는 혈액에서 가장 풍부한 단백질입니다. 그것은 외래 및 내인성 물질의 수송, 분배 및 대사에 필수적입니다. 많은 저분자 약물이 체내로 들어가 혈액 수송에서 HSA 약물 흡착제를 형성하여 약물의 약리학적 효과를 변화시킨다[25]. 약물이 탑재된 NP는 체내에 들어간 후 HSA와 결합됩니다. NPs의 복잡한 구조 때문에 흡착 특성이 소분자 HSA 조합과 다릅니다[26]. 예를 들어, HSA 분자에 대한 소분자 약물의 흡착은 빠릅니다. 그러나 NP에 대한 HSA 흡착은 느리고 복잡합니다[27].
약물 운반체로서의 CHP 나노입자는 오랫동안 연구되어 왔으며, 이는 약물 전달을 위한 우수한 나노물질을 보여주었다[28, 29]. 이전 실험에서 우리는 콜레스테롤 치환 정도가 다른 HSA와 풀루란 나노입자 사이의 상호작용을 연구했고, 콜레스테릭 소수성(CH) 변형된 풀루란(CHP)은 주로 두 가지 과정을 발견했습니다. HSA는 NP 표면에 빠르게 부착된 다음 천천히 삽입됩니다. NP의 소수성 코어 [30]. 소수성 상호작용은 CHP-HSA 복합체의 형성에 중요한 역할을 합니다[31]. 입자의 소수성과 쉘-코어 구조는 주로 NP와 HSA 상호작용 동안 알부민 형태의 변화에 책임이 있습니다[30].
이 연구에서 우리는 세 가지 NP, CHP, CH-변형 애니메이션 풀루란(CHAP) 및 CH-변형 카르복실화 풀루란(CHSP)을 제조했습니다. 그들의 구조와 특성은 푸리에 변환 적외선(FTIR) 및 NMR로 특성화되었으며 크기와 전위는 동적 광산란(DLS)에 의해 결정되었습니다. 등온 적정 열량계(ITC)와 형광 분광법을 사용하여 NP-HSA 복합체의 상호 작용 특성과 세 종류의 NP가 HSA 구조에 미치는 영향을 조사했습니다. 우리는 약물 전달 시스템의 미래 적용에 필수적인 NP-HSA 복합체의 특성으로 약물 방출에 대한 영향을 드러냅니다.
방법
자료
HSA는 Sigma Aldrich(St. Louis, MO, USA)에서 구입했습니다. 아니 ,N -Imidazole은 Shanghai stock solution biotechnology(Shanghai)에서 왔습니다. 에틸렌디아민, 숙신산 무수물은 Tianjin Star Chemical Reagent(Tianjin)에서 제공했습니다. 다른 모든 화학 시약은 분석 등급이었고 Changsha Huicheng Co.(Changsha, China)에서 제공했습니다.
CHP, CHSP 및 CHAP의 합성
CHP 합성
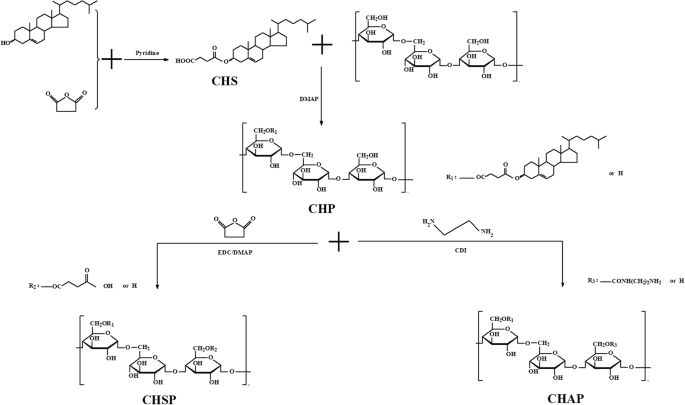
콜레스테롤 숙시네이트(CHS)는 이전에 설명한 대로 합성되었습니다[32]. 풀루란 다당류 2g을 DMSO(dehydrated dimethyl sulfoxide) 10mL 용액에 녹였다. 그런 다음, 1.06g CHS, 0.505g EDC·HCl 및 0.268g DMAP을 적절한 양의 DMSO 용액에 용해시켰다. 위의 두 그룹의 시약을 혼합하고 실온에서 1시간 동안 활성화한 다음 50°C의 가열된 오일 배스에서 48시간 동안 인큐베이션했습니다. 반응을 정지하고 상온으로 냉각시킨 후, 무수 에탄올 적당량을 가하고 교반하여 백색 고체를 석출시키고 흡인여과를 반복하여 얻었다. 생성물을 적당량의 무수 에탄올, 에틸 에테르, 테트라히드로푸란으로 세척한 후 50°C의 블라스트 드라이어에서 건조시켜 백색 고체가 되었다(Fig. 1).
<그림>
CHP, CHSP 및 CHAP 폴리머 합성
CHAP의 합성
1.80g CHP 및 1.00g N ,N -디이미다졸을 100mL DMSO에 용해시켰다. 50℃ 오일 배스에서 4시간 동안 가열 및 교반한 후, 3.60g의 에틸렌디아민을 첨가하고 24시간 동안 추가로 가열 및 교반하였다. 반응액을 상온으로 식힌 후 이중증류수로 4000차단 투석백에 1일 투석한 후 동결건조하여 소수성으로 개질된 애니메이션 풀루란의 생성물인 담황색 고체를 얻었다.
CHSP의 합성
1.80g의 CHP를 100mL의 탈수된 DMSO에 용해시킨 다음, 0.5g의 숙신산 무수물 및 0.05g의 4-디메틸아미노피리딘(DMAP)을 1시간 동안 활성화된 10mL의 DMSO에 용해시켰다; 50℃ 오일 배스에서 20시간 동안 가열 및 교반한 후, 반응을 중단시켰다. 반응액이 상온으로 냉각되면 적당량의 무수 에탄올을 넣고 교반하여 백색 고체를 침전시켰다. 백색 고체를 적당량의 무수 에탄올, 디에틸 에테르, 테트라히드로푸란으로 여러 번 세척하고 50℃의 블라스트 드라이어에서 건조시켰다. 얻어진 생성물은 소수성으로 개질된 카르복실화 풀루란 다당류였다.
FTIR 및 NMR 분광법
CHP, CHSP 및 CHAP에 대한 FTIR 스펙트럼은 FTIR 분광법(Nicolet NEXUS 470-ESP, Thermo Fisher Scientific, Waltham, MA, USA)을 위한 KBr 펠릿으로 얻었다. CHP, CHSP, CHAP의 화학구조는 500MHz로 확인
1
H-NMR, 용매로서 DMSO-d6 사용. CHP 중합체에서 콜레스테롤의 치환 정도는 alpha-1,4 및 alpha-1,6 글리코시드 결합과 메틸렌 피크 면적에 의해 결정되었습니다.
NP의 준비 및 특성화
CHP, CHSP, CHAP 나노입자는 투석법으로 준비하였다[33]. 간단히 말해서, CHP, CHSP 및 CHAP를 10mL DMSO에 용해시켰다. NP를 형성하기 위해 혼합 용액을 투석 백에 24시간 동안 주입하여 DMSO를 제거하였다. CHP, CHSP 및 CHAP NP의 용액을 멤브레인 필터(공극 크기 0.45m, Millipore, Boston, MA, USA)로 스크리닝하여 더 큰 응집된 CHP, CHSP 및 CHAP NP를 제거했습니다. 얻어진 입자의 크기 분포 및 제타 전위는 11.4 V/cm, 13.0 mA에서 DLS(Zetasizer 3000 HS, Malvern Instruments, Malvern, UK)에 의해 결정되었습니다.
ITC
CHP, CHSP 및 CHAP NP 용액에 일정 농도의 HSA 용액을 적하하고 ITC(VP-ITC, Microcal, Northampton, MA, USA)로 열 변화를 측정하였다. 0.9mM HSA의 양을 0.01mM CHP, CHSP 및 CHAP NP 적정 세포에 주입하여 20회 적정하였다. 첫 번째 드롭은 2μL이고 반응 시간은 180초였습니다. 나머지 방울은 한 방울당 10μL이었고 반응 시간은 210초였으며 온도는 25°C로 설정되었습니다. 열역학적 매개변수와 연결 곡선은 28회 적정으로 얻어졌습니다.
형광 분광기
HSA와 CHP 나노입자를 HSA 대 CHP의 분자비 3.6:1로 혼합하여 CHP-HSA, CHSP-HSA 및 CHAP-HSA 혼합물을 제조하였다. 얻어진 혼합물을 2mL EP 튜브에 넣고 24시간 동안 25°C에서 20rpm으로 진탕했습니다. 유리 HSA 및 NP-결합 HSA의 형광 스펙트럼 및 형광 강도(FI)를 형광 분광광도법(Shimadzu RF-4500, Japan)으로 기록하였다. HSA 분자의 트립토판 발색단은 280 nm에서 여기되었고 방출 스펙트럼은 290에서 450 nm에서 기록되었습니다. 여기 및 방출 슬릿 폭은 5 및 12 nm였습니다.
농도가 다른 7개의 NP 용액을 HSA 용액과 혼합했습니다. 혼합 용액을 9시간 반응을 위해 2mL EP 튜브로 옮겼습니다. 얻어진 샘플을 수집하여 파장 290-450 nm에서 형광 스펙트럼을 측정했습니다. 순수한 HSA 용액의 형광 스펙트럼은 Stern-Volmer 분석에 따라 결합 상수를 결정하기 위한 기준으로 사용되었습니다. 형광 소광 데이터는 개선된 Stern-Volmer 방정식[34]을 사용하여 분석되었습니다.
여기서 Kq Stern–Volmer의 담금질 상수, F0 및 F 소광제의 부재 및 존재하에서 342 nm에서의 형광 강도, 및 [Q ]는 소광제의 농도입니다.
원형 이색성 분석
CHP-HSA 복합체는 두 가지 다른 방법을 통해 준비되었습니다. 첫 번째 것(복합체 I)은 단순히 HSA와 CHP 용액을 혼합하여 준비했습니다. 두 번째 것(복합체 II)은 2mL EP 튜브에 보관되었으며, 이 튜브는 25°C에서 12시간 동안 20rpm으로 진탕 테이블에 놓였습니다. 유리 HSA 및 단백질에 첨가된 NP에 대한 원형 이색성(CD) 스펙트럼은 0.1cm 큐벳 셀이 있는 37°C에서 CD 분광계(JASCO J-810, 일본)를 사용하여 파장 200-250nm에서 기록되었습니다. HSA의 농도는 모든 샘플에서 1.0 mg/mL였습니다. HSA의 상대적 α-나선 함량은 다음과 같이 계산되었습니다[35]:
여기서 θ208 는 평균 잔류 타원율(deg cm
−2
dmol
−1
) 208nm에서 θ 타원율은 M입니다. HSA의 분자량, C HSA의 농도(mg/mL), L 는 큐벳 셀의 길이(cm), Nr HSA 분자의 아미노산 수입니다.
체외 약물 방출
Mitoxantrone(MTO)이 포함된 나노입자는 투석 방법으로 제조되었습니다[36]. 미톡산트론에 대한 표준 곡선은 UV 분광광도법에 의해 획득되었습니다. 약물 로딩 및 캡슐화 효율은 설명된 대로 계산되었습니다[33]. MTO 방출은 인산염 완충 식염수에서 투석하여 시험관 내에서 연구되었습니다. 간단히 말해서, MTO가 로딩된 NP(2 mg/mL) 용액을 바이킹 투석 튜브에 넣고 50 rpm의 공기조 셰이커에서 37 °C의 방출 매체에 대해 투석했습니다. 미리 정의된 시간에 릴리스 미디어를 수집하고 새로운 릴리스 미디어를 추가했습니다. MTO의 방출량은 608 nm에서 UV 분광광도법(UV-384 plus, Molecular Devices, USA)으로 측정하였다. 누적 출시 비율(Q %)는 이전에 설명한 대로 계산되었습니다[37]. 일정량의 HSA 용액(0.1mg/mL)을 투석관에 첨가하여 3가지 유형의 NP의 약물 방출을 확인했습니다.
<섹션 데이터-제목="결과">
결과
CHP, CHSP 및 CHAP 폴리머의 특성
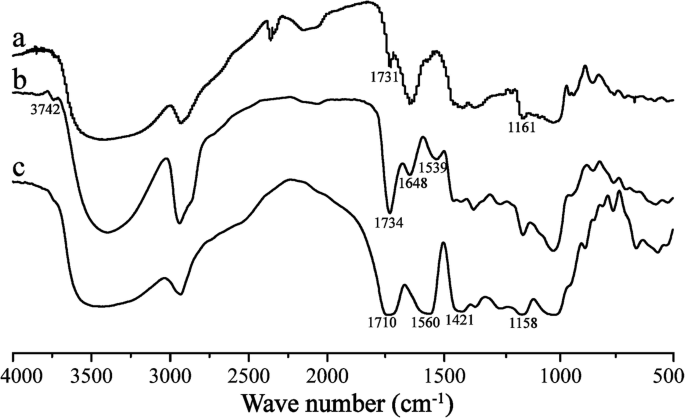
FTIR 스펙트럼
그림 2는 CHP, CHSP 및 CHAP에 대한 FTIR 스펙트럼을 보여줍니다. CHP 스펙트럼에 대한 데이터는 1731cm
−1
였습니다. (–C=O 신축 진동 피크) 및 1161cm
−1
(–C=O 신축 진동 피크). 이 결과는 풀루란에 에스테르 결합이 형성되었음을 보여주며, 이는 CHP가 성공적으로 합성되었음을 나타냅니다.
<그림>
CHP(a), CHAP(b) 및 CHSP(c)의 FTIR 스펙트럼
CHP 스펙트럼과 비교할 때 CHAP 스펙트럼의 데이터는 1648cm
−1
입니다. (–C=O 진동 흡수 피크), 1734cm
−1
(–C=O 진동 흡수 피크), 1539cm
−1
(–N–H 굽힘 진동 피크) 및 3742cm
−1
(–NH2 스트레칭 진동 피크). 이러한 특징적인 피크에 따르면 CHP에 아미드 결합이 존재하며 에스테르화 반응에 의해 CHAP가 성공적으로 합성되었다.
CHP 스펙트럼과 비교할 때 CHSP 스펙트럼의 데이터는 1710cm
−1
입니다. (–C=O 신축 진동 피크), 1158cm
−1
(–C=O 신축 진동 피크), 1560cm
−1
(double –C=O 커플링 진동 피크) 및 1421cm
−1
(–O–H 굽힘 진동 피크). 이것은 CHP에 카르복실기가 있었고 그 일부가 염이 되었음을 보여줍니다.
1
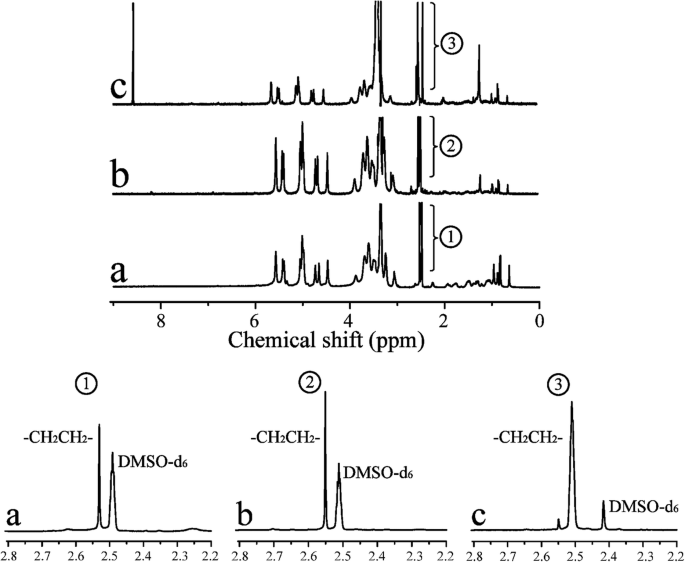
H NMR
그림 3은
1
을 보여줍니다. CHP, CHSP 및 CHAP에 대한 H NMR 스펙트럼. 총 0~2.40ppm이 콜레스테롤의 수소 신호에 속해 CHP의 성공적인 합성을 보여주었다. DMSO-d6의 특징적인 피크 및 메틸렌(–CH2 채널2 –)는 각각 2.49 및 2.53 ppm에서 신호를 나타냈습니다. CHAP는 CHP와 비교하여 8-9ppm에서 신호를 보여 아미노기에 속하며 에틸렌디아민이 CHP에 그래프트됨을 입증했습니다. CHP에서 포도당 100단위당 콜레스테롤의 치환 정도는 메틸렌 양성자 대 당 양성자의 비율로 다음 식을 사용하여 계산할 수 있습니다[38].
여기서 Aδ2.53 는 메틸렌(수소)의 특성 흡수 피크 아래의 스펙트럼 영역이고 Aδ4.74 그리고 Aδ5.01 는 각각 알파-1,6 및 알파-1,4 글리코시드 결합에 대한 특성 흡수 피크 아래의 스펙트럼 영역입니다.
1
에서 CHP의 H NMR 스펙트럼에서, 콜레스테롤 석시네이트(CHS)의 치환도는 4.50%였다. CHSP NP의 경우 메틸렌 그룹(–CH2 채널2 –) 숙신산 무수물과 CHS의 두 가지 측면을 포함합니다. 메틸렌기의 치환도는 12.34%였다(-CH2 채널2 –) 및 카르복실기의 경우 7.84%. CHAP NP의 경우 메틸렌 그룹(–CH2 채널2 –) 에틸렌디아민과 CHS의 두 가지 측면을 포함합니다. 메틸렌기의 치환도는 18.6%였다(-CH2 채널2 –) 및 아미노 그룹의 경우 14.1%입니다.
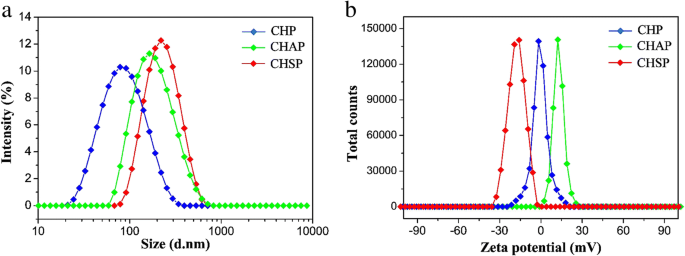
CHP, CHSP 및 CHAP NP의 속성
양친매성 고분자는 투석에 의해 자가 조립되어 친수성 껍질과 소수성 코어가 있는 코어-쉘 NP를 형성할 수 있으며, 여기에 항암제가 로딩되어 약물이 로딩된 NP를 형성할 수 있습니다. 표면 전하 및 크기와 같은 NP 특성은 약물 운반체로서의 치료 효능에 중요한 영향을 미쳤습니다[39, 40]. DLS에 의해 측정된 CHP, CHSP 및 CHAP NP의 크기 분포와 제타 전위는 그림 4에 나와 있습니다. NP의 평균 크기는 CHP, CHAP 및 CHSP에 대해 각각 73.1, 116.9 및 156.9 nm였습니다. 제타 전위는 각각 - 0.698, + 12.9, - 15.4 mV였습니다(표 1).
<그림>
제타 전위(a ) 및 크기 분포(b )의 CHP NP( ), CHAP NP( ) 및 CHSP NP( )
동일한 소수성 그룹을 가진 풀루란 NP의 경우 크기는 중성 CHP NP보다 음으로 하전된 CHSP와 양으로 하전된 CHAP에서 더 컸습니다. 따라서, 하전된 그룹은 NP의 자가 조립 거동을 방해하여 수용액에서 느슨한 구조로 더 큰 크기의 NP를 형성합니다. CHP NP, CHAP 및 CHSP NP의 제타 전위는 각각 - 0.698mV, + 12.9mV 및 - 15.4mV였습니다. 따라서 폴리머의 아미노기와 카르복실기는 표면 전하가 다른 NP를 생성하여 표면 특성을 변경할 수 있습니다.
열역학적 분석
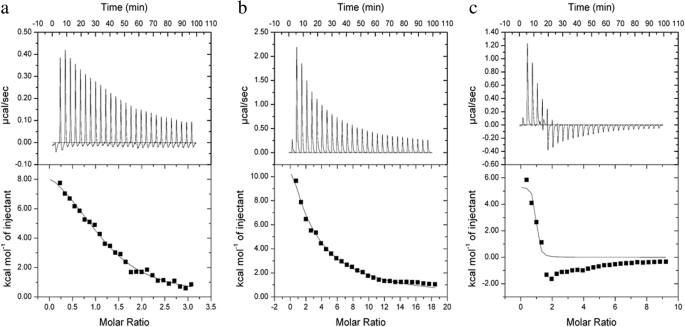
열역학적 분석은 CHP, CHSP 및 CHAP NP 용액으로 적정하는 HSA와 함께 ITC를 사용하여 수행되었습니다. 전하가 다른 풀루란 NP 용액에 대한 HSA 적정으로서 우리는 3가지 재료의 연결 특성, 연결 및 분자의 연결 수를 피팅하여 열의 변화를 결정했습니다. 등온 적정 온도계의 원래 스펙트럼은 열의 변화를 반영합니다. 위쪽 피크는 열 방출 반응을 나타내고 아래쪽 피크는 열 흡수 반응을 나타냅니다[41, 42]. CHP, CHAP 및 CHSP NP가 HSA로 적정되었을 때 조합에서 방출된 열은 시간이 지남에 따라 점차적으로 감소했습니다(그림 5). 전반적으로 HSA 용액 26방울을 CHP NP 용액에 적정했고 스펙트럼의 피크가 위쪽을 향하여 반응의 발열 특성을 나타냅니다. HSA 용액을 CHSP NP 용액에 적정한 경우에도 동일한 현상이 관찰되었다. 그러나 HSA 용액을 CHAP NP 용액에 적정했을 때 처음 4방울은 스펙트럼의 피크가 위쪽으로 나타났고 다섯 번째 방울에서는 피크가 아래쪽으로 바뀌면서 흡열 반응을 나타냈습니다. CHP 및 CHSP NP의 HSA 흡수는 발열성이므로 반응은 자발적이었습니다. CHAP NP의 HSA 흡수는 부분적으로 흡열성이고 부분적으로 발열성이며, 이는 CHAP의 양전하와 관련이 있을 수 있습니다.
<그림>
a로 HSA 적정을 위한 등온 적정 열량계 데이터 CHP, b CHSP 및 c 25°C에서 CHAP NP 세포(250μL)의 NP 농도는 12μM이고 주사기의 단백질 농도는 230μM입니다. 위쪽 그래프는 원시 데이터를 표시하고 아래쪽 그래프는 통합 열을 표시합니다.
엔탈피 값은 HSA와 NP의 조합에 의해 방출되는 열을 반영합니다. HSA에 의한 CHP, CHSP, CHAP NP의 엔탈피 변화는 각각 42.827, 80.3712, 22.3951KJ/mol이었다(Table 2). 엔탈피 변화, 발열 반응, 양친매성 NP의 화학 구조 및 HSA의 음전하와 결합하여 소수성 상호 작용은 주로 CHP 및 CHSP NP와의 HSA 상호 작용을 주도할 수 있습니다. 참고로 CHAP의 HSA 적정에서 열에는 음의 값이 포함되었습니다. HSA 분자는 NP의 소수성 중심과 결합할 수 있는 소수성 포켓을 포함하므로 [43], HSA와 CHAP의 처음 네 방울에 의해 촉발된 상호 작용은 주로 소수성 힘에 의해 구동됩니다. HSA는 음전하를 띠고 CHAP는 양전하를 띠지만 다섯 번째 방울부터 시작하여 반응의 흡열 특성으로 인해 HSA와 CHAP 사이에도 전하력이 있습니다.
엔트로피 변화의 값은 HSA와 NP 사이의 반응의 어려움을 반영할 수 있습니다. HSA 및 CHP, CHSP 및 CHAP NP의 엔트로피는 각각 0.251, 2.775 및 0.201KJ/mol K이므로(표 2), CHP 및 CHAP NP는 HSA에 더 쉽게 결합되는 반면 CHSP NP는 결합하기가 더 어렵습니다. HSA에 바인딩합니다.
HSA 및 CHP, CHSP 및 CHAP NP의 적용 범위는 각각 1.17, 0.404 및 0.845였습니다. NPs의 농도는 입자의 수보다는 폴리머의 농도를 기반으로 계산됩니다. 우리는 얼마나 많은 단일 폴리머 입자가 단일 NP를 포함하는지 알지 못하므로 각 NP가 HSA에 의해 얼마나 많이 흡착되는지 정확히 결정할 수 없지만 적용 범위 값을 기반으로 CHP NP가 HSA의 가장 높은 흡착을 갖는다는 결론을 내릴 수 있습니다.
이전 실험에서 우리는 선호도 값 KA , 는 NP와 HSA 사이의 결합력의 강도를 반영합니다[32]. CHP 나노입자의 소수성이 강할수록 친화도가 강해집니다[44]. HSA와 CHP의 결합 상수는 27.7 × 10
4
M
−1
, HSA와 CHSP는 1.41 × 10
4
M
−1
, 그리고 HSA와 CHAP는 412 × 10
4
M
−1
. 따라서 HSA와 양전하 CHAP의 조합이 가장 강하고 중성전하 CHP와 음전하 CHSP가 그 뒤를 이었습니다. HSA와 CHAP의 가장 강력한 조합은 소수성, 전하력의 상호 인력 및 아마도 HSA와 CHSP 사이의 상호 배타적인 전하 때문일 수 있습니다.
형광 분광기
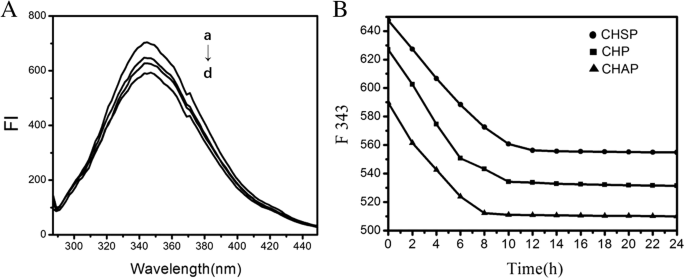
형광 스펙트럼을 사용하여 HSA와 표면 전하가 다른 세 가지 NP 간의 상호 작용을 연구했습니다. HSA는 585개의 아미노산 잔기를 포함하며, 214개(Trp214)에서 단 하나의 Trp 잔기를 가지며, 그의 형광 스펙트럼은 UV 영역에서 우세합니다. 다른 분자가 HSA와 상호 작용할 때 HSA와 다른 분자 간의 상호 작용에 따라 Trp의 형광 스펙트럼이 변경될 수 있습니다. 3개의 NP가 HSA와 혼합되었을 때 HSA 형광 스펙트럼의 최대 방출 피크는 화학적 이동을 겪지 않았습니다. 강도만 어느 정도 약화되었다(그림 6A). HSA가 CHAP NP와 결합할 때 HSA의 최대 방출 피크가 관찰되었습니다.
<그림>
A HSA에 대한 형광 스펙트럼(1.5 × 10
− 5
mol/L) (a) 및 (b) CHSP 포함, (c) CHP 및 (d) 동일한 농도의 CHAP NP 포함(4.2 × 10
− 6
정부). 나 시간 경과에 따른 343 nm에서 CHSP, CHP 및 CHAP NP를 사용한 HSA 방출 강도
실험적 연구에 따르면 HSA와 풀루란 나노입자를 결합하면 복잡한 과정이 나타납니다[45]. 우리는 3개의 NP를 HSA 용액에 추가했고 3개의 NP-HSA 복합체의 형광 강도가 점차적으로 감소한다는 것을 발견했습니다(그림 6B). HSA-CHSP는 12시간 후 556.3 nm, CHP-HSA는 10시간 후 534.3 nm, CHAP-HSA는 8시간 후 512.3 nm에서 평형에 도달했습니다. 다른 NP-HSA 복합체의 형광 강도가 균형을 이루는 데 필요한 시간은 NP가 운반하는 전하와 관련이 있습니다. 평형에 도달하는 데 필요한 가장 긴 시간은 음전하를 띤 CHSP-HSA에서 관찰되었으며 그 다음이 전하를 띠지 않은 CHP-HSA에서 관찰되었습니다.
3개의 NP-HSA 복합체의 초기 형광 강도의 급격한 감소(그림 6A 참조)는 NP와 HSA의 빠른 흡착 때문입니다. 후속 형광 강도는 NP와 HSA의 상호 작용이 느린 조합 과정이기 때문에 일정한 상태로 천천히 감소합니다. 일정한 형광 강도는 복합체의 포화 상태를 반영합니다. 3개의 서로 다른 전하를 띤 NP와 HSA 사이의 상호작용은 초기에 빠른 재결합 과정을 거쳐 나중에는 느린 재결합 과정을 거쳤다. 음으로 대전된 HSA와 음으로 대전된 CHSP의 조합은 충전되지 않은 CHP에 비해 복잡한 포화를 달성하는 데 더 오랜 시간이 필요했습니다. 음으로 하전된 HSA와 양으로 하전된 CHAP를 결합하면 복잡한 포화 상태에 도달하는 데 가장 짧은 시간이 필요했습니다.
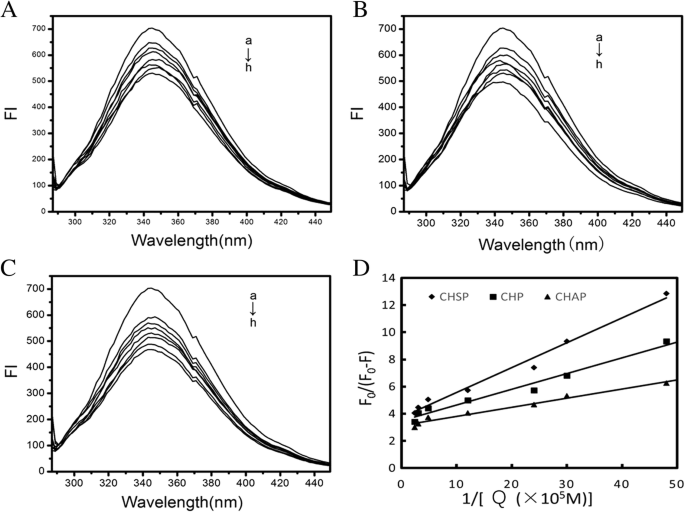
그림 7A-C는 NP-HSA 복합체를 형성하기 위해 다양한 농도의 CHSP, CHP 및 CHAP NP와 결합된 HSA의 스펙트럼을 보여줍니다. NP의 농도가 증가함에 따라 NP-HSA 복합체의 최대 흡수 피크가 감소하여 역상관을 보였다.
<그림>
HSA의 형광 스펙트럼(1.5 × 10
− 5
mol/L) CHSP(A 포함) ), CHP(B ) 및 CHAP(C ) 다른 농도에서 (a) 0, (b) 2.07 × 10
−7
, (c) 3.31 × 10
−7
, (d) 4.14 × 10
−7
, (e) 8.28 × 10
−7
, (f) 20.7 × 10
−7
, (g) 33.1 × 10
−7
, 그리고 (h) 41.4 × 10
−7
정부. 디 플롯(n =7) F의 경우 0 /(F0 − F) 대 1/[Q ], 질문 는 각각 CHSP(–◆–), CHP(–■–) 및 CHAP(–▲–)의 농도입니다.
여기서 f아 형광 물질과 소광제와의 접촉 분율, Kq 는 Stern–Volmer 담금질 상수, F0 는 소광제 없이 342 nm에서의 형광 강도, F 는 소광제를 사용한 342 nm에서의 형광 강도이고, [Q ]는 소광제의 농도입니다.
F의 기능적 이미지에서 0 /(F0 − F ) 쌍 1/[Q ], 우리는 f의 값을 얻을 수 있습니다 아 및 Kq 기울기와 절편(그림 7D)에서. Assuming that the observed fluorescence intensity changes mainly due to the interaction between NPs and HSA, the quenching constant can be seen as a binding constant for the formation of complexes. The binding constants for HSA and CHSP, CHP, and CHAP molecules were 2.02, 2.99, 4.72 × 10
5
M
−1
, 각각. In the previous study, we discussed the interaction between HSA and CHP NPs with different hydrophobicity substitutions [30]. The hydrophobic interaction between HSA molecules and CHP cholesterol played an important role in the formation of CHP–HSA. The greater the hydrophobic substitution of CHP, the greater the binding constant of CHP and HSA.
In the present study, we found that the value of the binding constant (Kb ) is related to the electrical properties of the NP. A surface with a positive charge, such as CHAP, has the largest Kb , and a surface without a charge, such as CHP, has the second largest Kb . The Kb for CHSP, with a negative charge, was the lowest. Therefore, in addition to the hydrophobic interaction between NPs and HSA, the electrostatic interaction between them also plays an essential part in the formation of NP–HSA complexes.
In addition, the f아 values for CHSP, CHP, and CHAP NPs were 0.269, 0.288, 0.38, respectively, so part of the Trp residue was involved in this reaction. Furthermore, the amount of HSA was too much at a given NP/HSA concentration, so free HSA molecules presented in the reaction system.
CD Spectrum Analysis
Figure 8A shows the CD spectra (a) free HSA, (b) CHSP–HSA, (c) CHAP–HSA, and (d) CHP–HSA in solution at 25 °C. The samples were complex I. There are two negative bands at 208 and 222 nm of the UV region in HSA spectra, which are the characteristic peaks of the α -helical structure. The α -helical content of free HSA was 55%. At the beginning of the complex, with the recombination of HSA and CHSP, CHAP, and CHP NPs, the α -helical content of HSA was reduced to 52.0%, 48.57%, and 48.0%, respectively.
A CD spectra for (a) free HSA, (b) CHSP–HSA, (c) CHAP–HSA, and (d) CHP–HSA in solution at 25 °C. The samples were complex I. B CD spectra for (a) free HSA, (b) CHSP–HSA, (c) CHAP–HSA, and (d) CHP–HSA in solution at 25 °C. The samples were complex II. ㄷ Ellipticity at 208 nm for HSA interacting with CHSP (–▲–), CHAP (–●–) and CHP (–■–) over time
Figure 8C shows that the ellipticity changes of the three samples at 208 nm over time. The ellipticity of HSA combined with CHAP and CHP NPs increased from 0 to 12 h and leveled off at 12 h, but that of HSA with CHSP NPs increased faster, i.e., the ellipticity increased from 0 to 9 h and leveled off at 9 h. Therefore, the ellipticity of the three samples gradually increased over time and the α-helical content gradually decreased; when the ellipticity maintained constant, the recombination of the sample and HSA was completed.
Figure 8C illustrates that the fastest surface absorption rate was presented on the combination of CHSP and HSA. The size, charge, and hydrophobicity of NPs can influence the migration rate of HSA to the center of NPs. The surface of CHP is not charged, the surface of CHSP is negatively charged, and the surface of CHAP is positively charged. Owing to the presence of the negative-charge mutual exclusion between CHSP and HSA, the resistance of HSA migrating to the CHSP NP center becomes larger. The traction of NPs on HSA is driven by the hydrophobic interaction forces. The traction of the three NPs on HSA is identical, so the lowest velocity of HSA migrating to the center of NPs was observed on the combination of HSA and CHSP NPs. Because the particle size is in the order of CHSP> CHAP> CHP, the particle density displays a reverse order, i.e., CHSP
The ITC results show that the amount of HSA migrating toward the center of CHSP NPs is the smallest but with the fastest speed compared with other types of NPs. Table 3 shows that the α-helix content of HSA migrating toward the center of CHP NPs was the lowest. The more the secondary structure of HSA was damaged, the faster the HSA migrated toward the center. The fastest speed was observed on HSA migrating to the center of CHSP NPs (Fig. 8C).
Figure 8B shows CD spectra for (a) free HSA, (b) CHSP–HSA, (c) CHAP–HSA, and (d) CHP–HSA in solution at 25 °C. The samples were complex II. After the complexation is completed, the α -helical content of HSA recombined with CHSP, CHAP, and CHP was reduced to 46.27%, 44.55%, and 42.91%, respectively (Table 3). With the increase in interaction time, the secondary structure of HSA was changed and the α -helical content was reduced during the process of complexation with NPs.
Drug Release
We measured the drug release rate of MTO with the three kinds of drug-loaded NPs and drug-loaded NP–HSA complexes. The drug release for free MTO was about 99.8% at 4 h (Fig. 9). The release rate in 48 h for CHP, CHAP, and CHSP NPs was 53.68%, 58.54%, and 63.24%, respectively. The drug release from all NPs was fast in the first 8 h, which was a burst release process, and the drug release remained stable after 12 h, which was a sustained release process. In vitro drug release from NPs is not affected by gastrointestinal pH and enzymes, and the dissolution of nanomaterials results in little drug release. The release is mainly determined by dissolution and diffusion [46]. The 48-h drug release rate was in the order of CHSP> CHAP> CHP, corresponding to the size of NPs. The fastest release rate was found on CHSP, which was negatively charged with the largest size. The second fast drug release rate was found on which was positively charged with the size smaller than CHSP. CHP was electrically neutral, and its drug release rate was minimal. Hence, the polymer surface groups involved in the formation of NPs affect the size of NPs and ultimately the drug release of NPs.
Mitoxantrone (MTO) release of pullulan NPs in phosphate-buffered saline (PBS) at 37 °C in vitro (□:free mitoxantrone, ○:CHP, △:CHAP, ▽:CHSP, ◁:CHAP–HSA,◇:CHP–HSA, ▷:CHSP–HSA)
The drug release rate from the combinations of HSA and CHAP, CHP, and CHSP in 48 h was 32.45%, 33.86%, and 35.76%, respectively. After the combination of NPs and HSA, the drug release in 48 h was significantly decreased as compared with HSA-free NPs, which was mainly attributed to the resistive effect and adsorption effect of HSA. At 48 h, the drug release of the compounds was in the order of CHSP–HSA> CHP–HSA> CHAP–HSA, while the drug release of HSA-free NPs was in the order of CHSP> CHAP> CHP. Although NP–HSA compounds showed significantly slow drug release, the total release of CHP-HSA decreased by 21.23% in 48 h, whereas the total release of CHAP-HSA decreased by 25.68% and that of CHSP-HSA by 28.48%. The drug release of the NPs is related to the size of the NPs and the polymer hydrophobic groups on NP surface. The adsorption of HSA can lead to significant slowdown in drug release, which is related to the hydrophobicity of NPs and also to the surface charge of NPs [46]. The adsorption of HSA is closely related to the size of the NPs and the degree of substitution of the hydrophobic groups of the polymer during the self-assembly process. Nevertheless, the drug release of the NPs is ultimately determined by the properties of the NP itself.
Discussion
As shown in Fig. 10, the formation of the NP–HSA complex is driven by a hydrophobic force between cholesterol groups of the particle core and the aromatic amino acid of the hydrophobic domain of HSA. After mixing, HSA interacts with the surface cholesterol unit and is rapidly adsorbed to the NP surface. Then, the adsorbed HSA on the NP surface is processed because of the hydrophobic forces derived from the cholesteric unit in the particle core. When overcoming the steric hindrance of polysaccharide chains in the NP shell, the adsorbed HSA gradually migrates to the core. After the hydrophobic interaction and resistance of the hydrophilic polysaccharide chain are balanced, the HSA molecule enters the particle core to become hydrophobically bound to cholesterol groups to form the NP–HSA complex.
Adsorption of HSA to NPs
For CHAP and CHSP NPs, the recombination of HSA is a complex process also subjected to the charge interaction with HSA under the traction of the hydrophobic driving force. The binding constants of the three kinds of NPs with the same hydrophobic substitution and different surface charge were in the order of CHAP> CHP> CHSP. The electrical properties also play a major part in the formation of NP–HSA. In this process, the formation of the CHSP–HSA complex was blocked by the structure of the NP shell and the repulsive force between the negative charges, which led to their loose connection. During the rapid adsorption and slow recombination, the degree of spiraling of HSA is lower for CHSP NPs than CHP NPs and CHAP NPs. Therefore, the surface charge of NPs not only changes the nature of the particles themselves but also affects the protein complex.
In the current study, we investigated the effect of NP surface charge on the interaction between NPs and proteins (Fig. 10). Three different charges of pullulan NPs with HSA adsorption still showed rapid adsorption and slow recombination. The number of HSA molecules with positively charged CHAP complex was the most, including rapid adsorption of NP–HSA by hydrophobic forces, HSA molecule migration to the center, and the HSA molecules adsorbed on the surface of NPs by charge action. CHP- and CHSP-adsorbed HSA molecules were mainly distributed in the hydrophobic center of NPs, with CHSP adsorbing fewer HSA molecules. The adsorbed number of HSA molecules is related to the hydrophobicity of NPs. The greater the degree of substitution of hydrophobicity, the more HSA is adsorbed [41]. The cholesterol substitutions of the three NPs were the same, and the number of HSA molecules adsorbed by positively charged NPs was the highest, so the adsorption of NPs and HSA was related to the hydrophobicity and surface charge of the NPs.
The surface adsorption capacity between NPs and HSA is also related to the hydrophobicity and charge of NPs. The binding force between HSA and NPs is determined by the hydrophobicity, surface charge, size, and structure of NPs. The α-helicity was decreased most at the beginning of adsorption and the complete CHP–HSA complex. CHP NP has the smallest size and highest density. The CHP NPs migrated toward the center by the hydrophobic traction; the sugar chain of the CHP NP shell was larger to inhibit the migration toward the center. The extension of the peptide chain of HSA is larger, with the α -helix decreased the most. Although CHAP NPs have hydrophobic and charge forces, they possess relatively large size, loose structure, small resistance in the periphery, small extension of the peptide chain, and small content of the α -helix. Some HSAs remained on the surface of NPs through the charge force of adsorbing, and the α -helical content is also smaller in this part of the HSA. The α -helix content of CHAP decreased less than that of CHP, mainly due to the peptide chain extension-induced central pulling force which led to α-helix content decline. During the process of the CHSP and HSA complexation, the role of the central pulling force has a reverse direction of the charge force, thereby resulting in weakening the center of the migration force. CHSP NPs are larger than CHAP NPs, and the structure of CHAP NPs is loose. Because the adsorbed number of HSA on CHAP is higher than that on CHSP, the decrease of α -helicity in CHSP is less than that in CHAP NPs. Therefore, the interaction between NPs and HSA and the decrease in α -helicity are all related to the size, density, hydrophobicity of substitution, surface charge of the NPs, and number of HSA connections.
After the NPs enter into the blood, protein adsorption affects the functions of NPs, such as the slow and controlled drug release, the travel from the blood circulation passing through the vascular barrier, targeting tissue, and entering cells. NPs interact with the HSA in the body and affect the in vivo behavior of NPs. The number of adsorbed proteins is closely related to the properties of the NPs. HSA adsorbs NPs, which affects the distribution in organs and removal of NPs, thereby altering the concentration of the drug in the body and the efficacy of the drug.
Finally, the properties of NPs, such as size, hydrophobicity, and surface charge, affect the drug release of NPs in vivo. We can design specific materials to perform specific functions with specific protein adsorption.
Conclusions
In this study, three kinds of nano-drug carriers were constructed, CHP, CHSP, and CHAP. The size, charge, drug loading properties of NPs, interaction between NPs and HSA, and drug release were all closely related to charge amount and charge type of nanomaterials. With the same degree of substitution of hydrophobicity, CHAP NPs with larger amino substitutions were the largest, CHSP NPs the second largest, and CHP NPs the smallest. The size and surface charge of the NPs were essential to the coverage of HSA, the binding constant, and the slow drug release. The positively charged CHAP binding constant was the strongest, showing the fastest drug release, and CHP NPs had the highest coverage. The combination of HSA further retarded the drug release of NPs. CHAP NPs adsorbed HSA had the slowest drug release rate.


 ), CHAP NP(
  ) 및 CHSP NP(
  )
)