미모사 테누이플로라 추출물을 사용한 금 나노입자 합성, 세포독성, 세포 흡수 및 촉매 평가
초록
식물 추출물과 금 나노 입자(AuNP)의 합성은 다양한 건강 응용 분야로 인해 생물 의학 분야에서 큰 관심을 받았습니다. 현재 작업에서 AuNPs는 Mimosa tenuiflora로 합성되었습니다. (Mt) 다른 금속 전구체 농도에서 껍질 추출물. Mt 추출물은 나무 껍질을 에탄올-물에 혼합하여 얻었다. 추출물의 항산화능은 2,2-diphenyl-1-picrylhydrazyl과 total polyphenol assay를 이용하여 평가하였다. AuNPs는 투과 전자 현미경, X선 회절, UV-Vis 및 푸리에 변환 적외선 분광법, 그리고 표면에 대한 작용기 측정을 위한 X선 광전자 분광법으로 특징지어졌습니다. AuMt(AuNPs와 Mt 분자에 의해 형성된 콜로이드)는 20~200 nm 크기의 다양한 모양을 나타냅니다. AuMt는 수소화붕소나트륨을 첨가하는 균일 촉매 작용에서 메틸렌 블루 분해에 대해 테스트되었습니다. 가장 작은 NP(AuMt1)는 0.008/s의 분해 계수를 가지며 190s에서 50% 분해에 도달합니다. . 인간 제대 정맥 내피 세포(HUVEC)에서 세포 생존율과 세포 독성을 평가한 결과 24시간과 48시간에서 중간 정도의 세포 독성 효과가 나타났습니다. 그러나 독성은 용량 의존적으로 행동하지 않습니다. HUVEC 세포에서 AuMt의 세포 내재화를 공초점 레이저 스캐닝 현미경으로 분석했습니다. AuMt1의 경우 물질이 세포질로 분산되어 있는 반면 AuMt2의 경우 물질이 핵 주변부에 집중되어 있음을 관찰할 수 있습니다.
소개
나노물질의 식물 매개 생합성은 원-팟(one-pot) 공정에서 나노입자 합성을 가능하게 하는 친환경적인 방법입니다. 식물 추출물의 동일한 생물 환원제가 독성 화합물의 비율이 낮은 형성된 입자에 대한 안정화제 역할을 하기 때문입니다[1,2,3]. 그런 의미에서 미모사 테누이플로라 (Mt) 수피는 4개의 플라보노이드 단위[4], 사포닌, 포도당, 알칼로이드(N ,N -디메틸트립타민), 전분 [5,6,7,8]. 이러한 화합물(축합 탄닌)은 금속 이온 환원제로 작용할 수 있지만 특히 플라보노이드는 금속 착물화와 관련이 있습니다[4].
Mt 에탄올 추출물은 그람 음성, 그람 양성 및 효모에 대한 항균제로 사용되었습니다[9]. 또한 항원충제(산의 잎과 꽃의 플라보노이드 사용)[10] 및 피부 재생[6]. 또한 Mt 나무 껍질의 분자와 폴리페놀에 기인한 특성이 있는 심각한 피부 궤양을 치료할 수 있는 잠재력이 있습니다[11]. 식물 추출물은 항산화제와 같은 특성을 나타내며 특히 Au, Ag, Fe, Pt, Pd, Cu, 이들의 합금 및 산화물과 같은 금속 나노입자의 녹색 합성에 사용되는 폴리페놀을 함유합니다[12, 13]. 표면 플라즈몬 공명(SPR)의 공진 주파수와 같은 NP 시스템의 광학적 특성은 나노물질의 고유 특성(크기, 모양, 유전 상수)뿐만 아니라 NP가 있는 용매인 NP를 둘러싸는 환경 특성에 따라 달라집니다. NP를 덮는 안정화 분자의 분산 또는 특성. 이 매개변수는 NP 시스템에서 SPR의 피크 위치를 정의하는 데 결정적입니다[14,15,16].
한편, AuNPs 촉매 특성은 살충제, 페놀 화합물 및 염료와 같은 유기 화합물 분해와 관련된 여러 연구에서 보고되었으며 [17,18,19] 환경 개선과 관련된 촉매 공정에 사용됩니다. 오염된 물을 청소하는 것처럼 [20]. 최근 몇 년 동안 블랙 카다멈[21]과 같은 식물 추출물과 메틸렌 블루(MB)[22], 메틸 오렌지[19] 또는 로다민과 같은 산업에서 사용되는 염료 분해의 촉매 활성 평가와 같은 식물 추출물로 합성된 AuNP에 대한 여러 보고서가 나왔습니다. B[23]. 그러나 반대 방향으로 일부 논문에서는 안정화 분자로 코팅된 NP가 유기 분자가 차지한 NP 표면의 촉매 작용에 사용할 수 있는 부위로 인해 낮은 촉매 활성을 나타냈다고 보고했습니다[24, 25]. 또한 AuNP는 독성 금속 이온의 비색 검출[7] 및 진단(치료 및 진단) 응용[26]과 같은 분자 센서로 사용되었습니다.
표면에 분자가 있는 기능화된 AuNP는 그 특징을 정의하는 구성, 두께, 조직 및 형태와 관련된 광학 및 생물학적 특성을 보여줍니다[27]. 나노기술은 혈류에서 AuNP의 응집과 같은 다양한 문제를 안고 있습니다[28]. AuNPs 농도가 20 μg/mL 미만이고 크기가 약 20 nm인 경우 건강한 세포주와 암 세포주에서 세포 독성 효과를 나타내지 않으며 이를 사용하여 나노입자와 세포 간의 상호 작용을 분석할 수 있었습니다[13, 29, 30]. 그런 다음, 나노기술은 세포 과정[32, 33]과 항균 특성[34]에 대해 학습할 수 있는 동일한 규모의 세포 수용체[31]에서 상호작용할 가능성을 제공합니다. 세포 독성 또는 항산화 방어 반응과 같은 다양한 효과 [35]. 또한 기능화된 AuNP는 약물, 유전자 또는 단백질[36] 및 생물의학 적용[37, 38]의 운반체 매개체 역할을 합니다. 더욱이 AuNPs 리간드는 단백질 및 폴리머로서 세포질, 핵에 도달하거나 막 너머로 빠져나가기 위해 NP 내부화를 선호하는 화학적 환경을 생성합니다.
이 연구에서 AuNP는 풍부한 폴리페놀 Mt 나무 껍질 추출물을 사용하여 합성되었습니다. AuMt 세포독성은 HUVEC 세포에서 평가되었고 세포 내재화는 24시간에서 공초점 현미경으로 모니터링되었습니다. 소듐 보로하이드라이드(NaBH4 존재 시 MB 분해에 대한 AuMt 촉매 활성) ) 실온에서 평가하였다. 우리의 결과는 "녹색" 방법으로 합성된 AuNP를 사용한 유사한 촉매 작용과 관련하여 비교되었습니다.
자료 및 방법
재료 및 화학 물질
AuMt 합성을 위해 Mt 나무 껍질 15 g을 조각으로 자르고 100mL 플라스크에 넣었습니다. 70ml의 에탄올(Fermont, 99% 순도)과 30 mL의 초순수(18 MΩ, Millipore)를 첨가한 다음 알루미늄으로 덮고 15 일 동안 실온에서 방치하였다. 용액을 Whatman 여과지(8 μm)를 사용하고 나중에 아크로디스크(0.20 μm)로 여과했습니다. 얻어진 용액을 AuMt 합성을 위한 환원제(Mt 추출물)로 사용하였다. 여액의 일부를 회전증발시킨 후 동결건조하여 DPPH 및 총 폴리페놀 분석 및 금강산 추출물의 검량선을 구성하였다. 금강산 추출물의 농도는 검량선에서 측정한 32.5 mg/mL였습니다. 테트라클로로금산(HAuCl4 , Sigma-Aldrich 99% 순도)를 금속 전구체로 사용하였다. 합성에 사용된 전구체의 농도는 AuMt1의 경우 5.3 mM, AuMt2의 경우 2.6 mM이었다. 환원제 부피는 일정하게(1.6 mL) 유지하였고, 총 부피 샘플은 초순수로 6 mL로 완성되었다. 추가 파일 1:표 S1은 AuMt1 및 AuMt2 합성에 사용된 제형과 각 반응물의 pH 값을 보여줍니다. 합성은 실험실 조명 조건에서 25 °C에서 수행되었습니다. 사용된 프로토콜은 다음과 같습니다. 50mL 튜브에 Mt 추출물 용액을 첨가한 다음 초순수를 첨가하고 마지막으로 금 전구체 용액을 첨가하고 즉시 3000 rpm에서 10 동안 와류에서 교반합니다. AuMtNPs의 합성은 혼합물의 착색 변화에 의해 몇 분 이내에 시각적으로 확인되었습니다. NPs clean 공정은 현탁액을 1 시간 동안 14,000 rpm에서 원심분리하고, 상층액을 버리고, 물을 첨가하고, 초음파 처리에 의해 분산시키는 과정을 2회 반복하는 것으로 구성된다. 에탄올을 첨가한 후, AuMt는 초음파 처리에 의해 다시 분산되고 1 시간 동안 14,000 rpm에서 원심분리된다. 상층액을 버리고 침전시키고 40 °C의 오븐에서 건조시킨다. 그러면, 얻어진 나노복합체는 표면에 Mt 추출물 분자가 있는 AuNP로 구성됩니다.
AuMtNP 합성의 시간에 따른 pH 변화
AuMtNP 합성의 pH는 반응을 진행하면서 측정하였다. 이를 위해 multi-parameter pH/Conductivity Benchtop Meter(Orion™ VERSA STAR™)가 사용되었습니다. 기기는 pH =4.01에서 보정을 위한 버퍼 참조 표준 용액을 사용하여 25 °C에서 보정되었습니다. 모든 측정에서 샘플의 온도를 25 °C(± 0.1 °C)로 제어하기 위해 재순환 수조를 사용했습니다. pH는 시약 혼합 직후 180 동안 반응을 진행하여 측정하였다. 동일한 장치가 반응물의 pH 측정에 사용되었습니다.
UV-Vis Spectra, 2,2-Diphenyl-1-Picrylhydrazyl(DPPH) 및 총 폴리페놀 분석
이중 빔 Perkin-Elmer Lambda 40 UV/Vis 분광계를 사용하여 200–400 nm의 측정 범위에서 240 nm/min의 스캔 속도로 추출물의 UV-Vis 스펙트럼을 얻었습니다. AuMt SPR은 250~875 nm 사이에서 모니터링되었습니다.
AuMt 형성 역학은 550nm에서 매초 흡광도를 측정하여 결정되었으며, NP 합성 반응은 자기 교반 하에 석영 셀 내부에서 진행되었습니다.
DPPH 분석의 경우 모든 테스트는 삼중으로 수행되었습니다. 다양한 Mt 추출물 농도(25, 12.5, 6.25 및 3.125 μg/mL)를 테스트했습니다. DPPH 용액(300 μM) 외에 100 μL의 에탄올을 각 농도의 100 μL에 첨가하였다. 이어서, 샘플을 517nm에서 흡광도를 측정하기 전에 암실에서 2시간 동안 배양하였다. 그 결과를 비타민 C와 카테킨(70 μmol/L)과 비교하였고 두 분자를 대조군으로 사용하였다. 소거 활성을 위해 에탄올에 용해된 DPPH 라디칼을 블랭크로 사용하였다[40, 41]. 청소 활동의 백분율은 Eq.로 계산되었습니다. (1).
여기서 샘플 샘플 흡광도 및 A 대조군 블랭크 흡광도입니다. 데이터는 Tukey 다중 비교 테스트와 함께 분산 분석(ANOVA)을 사용하여 분석되었습니다.
총 폴리페놀 분석을 위해 0.25 N의 Folin-Ciocalteu와 5%의 탄산나트륨을 추가하여 빛 없이 1시간 동안 배양하여 동일한 농도를 사용했습니다. 흡광도는 750 nm에서 측정되었습니다. 결과는 갈산 당량으로 표시됩니다[42, 43].
제타 전위 및 DLS 크기 결정
NP의 제타 전위(ζ)는 Zetasizer NS(Malvern, PA)로 측정하였고, 크기는 Zetasizer NS(0.5 nm의 분해능)의 동적 광산란(DLS)으로 측정하였다. 기기는 전기영동 이동도(μ)를 결정하여 ζ를 계산합니다. e ) 헨리 식을 사용하여 (2) [44]:
여기서 ε , η , 및 f (ka)는 각각 매질의 유전상수, 매질의 점도 및 Henry의 함수를 나타냅니다. 두 값은 일반적으로 f에 대한 근사값으로 사용됩니다. (ka) 결정, 1.5 또는 1.0. ζ의 전기영동 측정은 수성 용매와 적당한 전해질 농도에서 가장 일반적으로 이루어집니다. f (ka)는 이 경우 1.5의 값을 취하며 고전적인 Smoluchowski 근사, Eq. (3) [45].
샘플을 ζ에 대해 U자형 접힌 모세관 셀에 넣었습니다. 측정. 각 샘플은 실온(25 °C)에서 3회 측정되었습니다.
보충 배양 배지(s-DMEM)에서 NP 안정성 평가
AuMtNP 안정성은 DLS 및 ζ에 의해 s-DMEM에서 평가되었습니다. . 유체역학적 직경(2RH ) AuMt1 및 AuMt2의 농도는 37°C에서 초순수 및 s-DMEM에서 25~200 μg/mL 농도에서 측정되었습니다. s-DMEM의 AuMt1 및 AuMt2의 경우, 배양 배지가 NP 표면 전하를 수정하는지 확인하기 위해 ζ를 37°C에서 측정했습니다. s-DMEM이 미리 가열된 Eppendorf 튜브에 나노입자를 첨가하고 3000 rpm에서 30초 동안 와류에서 교반했습니다. 동일한 온도에서 측정하기 전에 37 °C에서 15 분 동안 배양합니다.
푸리에 변환 적외선 분광법(FTIR)
Mt 추출물 및 AuMt FTIR은 고체 샘플을 사용하여 Perkin-Elmer Frontier FTIR에 의해 얻었다. 스펙트럼은 2 cm
− 1
의 분해능에서 투과율 모드에서 획득되었습니다. , 4500 ~ 500 cm
−1
.
X선 광전자 분광법(XPS)
XPS 실험은 Perkin-Elmer(Model PHI 5100, Ag3d5/2 피크의 FWHM 기반 분해능 0.80 eV, XR 소스 이중 표준 양극(Mg/Al) 및 15 kV, 300 W, 20 mA)를 사용하여 수행되었습니다. ). 조사 스캔 분석은 0.5 eV/s의 스캔 속도로 수행되었습니다. 고해상도 분석을 위해 0.025 eV/s의 스캔 속도가 사용되었습니다.
투과 전자 현미경(TEM)
TEM의 경우 10 μL의 샘플을 폼바-탄소 필름(Electron Microscopy Sciences, 300 Mesh)으로 덮인 구리 그리드에 증착했습니다. 그리드를 1 시간 동안 건조시키고 12 시간 동안 진공 챔버에 둡니다. 전자현미경 장비는 200 keV에서 작동되는 전계방출 Jeol 2010 F이다. 에너지 분산 X선 분광법(EDS)은 펠티에 냉각 및 TEM 시스템에 결합된 검출기 Bruker Quantax 200입니다. 고해상도 TEM(HRTEM)에 의해 밝혀진 결정 평면의 면간 간격은 현미경 사진 디지털 분석(3.0 Gatan 버전)에 의해 결정되었습니다.
X선 회절
데이터는 다층 미러 모노크로메이터가 장착된 Bruker D8 QUEST 회절계 시스템과 CuKα Microfocus 밀봉된 튜브(λ =1.54178 Å). T에서 프레임을 수집했습니다. =스캔을 통해 300 K.
AuMt 세포독성 효과
AuMt 세포 독성 효과는 3-(4,5-디메틸티아졸릴-2)-2,5-디페닐테트라졸륨 브로마이드(MTT) 분석을 사용하여 HUVEC 세포에서 평가되었습니다. 세포는 37°C 및 5% CO2에서 10% 소태아혈청(GibcoBRL)이 보충된 Dulbecco의 변형된 Eagle 배지(DMEM, Sigma-Aldrich)에서 성장되었습니다. . HUVEC 세포는 Neubauer 챔버에서 계수되었고 생존력은 트립판 블루 배제 테스트(Sigma-Aldrich)에 의해 결정되었습니다.
MTT 분석을 위해 세포를 100,000 cells/mL로 조정하고 96웰 플레이트에 웰당 100μL를 넣었습니다. AuMt1 및 AuMt2는 200, 100, 50 및 25 μg/mL의 농도에서 평가되었습니다. 처리된 세포를 37 °C, 5%의 CO2에서 24시간 및 48시간 동안 배양했습니다. . 인큐베이션 시간 후, 플레이트를 인산염 완충 식염수(PBS)로 세척하고 MTT 용액을 첨가하고 4시간 동안 인큐베이션하였다. 디메틸 설폭사이드(DMSO)를 첨가하여 MTT 결정을 용해시켰다. 흡광도는 Gen5 소프트웨어를 사용하여 다중 모드 플레이트 판독기(Synergy HTX, BioTek)에서 570 nm에서 측정되었습니다. 세포 생존율은 식을 사용하여 계산되었습니다. (4):
데이터는 평균 ± 표준편차(SD)로 표시됩니다. 그룹 간의 상당한 차이는 Tukey 테스트, 적절하게 일원 분산 분석에 의해 분석되었습니다. 피 0.05 미만의 값은 통계적으로 유의한 것으로 간주되었습니다. Origin Pro 9.1 소프트웨어는 데이터 관리, 통계 분석 및 그래프 생성에 사용됩니다. 사용된 기호는 *p입니다. <0.05. 24시간 및 48시간 동안 처리(AuMt1 및 AuMt2)와 대조군의 성능을 비교했습니다.
살아있는/죽은 분석을 위해 HUVEC 세포를 유리 슬라이드에 접종하고 AuMt1 및 AuMt2로 처리했습니다. 24시간 인큐베이션 슬라이드 후, 제조사의 권장 사항에 따라 살아있는/죽은 생존력/세포독성 키트(ThermoFisher)를 사용하여 슬라이드를 염색했습니다. 샘플은 공초점 레이저 스캐닝 현미경(CLSM800, Carl Zeiss)으로 관찰되었습니다.
공초점 레이저 스캐닝 현미경:금의 형광
공초점 현미경 분석은 도립현미경 Axio Observer.Z1(Carl Zeiss, Jena Germany)에 장착된 LSM 800 장치(Carl Zeiss, Jena Germany)에서 수행되었습니다. 각각 최대 출력이 5, 10, 5 mW인 405, 488, 640 nm의 세 가지 레이저가 연구에 사용되었습니다. 고감도 GaAsP 검출기를 사용하여 형광을 수집했습니다. 명시야 이미지는 PMT(Photo Multiplier Tube)에서 투과된 레이저 광을 수집하여 얻었습니다. AuMt 형광, 살아있는/죽은 분석 및 HUVEC 세포 연구에 대한 NP 분포를 위해 Plan-Apochromatic × 40/0.95 건조 대물렌즈가 사용되었습니다. AuMt가 있는 3D 재구성 셀의 경우 Plan-Aprochromatic × 63/1.40 오일 대물렌즈가 사용되었습니다.
AuMt 형광 특성화를 위해 20 μL의 NP 콜로이드 분산액 한 방울을 커버 유리에 증착하고 CLSM에 의한 분석 전에 실온에서 건조했습니다. 640nm 레이저를 여기 소스로 0.5% 출력으로 사용하고 650~670 nm 사이에서 형광을 수집했습니다. 명시야 AuMt 이미지는 투과광 모드에서 488nm 레이저(전력의 0.2%)를 사용하여 형성되었습니다. 형광 및 명시야는 별도의 트랙에서 수집되었습니다.
셀룰러 내부화
HUVEC 세포에 대한 AuMt 내재화를 위해 핵을 4',6-디아미디노-2-페닐린돌(DAPI)로 염색하고 항-β 액틴 항체가 있는 액틴 섬유를 플루오레세인-5-이소티오시네이트(FITC)에 결합하여 세포 경계를 구분했습니다 . DAPI는 1.0% 전력에서 405nm 레이저로 여기되었고 FITC는 0.20%에서 488nm 레이저로 여기되었습니다. DAPI 및 항-β 액틴 항체의 방출은 각각 410 및 500 nm 및 500-700 nm 사이에서 수집되었습니다. AuMt는 640 nm 레이저(0.50% 전력)로 여기되었고 방출은 650에서 700 nm 사이에서 수집되었습니다.
3D 셀-AuMt 재구성 및 직교 투영은 Z-스택 모드(총 Z length =8 μm), 위에서 설명한 대로 DAPI, FITC 및 AuMt에서 형광을 수집합니다. 형광 신호는 각 Z에 대해 별도의 트랙에서 수집되었습니다. 위치. 명확성을 위해 FITC 신호는 3D 재구성에서 생략되었습니다.
나노 입자 세포 흡수의 상대적 비교가 실현되었습니다. 이를 위해 ImageJ 소프트웨어를 사용하여 공초점 이미지 분석을 통해 HUVEC 세포에서 AuMt1 및 AuMt2의 평균 형광 강도를 결정했습니다[48].
촉매
3.33 × 10
−5
농도에서 MB에 대한 촉매 활성 M은 UV-Vis 분광법으로 분석하였다. 균일 촉매 작용에서 90 μL의 NP(2 mg/mL)가 MB와 200 μL의 NaBH4를 포함하는 석영 셀에 직접 추가되었습니다. 100 mM의 농도에서. 샘플은 분광 광도계 셀 내부에서 자석 교반에 의해 균질화되었습니다. 반응은 25 °C에서 수행되었습니다.
결과 및 토론
합성
육안 검사에 의해 NP 합성이 두 시스템 모두에서 매우 빠르다는 것이 감지되었습니다. 추가 파일 1의 삽입에 표시된 AuMt1 시스템의 가장 강렬한 색상:그림 S1은 이 합성에서 더 높은 NP 함량을 나타냅니다. 이는 AuMt1이 AuMt2에 비해 두 배의 금속 전구체 농도를 갖기 때문이다. 추가 파일 1:표 S1에서 나노 입자 합성에 사용되는 시약은 산성 pH를 가지고 있습니다. 추가 파일 1:그림 S1은 AuMtNPs 합성이 수행될 때 반응의 pH 변화를 보여줍니다. 반응은 산성 환경(pH <2.65)에서 시작되며 나노입자 합성이 진행됨에 따라 산성도가 증가합니다. 이것은 Mt 추출물의 폴리페놀 분자에 존재하는 수산기의 탈양성자화 때문입니다. 사실, 이것은 탈양성자화된 수산기에서 Au
3+
로 전자를 이동시키는 산화물 환원 과정의 첫 번째 단계입니다. 이온. 산화물 환원 반응의 산물로 Au
3+
이온은 금속 원자 Au
0
로 환원됩니다. 2개의 전자를 제공하는 폴리페놀 고리가 산화됩니다. 이 과정은 추가 파일 1의 삽입된 부분에 설명되어 있습니다. 그림 S1.
UV-Vis 스펙트럼, DPPH 및 총 폴리페놀 분석
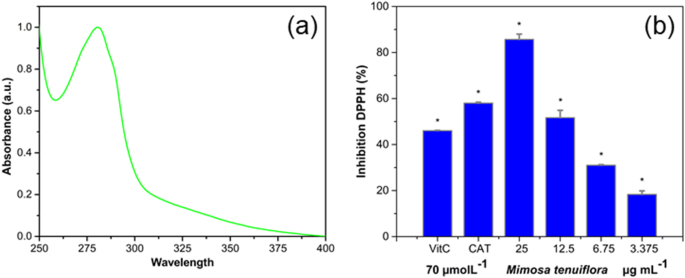
Mt 나무 껍질 추출물 UV-Vis 스펙트럼은 그림 1a에 나와 있으며, 여기서 신호는 280 nm에서 최대값과 50 nm에서 넓은 잘 정의된 대역으로 구성됩니다. 이 스펙트럼은 Rumex hymenosepalus에 대해 보고된 것과 매우 유사합니다. 폴리페놀 화합물의 함량이 높은 뿌리 추출물 [49]. Mt 나무 껍질 추출물의 폴리페놀 함량을 결정하는 것은 중요합니다. 그 이유는 이러한 분자가 AuNPs 합성에서 환원제로 크게 기여할 수 있고 Au
3+
환원에 필요한 전자를 제공할 수 있기 때문입니다. 이온에서 금속성 금으로(Au
0
). NP가 형성되면 폴리페놀 화합물이 표면에 흡수되어 나노물질에 안정성을 제공합니다.
<그림>
Mt 추출물의 특성화. 아 Mt 추출 UV-Vis 스펙트럼 및 b 일원 ANOVA 분석을 통한 DPPH 억제(*p <0.05)
DPPH 분석의 경우, 12.5 mg/L의 Mt 추출물에 대해 비타민 C와 카테킨에 대해 보고된 값(각각 46% 및 58%)과 유사한 50% 억제(L50)를 얻은 것으로 관찰되었습니다. 이것은 Mt 추출물이 대조군으로 사용된 순수 화합물과 매우 유사한 항산화 능력을 가지고 있음을 나타냅니다. 그림 1b에서 상당한 차이(*p 제어 값에서 <0.05)는 별표로 표시됩니다. 총 폴리페놀 분석에서 얻은 425 mg/g의 값은 추출된 질량의 거의 절반이 갈산과 동등함을 나타냅니다. Mt 추출물의 높은 항산화 능력과 높은 폴리페놀 함량은 지속 가능한 화학의 틀 내에서 좋은 환원제 및 안정화제 나노 물질 합성으로 사용될 수 있음을 시사합니다[50, 51].
특성화
Kinetics of Formation 및 UV-Vis Spectra AuMt
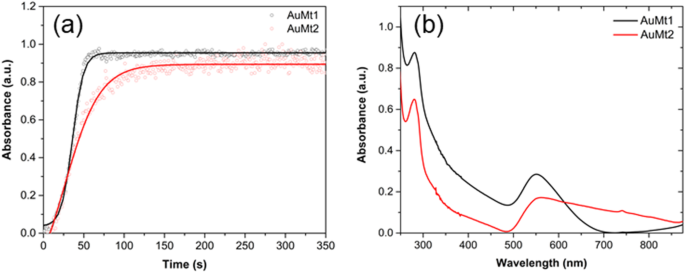
그림 2a는 나노물질 합성 반응이 일어날 때 AuNPs(AuMt1 및 AuMt2 각각 550 및 560 nm)의 SPR 피크에 대한 흡광도의 시간적 변화를 보여줍니다. 실험 데이터는 적어도 3단계의 성장이 관찰되는 Boltzmann의 S자형 함수[52]에 적합합니다. 첫 번째는 Au
3+
일 때 합성 반응이 시작될 때 흡광도가 천천히 증가합니다. 이온은 Au
0
으로 감소합니다. 그리고 결합하여 작은 NP를 형성하는 몇 개의 원자의 집합체를 형성합니다. 두 번째 단계에서 작은 NP는 자가 촉매 성장에 의해 크기가 증가하고 흡광도가 빠르게 증가합니다. 마지막 단계인 NP 재결정에서 흡광도는 정지기에 도달합니다. 그림 2에서 볼 수 있듯이 최대 흡광도는 AuMt1의 경우 60초, AuMt2의 경우 120초에 도달합니다. 흥미롭게도, 성장의 첫 번째 단계는 AuMt1의 경우 20초인 반면 AuMt2의 경우 거의 null(1초 미만)이며, 이는 금속 전구체에 비해 환원 분자(Mt 추출물)의 비율이 더 높기 때문에 설명됩니다. 이것은 AuMt1과 관련하여 AuMt2의 NP에서 핵의 빠른 형성을 선호합니다. 그럼에도 불구하고 NP의 다음 성장 단계는 AuMt2에 대해 낮고 더 큰 크기의 NP가 얻어진다. 안정화제로 maltose와 tween80을 사용하는 AuNPs 합성은 이 연구에서 보고된 것과 매우 유사한 반응 시간을 갖는 성장 동역학을 보인다고 보고되었습니다[53]. 또 다른 녹색 합성 보고서[54]에서는 환원제/전구체 제제의 비율이 가장 낮을수록 더 작은 크기의 NP가 생성된다고 지적하고 있습니다.
<그림>
AuMt1 및 AuMt2의 UV-Vis 특성화. 아 운동 형성 및 b UV-Vis 스펙트럼
그림 2b는 250–875 nm로 구성된 영역에서 AuMt의 특성 흡수 스펙트럼을 보여줍니다. AuMt1에 대한 SPR은 550 nm에서 최대 흡수와 200 nm의 넓은 대칭 밴드를 보여줍니다. AuMt2 플라즈몬 피크는 비대칭 밴드와 300 nm보다 큰 폭으로 560 nm에 국한된 약간의 적색 편이를 겪습니다. 이는 두 나노물질(dAuMt1AuMt2 )12 . 유사한 거동이 환원제로 시트라툼 나트륨을 사용한 AuNP 합성에서 보고되었으며, 여기서 적색 이동 및 플라즈몬 확장은 NP 크기를 증가시켜 소멸 단면에 영향을 미치는 더 높은 진동 모드에 기인합니다[55]. 또한 두 스펙트럼 모두 추출물의 폴리페놀 분자에 해당하는 280 nm에서 흡수 밴드를 보여 Mt 추출물이 AuMtNPs의 안정제 역할을 함을 시사합니다.
AuMtNP의 크기, 제타 전위 및 안정성
DLS 및 Z-전위에 의한 AuMtNP 크기는 표 1과 같이 한 농도(50 μg/mL)에 대해 서로 다른 조건에서 테스트되었습니다. AuMt1 및 AuMt2는 물에서 높은 음수 값(≤ 30 mV)을 보여 두 나노입자의 정전기적 안정성에 유리합니다. 시스템. Qu et al.에 따르면 [56], ζ 값은 NP 크기에 따라 점차적으로 증가합니다. 우리의 경우 AuMt1은 NP 합성에 의해 제어되는 크기인 물에서 AuMt2보다 작은 크기를 갖는다. 이 크기 값은 NP ζ와 일치합니다. 여기서 더 높은 ζ 값 NP 상위 크기에 해당합니다. 제타 전위(ζ s-DMEM에 분산된 AuMtNPs의 )은 초순수에서 얻은 값에 비해 음의 값이 적습니다(표 1). 이 감소는 정전기 상호작용의 감소를 유발하는 AuMtNP 표면을 덮는 DMEM 존재 양이온 및 FBS 존재 단백질에 기인할 수 있습니다. 그럼에도 불구하고 ζ 감소, 값은 두 시스템 모두에서 - 25 mV에 가깝게 유지되며 이는 나노입자가 s-DMEM 배양 후 정전기적 안정성을 보존함을 나타냅니다[57]. 또한 표 1은 AuMtNP 유체역학적 직경(2RH ) 초순수 및 배양 배지에서 37 °C에서 측정되었습니다. s-DMEM에서 두 시스템의 크기는 나노입자 표면의 단백질 흡착으로 인해 증가했습니다[58]. AuMt1의 경우 2RH의 성장 단백질로 인한 코로나는 33.8 nm이고 AuMt2의 경우 42.9 nm입니다. 나노입자 크기가 클수록 단백질 흡수 표면보다 클 것으로 예상된다[59]. 이것은 ζ의 약간 작은 값을 설명할 수 있습니다. AuMt2의 경우 s-DMEM의 AuMt1과 비교됩니다. AuMt1 및 AuMt2의 경우 s-DMEM 단백질과의 상호 작용은 나노 입자 표면에 부착된 추출물 분자 때문입니다. XPS 결과에서 볼 수 있듯이 이러한 분자는 AuMt1과 AuMt2 간에 약간 다릅니다. 또한 동일한 농도 범위에서 용액의 pH를 측정했습니다. pH에는 변화가 없고 평균값은 초순수에서 AuMt의 경우 약 7.5이고 s-DMEM에서 7.2인 것으로 나타났습니다(표 1).
추가 파일 1:그림 S2는 25~200μg/mL 농도 범위에서 37°C의 초순수 및 s-DMEM에 분산되었을 때 AuMtNP 유체역학적 직경을 보여줍니다. 각 연구 시스템에 대해 유체역학적 직경은 나노입자 농도에 따라 변하지 않으며 100μg/mL의 AuMt2 s-DMEM에 대해서만 입자 크기는 가장 낮은 평가 농도와 관련하여 증가합니다. 이는 이러한 농도에서 NP 응집 과정을 나타낼 수 있습니다. [32].
푸리에 변환 적외선 분광법(FTIR)
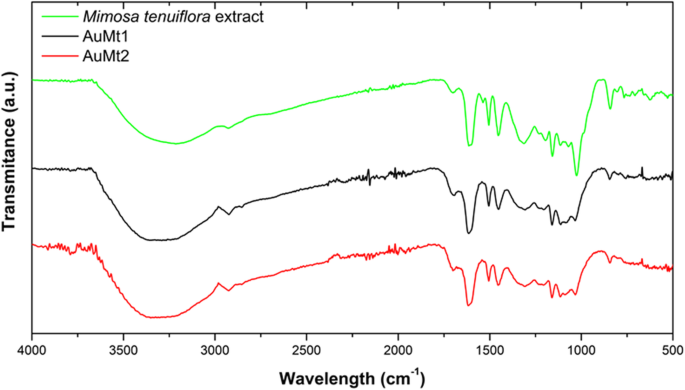
그림 3에 표시된 FTIR 스펙트럼은 Mt 추출물, AuMt1 및 AuMt2에 해당합니다. 3250 cm
−1
를 중심으로 하는 특징적인 광대역 주로 탄닌과 플라보노이드의 페놀성 OH와 관련이 있습니다. 1594 cm
−1
에서 피크 1705 cm
−1
에서 N-H 굽힘 진동에 해당 1000 ~ 1300 cm
−1
사이의 케톤 비순환 스트레칭 및 영역 CO 스트레치에. 1600 ~ 500 cm
−1
범위의 피크 폴리페놀로 식별되며 1235 및 1160 cm
−1
에서 신호 방향족 CO 결합 스트레칭과 관련이 있으며 1020 cm
−1
에서 지방족 CO 밴드 스트레칭 및 1235 cm
−1
에서 특히 에테르의 순환 특성과 관련이 있습니다. 이러한 신호는 Mimosa tannin, flavone sakuranetin, triterpenoids saponins, chalcones 및 N과 같은 Mt 추출물의 가장 풍부한 화합물과 관련될 수 있습니다. ,N -디메틸트립타민 알칼로이드(추가 파일 1:그림 S3). 시료 AuMt1과 AuMt2는 폴리페놀 영역에서 동일한 특징적인 피크를 보여 NP가 금강산 추출물 분자에 의해 안정화됨을 확인시켜준다[60]. 1331 cm
−1
의 변화를 관찰했습니다. AuMt1 및 AuMt2의 폭 밴드 및 피크 강도 감소는 AuNP와 폴리페놀의 C-H 그룹 간의 결합에 해당합니다. 1723 cm
−1
Au
3+
가 환원되는 동안 폴리페놀이 카르복실 화합물로 산화되어 이동합니다. Au
0
으로 [51, 61, 62].
<그림>
FTIR 스펙트럼. Mt 추출물(녹색), AuMt1(검정) 및 AuMt2(빨간색)
X선 광전자 분광법(XPS)
AuMt1 및 AuMt2에 대한 XPS 조사 스캔 분석에서 샘플은 산소(O 1s ), 탄소(C 1s ) 및 금(Au 4f ), 피크는 그림 4a, b와 같이 각각 532, 284 및 85 eV를 중심으로 합니다. 고해상도 XPS 실험은 AuNP 표면을 코팅하는 분자의 다양한 작용기의 상대적인 풍부함을 확립하기 위해 이루어졌습니다. Au4f AuMt1 및 AuMt2에 대한 고해상도 XPS 스펙트럼은 3.7 eV로 분리된 두 개의 대칭 피크로 구성됩니다(그림 4b, e). 4f와 관련된 피크 5/2 spin-orbital coupling are located on binding energy (BE) of 88.6 and 87.7 eV for AuMt1 and AuMt2, respectively. For 4f 7/2, spin-orbital coupling peaks are located on 84.9 and 84.0 eV. The link of intensities (I4f7/2 > I4f5/2 ) and location and separation (ΔBE = 3.7 eV) between peaks confirm that gold ions (Au
3+
) are reduced completely to metallic gold Au
0
[63]. Au4f signals, for AuMt1, are slightly shifted (~ 0.9 eV) at higher energies with respect to sample AuMt2. This can be explained in terms of NP size differences between samples. AuMt1 has a half population of NPs with size less to 40 nm, while AuMt2 NPs have a mean diameter of 150 nm, determined by TEM. Peak shift for Au4f signals, due to the presence of small NPs, has been reported by other authors who relate the Au4f BE increase with decreasing NP size [64, 65]. Also, the shift effect could be due to the interaction of functional groups capped on surfaces of AuNPs [66]. In Fig. 4c, f, the high-resolution XPS spectra of C1s are shown for AuMt1 and AuMt2. Spectra were deconvoluted by 3 Gaussian bands associated with C=O, C–O, and C–C or C=C. For AuMt1, peaks are centered on 286.9, 286.1, and 284.5 eV, for AuMt2 on 287.0, 286.3, and 284.7 eV, respectively. Comparing the experimental XPS curves for C 1s , we see appreciable differences between AuMt1 and AuMt2. The main difference comes from a significant decrease in AuMt1 of the signal associated with C–O group. Comparing the percentage contributions of each group, obtained from the deconvolutions (Additional file 1:Table S2), we see that in AuMt2 contribution of C–O signal is 27.8% while in AuMt1 is 16.6%. This difference can be explained in terms of the oxide-reduction reaction that gives rise to the process of AuNP formation. The synthesis of AuMt1 is added twice the metal precursor (HAuCl4 is 0.01 M) than in synthesis of AuMt2. In both cases, the same amount of extract is used as a reducing agent, so in AuMt1, more hydroxyl groups (−C–OH) are consumed to reduce a greater number of Au
3+
ions. Thus, a decrease of C–O signal in AuMt1 confirms that hydroxyl groups participate in the synthesis reaction. High-resolution XPS of O 1s revealed that carbonyl C=O is the most abundant group (Additional file 1:Figure S4 and Table S2). In addition, the content of the C=O group is higher in the AuMt1 sample, which confirms what was previously discussed.
XPS spectra of AuMt1 and AuMt2. 아 , d Survey spectra, b , e Au4f high resolution, and c , f C1s high resolution
XPS and FTIR indicate that AuMtNPs interact mainly with carbonyl groups (ketones) in addition to hydroxyl groups of Mimosa tannins, saponins, and other molecules that participate in the reduction of Au
3+
Au
0
으로 and stabilization of AuMtNPs [63, 67, 68].
Transmission Electron Microscopy
AuMt1 TEM micrographs are shown in Fig. 5a, b and AuMt2 in Fig. 5d, e showing products’ shape distribution. AuMt1 has the biggest diversity in shapes. AuMt shape is determined by the relationship between the variation of metal precursor concentration and Mt extract at a fixed concentration. In this case, NPs were observed without cleaning the extract to observe the interaction that forms around the AuMt. As observed in the micrographs, an extract is placed on the surface; however, NPs are kept dispersed and no aggregation is shown. Figure 5c, f show size distribution for each sample, and AuMt1 have an average size dispersion of 40 nm and AuMt2 of 150 nm.
Size distributions by TEM. 아 , b , ㄷ AuMt1 and d , e , f AuMt2
In Fig. 6a, AuMt TEM micrographs were also analyzed by EDS (Fig. 6b), which showed Au presence. Other chemical elements such as Cl, O, and Ca, on EDS spectrum, come from the extract that surrounds NPs. According to the crystallographic tab (JCPDS file:04-0784), the obtained distances between 2.35 and 2.03 Å (Fig. 6c) correspond to Au crystalline planes (111) and (200).
Nanostructural characterization of AuMt. 아 TEM, b EDS, c single HRTEM, and FFT and d XRD
X-ray Diffraction (XRD)
Figure 6d shows the characteristic AuMt XRD diffraction peak at 2Ɵ , which are in 38.17, 44.37, 64.81, and 77.66
o
corresponding with the planes (111), (200), (220), and (311), respectively; these planes correspond with the face-centered cubic Au (space group Fm
3
m, JCPDS File No. 89-3722). High Score Plus and Origin software were used for the analysis [69].
Biological Tests
Cytotoxicity by MTT and Live/Dead Assay
To evaluate AuMt1 and AuMt2 toxicity, tests were performed on HUVEC cells using MTT. Four concentrations and two times for both materials were evaluated. In Fig. 7a, it is observed that at 24 h for AuMt1, cell viability decreases between 10 and 20%, only in concentrations higher than 25 μg/mL. For AuMt2, a similar effect is obtained in cell viability; however, the concentration of 100 μg/mL seems to have no effect on these tests. In Fig. 7b, MTT tests at 48 h for AuMt1 and AuMt2 are shown. For AuMt1, it is easy to notice that concentration with the greatest effect is 50 μg/mL, where the viability drops almost 30% compared to the control. The concentration of 50 μg/mL seems to be the concentration with the highest toxic effect; however, when the obtained data were analyzed, it is found that there is no significant difference between the obtained data on 24 and 48 h, a similar result obtained for 100 and 200 μg/mL, Fig. 7c. For AuMt2, a toxic effect between 20 and 30% is observed only on 100 and 200 μg/mL, while 25 and 50 μg/mL show no significant difference, compared to the observed effect at 24 h, Fig. 7d. This seems to correlate with AuMt2 size growth in s-DMEM (Additional file 1:Figure S2) where at a concentration of 100 μg/mL, they begin to aggregate. In the work published by Chandran et al. [70], they used gold nanoparticles coated with branched polyethyleneimine (BPEI), lipoic acid (LA), and polyethylene glycol (PEG), where they see an important toxicity in HUVEC cells by nanoparticles coated with BPEI, which have sizes of 40 and 80 nm, where viability is between 20 and 30%. When these particles are covered with human serum proteins, it is found that toxicity decreases; this is due to the corona effect. Recently, Zhaleh et al. [71] have reported the biogenic synthesis of 40-nm gold nanoparticles using leaf extracts from Gundelia tournefortii L. plant. Interestingly and in contrast to our results, the authors indicate that MTT cell viability tests for these particles in HUVEC, the cell viability was 95% at 1000 μg/mL; however, they do not establish if the low cytotoxicity is due to the fact that there is no material internalization or if the particles are harmless due to protein corona. In this sense, bioreductive compounds present in Gundelia tournefortii L extract are different from those reported for Mimosa tenuiflora extract (Additional file 1:Figure S3). Thus, the interactions of these two nanoparticle systems with proteins present in FBS are very different, which may explain the differences in cytotoxic responses.
Viability assay using MTT in HUVEC cell. 아 For 24 h and b 48 h. 0ne-way ANOVA analysis with (*p <0.05). Comparison between 24 and 48 h for c AuMt1 and d AuMt2 with ANOVA analysis with Tukey tests (n.s. no significance and (*p < 0.05))
As mentioned above, AuMt1at a 50-μg/mL concentration shows the highest toxicity and cellular uptake. We believe that toxicity may be due to the fact that the nanomaterial has a low affinity to s-DMEM proteins, since it has only 16.6% of hydroxyl groups on the surface to promote hydrogen bonding with S-DMEM proteins. The fact that the material toxicity decreases as AuMt1 concentration increases may be due to a cellular detoxification response, like an exocytosis caused by high intracellular content of gold [70]. For AuMt2, the toxicity effect at 100 and 200 μg/mL may be due to nanomaterial agglomeration, which could be attaching to the membrane causing adverse effects for the cells; however, more experiments are required to confirm this hypothesis.
Only one concentration (50 μg/mL) was chosen to be evaluated by live/dead fluorescent dye; this is due to the purpose of confirming the MTT results and later analyzing the metallic NP internalization in HUVEC cells, avoiding a field saturation by NPs. When cells were stained with live/dead fluorescent dye kit, it was found that a large part of the cell population favorably marked for calcein and just a few for ethidium homodimer, indicating that cell culture is viable, as shown in Fig. 8.
Live/dead assay in HUVEC cells. 아 , d , 및 g with calcein; ㄴ , e , 및 h with ethidium homodimer; 및 c , f , 및 i merge by confocal microscopy
Confocal Laser Scanning Microscopy:Fluorescence of AuMt
In Fig. 9a, d are shown micrographs of AuMt1 and AuMt2 in bright field and in Fig. 9b, e, their corresponding fluorescence, captured by confocal microscopy. Red fluorescence of AuMt (collected emission 650–700 nm) was excited employing 640 nm diode laser, and a mayor size of NPs can be appreciated in AuMt2 sample than AuMt1. In the merge images in Fig. 9c, f, it can be observed how the luminescence comes exclusively from the dark points associated with the NPs. This indicates that the cleaning process effectively removed the extract that is not complexed to the nanomaterial, so there is no background emission. It is interesting to observe that an intense fluorescence of the NPs captured by the confocal system is achieved at a very low excitation power of the laser (below 0.5 mW). So, this NPs system can be fluorescently traced efficiently in cellular systems with little risk of phototoxicity. Some authors have reported fluorescent emission about 610 nm, suggesting intrinsic Au fluorescence [72, 73]. AuNPs emission is related to the core size confinement effect that generates discreet electronic states [74]. However, in our case, the metal surface is covered with flavonoids, which show fluorescence, and when complexing with AuNPs, the fluorescence of both is enhanced. Different authors have reported that fluorescence is largely enhanced by charge transfer from the surface ligands to the metal core via S–Au bonds [75]. It has also been reported that ligands (thiol molecules, DNA oligonucleotides, dendrimers, polymers, peptides, and proteins) affect AuNPs optical and electronic properties since its fluorescent properties can be significantly affected by their surface chemistry [76].
AuMt1 and AuMt2 fluorescence. 아 , d Bright field. ㄴ , e Confocal. ㄷ , f Merge
Cellular Internalization
Cells were also analyzed, by confocal microscopy, after 24 h incubation, with AuMt1 and AuMt2 at a concentration of 50 μg/mL. The nucleus is shown in blue color using DAPI Fig. 10a, and the cytoskeleton structure was stained with anti-beta actin in green color Fig. 10b and merge Fig. 10c. The observed micrographs were obtained through 3 different channels on separate tracks, where the excitation wavelengths were 405, 488, and 640 nm for DAPI, anti-beta actin, and AuMt, respectively.
AuMt1 and AuMt2 cellular internalization. 아 , d , 및 g with DAPI; ㄴ , e , 및 h with beta-actin; 및 c , f , 및 i merge by confocal microscopy
As previously described, cells were also analyzed by confocal microscopy, for AuMt1 and AuMt2 internalization, at a concentration of 50 μg/mL. Confocal micrographs show that AuMt are internalized in HUVEC cells cytosolic space, and many of these particles are surrounding the nucleus, without being internalized in it. When not observing particles in the nucleus, a more meticulous analysis was carried out, by cell orthogonal projection and a 3-D reconstruction. Observing the micrographs of both reconstructions, it is possible to notice that AuMt is distributed differentially. In Fig. 11a, b for AuMt1, it can be observed that a material is dispersed in the cytoplasm, while in AuMt2, the material is concentrated in the nuclear periphery, as shown in Fig. 11c, d. We were not able to find NPs in the nucleus, and this suggests that the nanomaterial has little or no genotoxic potential, since it has no way of interacting with nuclear DNA, which is a quality for a nanocarrier. Efficient cellular uptake depends on NP size, shape, charge, and coating, the parameters that can affect their interactions with cell proteins. The fact that polyphenolic compounds are found on AuMt surface could facilitate the nanomaterial internalization, which would make it a candidate as a possible pharmacological nanocarrier [77,78,79].
Orthogonal projections and 3-D images. 아 , ㄷ AuMt1 and AuMt2 cellular internalization analysis through orthogonal projection and b , d 3-D reconstruction by confocal microscopy
The obtained results for an AuMtNP cellular uptake in HUVEC by a confocal microscopy at 50 μg/mL suggests that AuMt1 interacts with the cells in a greater quantity than AuMt2 in a 3:1 ratio, as seen in Additional file 1:Figures S5–S7. If we consider that protein corona in AuMt1 is 9.1 nm smaller than in AuMt2, we can suggest that AuMt1-efficient internalization by HUVEC cells is given by a combination of factors such as AuMt1 smaller size, the highest absolute value of z potential and the lower thickness of protein corona. This indicates a poor protein coverage that allows partial exposure of the nanoparticle surface, which is rich in extract molecules. Therefore, nanoparticles can interact by means of extract molecules with surface-specific membrane receptors that facilitate the internalization of AuMt1.
Catalytic Tests
Catalysis
Analysis of catalytic reaction was realized to calculate the degradation percentage ( %D) using the Eq. (5):
using the A0 absorbance at t = 0 and A is the absorbance at time t . Langmuir-Hinshelwood equation was used to calculate the slope of the regression plot \( \ln \left(\frac{A}{A_0}\right) \) versus irradiation time [80], which is expressed in Eq. (6) and K is the first-order rate constant of the degradation ratio:
$$ \ln \left(\frac{A}{A_0}\right)=Kt $$ (6)
For the analysis of catalytic activity on MB degradation, the absorbance at 660 nm was monitored. Figure 12 shows the AuMt1 and AuMt2 catalytic activity, where a decrease on maximum absorption of MB is observed as time progresses Fig. 12a, d. MB degradation and its conversion to leucomethylene is confirmed by progressive decreases of the absorbance at 292, 614, and 660 nm correspond to MB and by the increase in time of the absorbance at 256 nm associated with leucomethylene. Homogeneous catalysis reaches a 50% MB degradation at 190 s Fig. 12b, while the degradation ratio K for the total process is 8.24 × 10
−3
s to AuMt1 Fig. 11c. AuMt2 reaches a 50% of MB degradation in 400 s, Fig. 12e, and K takes the value of 3.54 × 10
−3
/s, Fig. 12f.
AuMt1 and AuMt2 Catalysis. 아 , d UV-Vis spectra. ㄴ , e Percentage. ㄷ , f Ratio of MB degradation
On this way, AuMt1 have a more efficient response than AuMt2. We observed a size-dependent effect (AuMt) in degradation ratio [81], and a total surface area of NPs is inversely proportional to the NP size [37]. Table 2 shows a comparison between different green syntheses of AuNPs and their K obtained in size function.
Conclusions
In this work, we show for the first time that the extracts of bark of Mimosa tenuiflora allow the production at room temperature of gold nanoparticles by means of one-pot synthesis. AuNP sizes are easily controlled by regulating a metal precursor/reducing an extract ratio. It was observed that AuMt1 and AuMt2 cellular uptakes generate a moderate cytotoxic effect at 24 and 48 h post exposition. However, toxicity does not behave in a dose-dependent manner, which suggests different action mechanisms for AuMt1 and AuMt2. XPS and FTIR indicate that AuMtNPs interact mainly with carbonyl groups (ketones) in addition to hydroxyl groups of Mimosa tannins, saponins, and other molecules that participate in the reduction of Au
3+
Au
0
으로 and stabilization of nanomaterials. Polyphenols adsorbed on AuMtNPs facilitate nanoparticle internalization. AuMt2 were located near the nuclear periphery, but for AuMt1, it was observed that nanoparticles distribute on the whole cell and present a 3 fold uptake in comparison to AuMt2. Due to the fluorescence property at low excitation power and a high cellular uptake, AuMtNPs synthesized with Mt bark extracts are candidates for its implementation as drug nanocarriers and fluorescent probes in cells. However, other strategies must be addressed, in order to reduce the nanomaterial toxicity. Finally, it was observed that AuMtNPs showed a relevant catalytic activity on MB degradation using NaBH4 as a reducing agent.