M2 대식세포의 microRNA-18a는 TGFBR3를 억제하여 TGF-β 신호 전달 경로를 통해 비인두 암종 진행 및 종양 성장을 촉진합니다.
초록
목표
비인두 암종(NPC)은 높은 전이 및 침습 특성을 갖는 비인두 질환의 한 유형입니다. 종양 관련 대체 활성화(M2) 대식세포는 NPC와 연결되는 것으로 입증되었습니다. 이를 바탕으로 NPC의 M2 대식세포에서 microRNA-18a(miR-18a)의 기전과 참여를 탐색하고자 한다.
방법
말초혈액 단핵세포는 인터루킨-4에 의해 대식세포로 분화되었고 대식세포는 M2형으로 분극되었다. SUNE-1 및 CNE2 세포를 회복 또는 고갈된 miR-18a 또는 형질전환 성장 인자-베타 III 수용체(TGFBR3)로 형질감염시켜 TGF-β 신호 전달 경로의 관여와 함께 NPC 진행에서의 역할을 조사했습니다. 다음으로, SUNE-1 및 CNE2 세포는 복원되거나 고갈된 miR-18a 또는 TGFBR3으로 처리된 M2 대식세포와 함께 공동 배양되어 TGF-β 신호 전달 경로의 관여와 함께 NPC에서 이들의 결합된 역할을 이해했습니다.
결과
MiR-18a는 높게 발현되었고 TGFBR3은 NPC 세포에서 낮게 발현되었다. MiR-18a 복원, TGFBR3 녹다운 또는 miR-18a 모방체와의 공동 배양, 또는 si-TGFBR3-형질감염된 M2 대식세포는 SUNE-1 세포 진행, 마우스 종양 성장 촉진, p-Smad1/t-Smad1 감소 및 p-상승 Smad3/t-Smad3. miR-18a 하향 조절, TGFBR3 과발현 또는 miR-18a 억제제 또는 OE-TGFBR3-형질감염 M2 대식세포와의 공동 배양은 CNE2 세포 진행을 억제하고, 마우스에서 종양 성장을 억제하고, p-Smad1/t-Smad1을 증가시키고, p-Smad3/를 감소시킵니다. t-Smad3.
결론
우리의 연구는 M2 대식세포의 miR-18a가 Smad1 비활성화 및 Smad3 활성화와 함께 TGFBR3 억제를 통해 누드 마우스에서 NPC 세포 진행 및 종양 성장을 촉진한다는 것을 설명합니다.
소개
비인두암(NPC)은 국소 침윤 및 조기 원격 전이 경향이 있는 상피 악성 종양이다[1]. NPC 환자들은 종종 제6신경마비와 호너증후군을 호소한다[2]. 현재 적용되는 치료는 주로 방사선 요법과 통합 방사선 요법과 화학 요법으로 구성되어 있다[3]. 불행히도 방사선 요법과 화학 요법은 예기치 않게 합병증을 동반하고 방사선 요법에 대한 후천성 내성은 NPC의 결과를 방해합니다[3]. 잠재적인 표적 치료를 탐구하는 작업이 우선 순위임을 감안할 때.
조절 이상 마이크로RNA(miRNA)는 NPC 종양 형성, 전이, 침습 및 방사선 요법 및 화학 요법에 대한 내성에 관여하는 것으로 문서화되어 있습니다[1]. miRNA의 서브패밀리로서 miR-18a는 생식기 1 억제 및 mTOR 경로 활성화에서 형태 형성의 억제를 통해 NPC 진행을 촉진하는 것으로 밝혀졌습니다[4]. 그 외에도 miR-18a는 DICER1 조절을 통해 NPC 세포 증식 및 전이를 활성화하는 것으로 추가 확인되었습니다[5]. 또한 NPC 세포 진행은 miRNA 생합성 손상을 통해 miR-18a에 의해 구동되는 것으로 입증되었습니다[6]. 또한, miR-18a는 NPC의 전이에서 결정적으로 기능하는 것으로 문서화되었습니다[7]. 대체 활성화(M2) 대식세포는 고형암 및 혈액암의 중요한 구성 요소이며 진행, 전이 및 치료 내성과 관련이 있습니다[8]. M2 극성 종양 관련 대식세포는 NPC의 불량한 예후와 관련이 있습니다[9]. Epstein-Barr 바이러스 음성 NPC와 Epstein-Barr 바이러스 양성 NPC에서 M2 대식세포의 차이가 흥미롭게 기록되어 있습니다[10]. miR-18a가 M1 대식세포를 유도하여 대장암 세포의 간 전이를 억제한다는 연구 결과가 있습니다[11]. TGFBR3(Transforming growth factor-beta III receptor)는 TGF-β 공동수용체로서 type II TGF-β 수용체 리간드를 제공하여 신호전달과 세포 표면의 균형을 자극하고, 가용성 TGFBR3는 암 진행 동안 조절인자이다[12]. 저발현된 TGFBR3은 면역관용성 종양 미세환경을 유도하는 것으로 보고되었다[13]. 반대로, TGFBR3의 일시적인 과발현은 인간 NPC 세포에서 세포자멸사를 유도합니다[14]. 우리가 아는 한, miR-181a에 의해 유도된 M2 대식세포 분극화는 Kruppel-유사 인자 6 및 CCAAT/인핸서 결합 단백질 α축을 통해 M2 대식세포 매개 종양 세포 전이를 진행시킵니다[15].
종합적으로, 많은 연구가 NPC에서 miR-18a, TGFBR3 및 M2 대식세포의 독립적인 역할을 발견했지만 이 세 가지 요인 간의 결합된 상호 작용은 여전히 알아보기 어렵습니다. NPC에서 이러한 요인들의 메커니즘과 참여를 해독하기 위해 이 연구가 시작되었음을 고려합니다.
자료 및 방법
윤리 성명서
실험은 중남대학교 제3샹야병원 윤리위원회의 승인을 받았고 의료윤리 기준을 충족했다. 이 연구는 모든 기증자의 서면 동의를 받아 수행되었습니다. 동물 실험은 국립 실험 동물 관리 및 사용 규정의 요구 사항을 준수했습니다.
말초혈액 단핵세포 수집
건강한 기증자의 말초혈액에서 부착법으로 단핵구를 얻었다. 말초 혈액 표본은 Central South University, Third Xiangya Hospital 혈액학과의 건강한 기증자로부터 얻었습니다. 단핵구 유래 대식세포는 이전에 밀도 구배 원심분리(Ficoll-Paque, GE Healthcare)에 의해 건강한 기증자 혈액의 버피 코트 준비에 의해 분리된 말초 혈액 단핵 세포(PBMC)의 플라스틱 부착을 통해 얻었습니다. 그런 다음 2.0 × 10
6
PBMC는 10% 인간 혈청(Millipore, Bedford, MA, USA)과 12웰 플레이트(NalgeNunc, NY, USA)에서 페니실린/스트렙토마이신이 보충된 Dulbecco의 변형된 Eagle 배지(DMEM)에서 배양되었습니다. PBMC가 2-3시간 동안 벽에 부착되었을 때 상층액과 부유 PBMC를 반복적으로 제거하여 부착된 단핵구를 얻었다.
대식세포 분극화
단핵구는 인간 대식세포 집락 자극 인자(M-CSF)에 의해 대식세포로 분화하도록 유도되었고 인터루킨(IL)-4에 의해 M2 대식세포로 분극화되었습니다.
대식세포 유도
단핵구를 20% 소태아혈청(FBS)-DMEM에서 배양하고 M-CSF(100μg, Peprotech, NJ, USA)를 최종 농도 100ng/mL로 첨가하였다. 배지를 3일마다 반으로 교체한 다음 100ng/mL M-CSF로 보충했습니다. 7~8일까지 배양한 후 세포의 일부를 채취하고 대식세포를 식별하기 위해 대식세포 표면 마커인 CD68[16], CD163[17], CD206[18]을 면역형광법[19]으로 시험하였다.
대식세포의 극성화
다른 24시간 동안 분화 배지에 20ng/mL IL-4(Peprotech)를 보충하여 대식세포를 M2 대식세포로 분극화했습니다. M2 대식세포 샘플의 일부를 유세포분석 검출에 사용했습니다. 샘플을 3개의 튜브로 나누었습니다:튜브 1은 IL-4 자극이 없는 부착성 대식세포의 동일한 배치이고; 튜브 2 및 3은 IL-4에 의해 자극된 부착성 대식세포였다. 로딩 시 샘플을 약 10,000개 세포로 희석하고 비특이적 면역글로불린 G를 첨가하여 Fc 수용체를 차단하였다. 그런 다음 샘플에 비특이적 이소타입 항체, PE-표지된 CD68 항체 및 PE-표지된 CD163 항체(둘 모두 Biolegend, CA, USA)를 첨가했습니다. 30분 동안 배양하고 인산완충식염수(PBS)에서 0.5% 소 혈청 알부민으로 헹구고, 샘플을 원심분리하고 검출을 위해 500μL PBS로 세포 현탁액으로 만들었습니다.
역전사 정량적 중합효소 연쇄 반응
역전사 정량적 중합효소 연쇄 반응(RT-qPCR)을 사용하여 수집된 세포에서 miR-18a, CCL22, 퍼옥시좀 증식자 활성화 수용체 γ(PPAR-γ) 및 TGFBR3 mRNA 발현을 검출했습니다.
총 RNA는 Trizol(Invitrogen, Carlsbad, CA, USA)에 의해 세포에서 추출되었고 miR-18a 및 PrimeScriptTM RT용 Mir-X miRNA First Strand Synthesis Kit(Clontech, Mountain View, CA, USA)에 의해 상보적 RNA로 역전사되었습니다. CCL22, PPAR-γ 및 TGFBR3용 마스터 믹스 키트(Takara, Dalian, China). U6 및 글리세르알데히드-3-인산 탈수소효소(GAPDH)는 miR-18a, CCL22, PPAR-γ 및 TGFBR3에 대한 부하 대조군이었습니다. SYBR
@
LightCycler 480 II 시스템(Roche Diagnostics, Indiana, USA)의 Premix Ex Taq™ II(Perfect Real Time)(Takara)를 PCR에 사용했습니다. 데이터 계산은 2
-△△CT
로 평가 방법. PCR 프라이머는 표 1에 제시되어 있습니다.
서부 얼룩 분석
수집된 세포에서 TGFBR3, total (t)-Smad1, phosphorylated (p)-Smad1, t-Smad3, p-Smad3 단백질을 검출하기 위해 Western blot assay를 적용하였다.
세포의 총 단백질을 추출하고 bicinchoninic acid 키트를 기반으로 단백질 농도를 결정했습니다. 단백질 샘플을 소듐 도데실 설페이트 폴리아크릴아미드 겔 전기영동의 웰에 로딩하고 폴리비닐리덴 플루오라이드(PVDF) 멤브레인으로 옮겼습니다. PVDF 막을 탈지유로 차단하고 1차 항체 TGFBR3(1:2000, R&D Systems, Minneapolis, MN, USA), t-Smad1(1:1000), p-Smad1(1:1000, Santa Cruz Biotechnology)과 함께 배양했습니다. , t-Smad3(1:1000), p-Smad3(1:1000) 및 GAPDH(1:1000, 모두 Abcam, Cambridge, MA, UK)를 사용한 후 양고추냉이 퍼옥시다제 표지 이차 항체( 1:500, Jackson ImmunoResearch Laboratories, PA, USA). Tween 20이 포함된 tris-buffered saline으로 3번 세척한 멤브레인은 향상된 화학 발광에 의해 개발되었습니다. 신호의 정량화는 National Institutes of Health ImageJ Imaging에서 완료되었습니다. 신호 강도가 GAPDH로 정규화된 처리 분석 소프트웨어.
세포 배양 및 스크리닝
인간 NPC 세포주 CNE2, TW03, C666-1 및 SUNE-1과 정상 인간 비인두 세포주 NP96(Shanghai Institutes for Biological Sciences, Chinese Academy of Sciences, Shanghai, China)은 Roswell Park Memorial Institute(RPMI)- FBS(Gibco), 100μg/mL 페니실린 및 100μg/mL 스트렙토마이신을 함유하고 80% 합류 시 계대된 1640 배지(Gibco, CA, USA). RT-qPCR을 사용하여 miR-18a 발현을 검출했습니다. 이들 NPC 세포주 중 CNE2 및 SUNE-1 세포는 NP96 세포와 miR-18a 발현의 가장 큰 차이와 가장 작은 차이를 보여 miR-18a 하향 조절 또는 상향 조절 분석에 선택되었습니다.
셀 그룹화 및 처리
모든 NPC 세포주 중에서 miR-18a 발현에서 NP96 세포와 가장 작은 차이를 보이는 SUNE-1 세포를 선택하였다. Lipofectamine 2000(Invitrogen)의 사양에 따라 SUNE-1 세포는 miR-18a 모방체, miR-18a 모방체 음성 대조군(NC), si-TGFBR3 또는 si-TGFBR3 NC로 형질감염되었습니다.
모든 NPC 세포주 중에서 miR-18a 발현에서 NP96 세포와 가장 큰 차이를 보이는 CNE2 세포를 선택하여 Lipofectamine 2000에 의해 miR-18a 억제제, miR-18a 억제제 NC, 과발현(OE)-TGFBR3 또는 OE-TGFBR3 NC로 형질감염시켰다. (인비트로젠).
Transwell 챔버의 세포 공동 배양은 NPC 세포에 대한 M2 대식세포의 miRNA 효과를 조사하기 위해 채택되었습니다. 상부 챔버는 공극 크기가 0.4μm인 M2 대식세포로 채워져 있어 상부 챔버의 세포는 통과하는 것을 막았지만 소포, 성장 인자, 영양소 등과 같은 세포에서 분비하는 작은 분자는 통과하지 못했습니다. 하부 챔버 NPC 세포로 퍼졌습니다.
SUNE-1 및 CNE2는 정상 FBS(Gibco)에서 배양되었습니다. 대수 성장기의 세포를 실험에 채택했습니다.
SUNE-1 및 CNE2 세포는 구멍 크기가 0.4 μm인 Transwell 삽입 세포 배양 접시(Coring, Corning, NY, USA)에서 10% FBS-RPMI-1640 배지(둘 모두 Gibco)에서 M2 대식세포와 공동 배양되었습니다. .
SUNE-1 세포는 M2 대식세포와 공동 배양되지 않았거나 M2 대식세포, miR-18a 모방형 M2 대식세포, miR-18a 모방 NC형 M2 대식세포, si-TGFBR3 형질감염 M2 대식세포 또는 si -TGFBR3 NC 형질감염된 M2 대식세포.
CNE2 세포는 M2 대식세포와 공동 배양되지 않았거나 M2 대식세포, miR-18a 억제제가 형질감염된 M2 대식세포, miR-18a 억제제 NC 형질감염된 M2 대식세포, OE-TGFBR3 형질감염된 M2 대식세포 또는 OE-TGFBR3과 공동 배양되지 않았습니다. NC 형질감염된 M2 대식세포.
3-(4,5-디메틸티아졸-2-일)-2,5-디페닐테트라졸륨 브로마이드 분석
세포 생존력은 3-(4, 5-디메틸티아졸-2-일)-2,5-디페닐테트라졸륨 브로마이드(MTT) 분석에 의해 테스트되었으며, 이는 MTT를 포르마잔으로 환원시키는 미토콘드리아 탈수소효소의 활성을 결정하기 위해 적용된 비색 분석입니다.
트립신 처리하고 4 × 10
4
에서 96웰 플레이트에 접종 세포/웰, 세포에 각각 0, 12, 24, 36 및 48시간에 배양 배지를 박탈하고 MTT 용액(500μL, 0.5g/L)을 보충하였다. 4시간 동안 인큐베이션한 후 상층액을 버리고 세포를 200μL 디메틸 설폭사이드 용액과 함께 인큐베이션했습니다. 광학 밀도(OD, 490 nm) 값은 마이크로플레이트 리더(ELX808IU, BioTek, VT, USA)에서 측정되었습니다. 각 그룹은 6개의 평행 우물로 설정되었습니다.
콜로니 형성 분석
NPC 세포의 집락 형성 능력은 세포 집단 의존성과 세포 클론 증식을 반영하는 집락 형성 분석에 의해 테스트되었습니다.
24시간 동안 배양하고 0.25% 트립신으로 분리한 후, 각 그룹에 3개의 평행 웰이 있는 35mm 접시에 300개의 세포를 파종했습니다. 3일마다 배지를 교체하여 세포를 1주일 동안 배양하고 5mL 4% 파라포름알데히드로 고정하였다. 그 후, 크리스탈 바이올렛 염색 용액으로 세포를 염색하고 공기 건조시켰다. 접시를 뒤집고 격자의 투명한 필름을 겹쳐서 현미경(Olympus, Tokyo, Japan)으로 집락의 수(50개 이상의 세포)를 세었습니다.
스크래치 테스트
세포 이동은 스크래치 테스트로 테스트되었습니다. 세포를 트립신 처리하고, 각 그룹에 대해 3개의 평행 웰이 있는 6웰 플레이트에 시딩하고, 90% 합류까지 배양하였다. 그런 다음, 세포를 2% FBS가 포함된 배지에서 배양하고 100μL 팁으로 수직 스크래치를 그렸습니다. 세포 이동 거리를 측정하기 위해 도립 현미경으로 0시간 및 24시간째에 세포를 촬영했습니다.
트랜스웰 분석
세포 침윤 및 이동은 Transwell 분석에 의해 테스트되었습니다. Transwell 챔버의 상부 챔버를 미리 침지하고 무혈청 RPMI 1640 배지로 1:100으로 희석한 100 μL Matrigel(Coring)을 첨가했습니다. 상부 및 하부 챔버에 200 μL 및 600 μL 무혈청 RPMI 1640 배지를 각각 추가했습니다. 후속적으로, 하부 챔버에는 10% FBS를 함유하는 600 μL RPMI 1640 배지가 첨가되었고, 상부 챔버에는 200 μL 세포 현탁액(12.5 × 10
4
세포/mL). 40시간 동안 배양한 후 크리스탈 바이올렛 염색 용액으로 세포를 염색하고 면봉으로 닦아 현미경으로 Matrigel을 통과하는 세포 수를 세었습니다.
유세포분석
세포 사멸 및 세포 주기 분포는 유세포 분석에 의해 결정되었습니다.
propidium iodide(PI) 염색으로 세포 주기 분포를 평가했습니다. 세포를 4 × 10
5
에서 6웰 플레이트에 접종했습니다. 세포/웰, 70-80% 합류까지 배양. 미리 냉각된 70% 에탄올에 밤새 고정하고, 세포를 원심분리하고(상등액은 폐기) RNAase(1g/L, 200μL) 및 Triton X-100(2μL)을 첨가하고 PI 염색 용액으로 염색했습니다. 30 분. 그 후, 세포 주기 분포는 488 nm에서 유세포 분석기(BD Bioscience, NJ, USA)로 각 구(G0/G1 구, S 구 및 G2/M 구)에서 서로 다른 세포 형광 강도에 따라 감지되었습니다.
세포 사멸은 Annexin V-fluorescein isothiocyanate (FITC) 및 PI 이중 염색에 의해 측정되었습니다. 세포를 500μL 결합 완충액에 재현탁하고 5μL Annexin V-FITC 염색 용액 및 10μL PI 용액으로 염색했습니다. 세포 사멸은 또한 빛 노출 없이 30분 이내에 유세포 분석기(BD Bioscience)로 테스트되었습니다. 산점도에서 왼쪽 아래 사분면(Q4)의 살아있는 세포는 FITC
-
였습니다. /PI
−
, 오른쪽 하단 사분면(Q3)의 초기 단계에서 세포자멸사 세포는 FITC
+
였습니다. /PI
−
, 그리고 우측 상단 사분면(Q2)의 후기 단계의 괴사 및 세포 사멸 세포는 FITC
+
였습니다. /PI
+
. 아폽토시스 비율 =조기 아폽토시스 비율(Q3) + 후기 아폽토시스 비율(Q2).
누드 마우스의 종양 이종이식편
누드 마우스에서 NPC 모델을 설정하여 종양 성장을 관찰했습니다. 0.25% 트립신에 의해 분리되어 대수기의 SUNE-1 및 CNE2 세포가 5 × 10
7
에서 단일 세포 현탁액으로 구성되었습니다. 세포/mL. 세포 현탁액(0.2mL)을 마우스 오른쪽 겨드랑이에 마이크로인젝터로 주입하여 마우스 모델을 확립했습니다. 모델링된 마우스는 특정 병원체 없는 환경에서 키웠습니다. 4일째부터 종양 성장을 관찰하고 4일마다 마우스의 체중을 측정했습니다. 주사 후 20일째 누드 마우스를 안락사시키고 종양을 절제하고 전자 저울로 무게를 재고 사진을 찍었습니다.
이중 루시퍼라제 리포터 유전자 분석
이중 루시퍼라제 리포터 유전자 시스템은 miR-18a와 TGFBR3 mRNA의 3' 비번역 영역(UTR)의 결합 부위를 확인하기 위해 채택되었습니다. 생물학적 예측 웹사이트(http://www.microrna.org/microrna/home.do)를 이용하여 miR-18a의 표적 유전자를 분석하고 3'에 miR-18a의 상보적 결합 부위의 존재를 발견했습니다. TGFBR3의 UTR. 이중 루시퍼라제 리포터 유전자 분석을 사용하여 TGFBR3이 miR-18a에 의해 직접 표적화되었는지 여부를 추가로 확인했습니다. TGFBR3 3'UTR 결합 부위의 pmirGLO-TGFBR3-야생형(WT) 및 pmirG-LO-TGFBR3-돌연변이형(MUT)을 구축하였다. TGFBR3-WT 또는 TGFBR3-MUT 및 miR-18a 모방체 또는 모방체 NC는 Lipofectamine 2000(Invitrogen)에 의해 SUNE-1 및 CNE2 세포에 공동 형질감염되었고 48시간 동안 배양되었습니다. 루시퍼라제 분석 키트(Promega, Madison, WI, USA)를 사용하여 세포를 분석했습니다.
통계 분석
SPSS21.0 통계 소프트웨어(IBM Corp. Armonk, NY, USA)를 분석에 사용했습니다. 데이터는 평균 ± 표준 편차로 표현되었습니다. 두 그룹 간의 차이는 t로 분석되었습니다. 일원 분산 분석(ANOVA)으로 여러 그룹 간의 차이를 테스트한 다음 Tukey의 사후 테스트를 수행합니다. P에서 상당한 차이가 고려되었습니다. <0.05.
<섹션 데이터-제목="결과">
결과
M2 대식세포의 식별
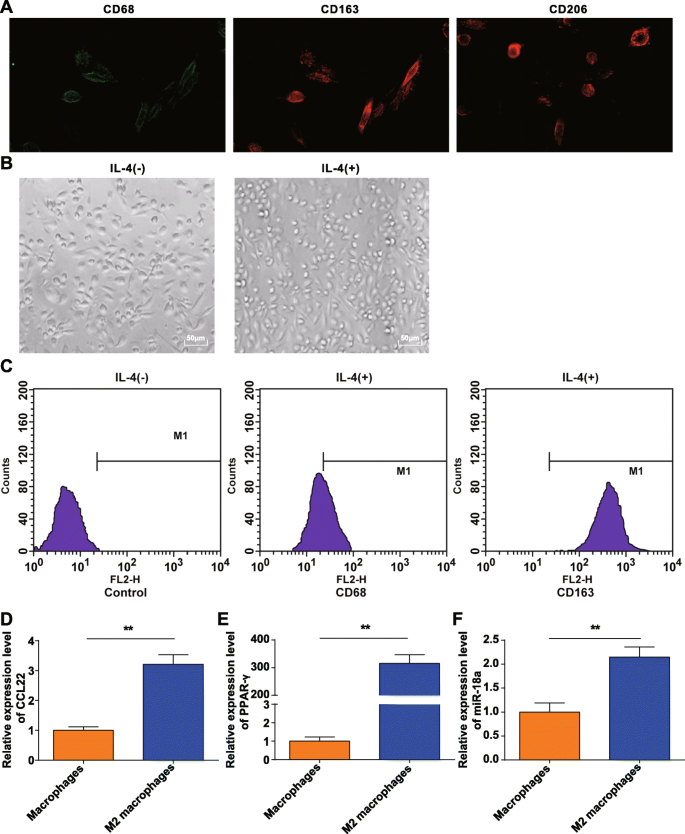
부착법으로 농축된 단핵구와 M-CSF로 유도된 단핵구를 건강한 기증자의 말초혈액에서 채취하였다. CD68, CD206 및 CD163의 면역형광 검출은 시험관 내에서 M-CSF에 의해 유도된 PBMC가 우리의 요구 사항을 충족하는 전형적인 분자 특성을 가진 대식세포로 변한다는 것을 확인했습니다(그림 1a).
<그림>
M2 대식세포의 식별. 아 . CD68, CD206 및 CD163은 시험관 내에서 단핵구 유도 후 수득된 대식세포의 표면에서 발현되었다. ㄴ IL-4에 의한 극성화된 대식세포는 M2 대식세포였다. ㄷ CD163은 고도로 발현되었고 CD68은 IL-4에 의해 분극된 M2 대식세포에서 낮게 발현되었다. d CCL22는 M2 대식세포에서 높게 발현되었다. 이 PPAR-γ는 M2 대식세포에서 높게 발현되었다. 에 miR-18a는 M2 대식세포에서 고도로 발현되었고; *피 <0.05; **피 <0.01. 측정 데이터는 평균 ± 표준 편차, N으로 표현되었습니다. =3. 두 그룹 간의 비교는 t로 분석되었습니다. 테스트
얻어진 대식세포를 IL-4로 분극시키고 현미경으로 형태를 관찰하였다. IL-4 자극을 받지 않은 대식세포(M0)는 다양하고 불규칙하여 원형, 타원형 또는 방추형으로 나타났다. IL-4에 의해 자극을 받은 M2 대식세포는 더 커졌고 주로 둥근 모양으로 바뀌었는데, 이는 앞서 설명한 M2 대식세포의 형태적 특성에 부합했습니다[20](그림 1b).
유세포 분석은 24시간 동안 20ng/mL IL-4로 자극된 부착 세포의 표면 항원을 테스트했으며 CD68은 21.16%로 발현된 반면 CD163은 총 세포 수의 98.69%에서 발현되었음을 발견했습니다(그림 1c). 부착 세포는 M2 대식세포입니다. RT-qPCR은 대조적으로 M0 세포의 경우 M2 대식세포에서 CCL22 및 PPAR-γ(전형적인 편광 분자)가 증가함을 보여주었으며(그림 1d, e), 이는 M2 대식세포의 성공적인 유도를 나타냅니다.
RT-qPCR은 또한 M0 대식세포(P ˂ 0.05) (그림 1f).
MiR-18a는 높게 발현되고 TGFBR3은 NPC 세포에서 제대로 발현되지 않습니다
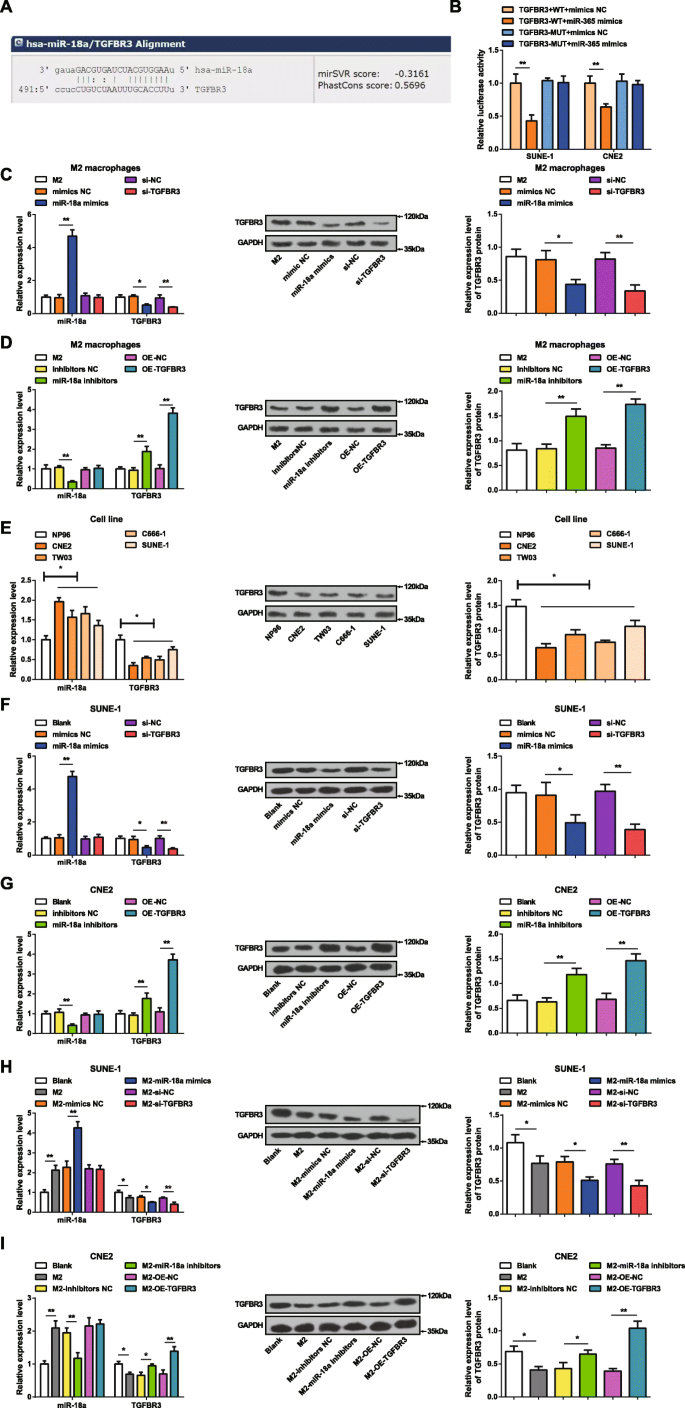
생물정보학 웹사이트(miRanda)는 miR-18a의 잠재적 표적을 예측했으며 TGFBR3은 miR-18a의 한 표적으로 간주되었습니다(그림 2a). 이중 루시퍼라제 리포터 유전자 분석은 miR-18a가 TGFBR3의 3'UTR을 표적으로 한다는 것을 확인하기 위해 구현되었습니다. TGFBR3-WT 또는 TGFBR3-MUT를 pmirGLO 벡터에 클로닝하고 miR-18a 모방체 또는 NC로 SUNE-1 및 CNE2 세포에 공동 형질감염시켰다. miR-18a 모방체는 TGFBR3 3'UTR-MUT의 루시퍼라제 활성에 영향을 미치지 않았지만 SUNE-1 및 CNE2 세포에서 TGFBR3 3'UTR-WT의 활성을 손상시켰으며, 이는 TGFBR3이 miR-18a에 의해 조절되는 표적 유전자임을 시사합니다(그림 1c). . 2b).
<그림>
MiR-18a는 고도로 발현되고 TGFBR3은 NPC 세포에서 제대로 발현되지 않습니다. 아 miRanda는 TGFBR3을 표적으로 하는 miR-18a를 예측했습니다. ㄴ 이중 루시퍼라제 리포터 유전자 분석은 TGFBR3을 표적으로 하는 miR-18a를 확인했습니다. ㄷ miR-18a 모방체 형질감염된 M2 대식세포에서 miR-18a 발현이 증가하고 TGFBR3 발현이 감소하였다. d miR-18a 억제제로 형질감염된 M2 대식세포에서 miR-18a 발현이 감소하고 TGFBR3 발현이 증가하였다. 이 miR-18a 발현은 증가하였고 TGFBR3 발현은 NP96 세포에 비해 NPC 세포주에서 감소하였다. 에 miR-18a 발현은 증가하고 TGFBR3 발현은 miR-18a 모방체-형질감염된 SUNE-1 세포에서 감소하였다. 지 miR-18a 억제제로 형질감염된 CNE2 세포에서 miR-18a 발현이 감소하고 TGFBR3 발현이 증가하였다. 아 miR-18a 모방체-형질감염된 M2 대식세포와 공동 배양된 SUNE-1 세포에서 miR-18a 발현이 증가하고 TGFBR3 발현이 감소하였다. 나 miR-18a 발현은 감소되었고 TGFBR3 발현은 miR-18a 억제제-형질감염된 M2 대식세포와 공동 배양된 CNE2 세포에서 증가되었다; *피 <0.05; **피 <0.01. 측정 데이터는 평균 ± 표준 편차, N으로 표현되었습니다. =3. 두 그룹 간의 비교는 t로 분석되었습니다. 테스트. 여러 그룹 간의 비교는 일원 ANOVA로 분석한 후 Tukey의 사후 검정
M2 대식세포에서 miR-18a 모방체 또는 miR-18a 억제제의 형질감염 효율은 RT-qPCR 및 웨스턴 블롯 분석에 의한 M2 대식세포에서의 miR-18a 및 TGFBR3 발현의 결정에 의해 입증되었습니다. (그림 2c, d) miR-18a 과발현은 M2 대식세포에서 miR-18a 발현을 증가시키고 TGFBR3 발현을 감소시키는 것이 분명했습니다. 반대로, miR-18a 억제는 M2 대식세포에서 miR-18a 발현을 감소시키고 TGFBR 발현을 증가시켰다. M2 대식세포가 si-TGFBR3로 형질감염되었을 때 TGFBR3 발현이 감소된 반면 miR-18a 발현에서는 차이가 관찰되지 않았다. M2 대식세포에 OE-TGFBR3 형질감염 시 TGFBR3 발현이 증가하는 반면 miR-18a 발현에서는 차이가 관찰되지 않았습니다.
CNE2, TW03, C666-1, SUNE-1 및 NP96 세포주에서 miR-18a 및 TGFBR3 발현을 RT-qPCR 및 웨스턴 블롯 분석으로 테스트했습니다. NPC 세포에서는 NP96 세포와 비교하여 miR-18a 발현이 증가하고 TGFBR3 발현이 감소했습니다 (그림 2e). CNE2 세포와 SUNE-1 세포는 NP96 세포와 miR-18a 발현의 가장 큰 차이와 가장 작은 차이를 나타내기 때문에 각각 진행 중인 miRNA 하향 조절 및 상향 조절 분석에 선택되었습니다.
NPC 세포에 대한 miR-18a 및 TGFBR3의 효과를 확인하기 위해 SUNE-1 세포는 miR-18a 모방체 또는 si-TGFBR3으로 형질감염된 반면 CNE2 세포는 miR-18a 억제제 또는 OE-TGFBR3으로 형질감염되었습니다. RT-qPCR 및 웨스턴 블롯 분석은 miR-18a가 SUNE-1 세포에서 증가된 miR-18a 발현 및 감소된 TGFBR3 발현을 모방한다는 것을 입증했습니다. si-TGFBR3의 형질감염은 miR-18a 발현에 영향을 미치지 않았지만 SUNE-1 세포에서 TGFBR3 발현을 감소시켰다. miR-18a 억제제는 CNE2 세포에서 miR-18a 발현을 감소시키고 TGFBR3 발현을 증가시켰다. CNE2 세포의 OE-TGFBR3 형질감염은 miR-18a 발현에 영향을 미치지 않았지만 TGFBR3 발현을 증가시켰다(그림 2f, g).
NPC 세포에 대한 M2 대식세포의 miR-18a 효과를 조사하기 위해 miR-18a 모방 또는 si-TGFBR3 형질감염 M2 대식세포 또는 miR-18a 억제제 또는 OE-TGFBR3 형질감염 M2 대식세포를 SUNE-1과 공동 배양했습니다. 또는 각각 Transwell 챔버의 CNE2 세포. RT-qPCR 및 웨스턴 블롯 분석은 SUNE-1 또는 CNE2 세포에서 miR-18a 및 TGFBR3 발현을 테스트했습니다. 형질감염되지 않은 또는 miR-18a 모방체-형질감염된 M2 대식세포와 공동 배양된 SUNE-1 세포는 miR-18a 발현 증가 및 TGFBR3 발현 저하로 입증되었습니다. si-TGFBR3-형질감염된 M2 대식세포와 공동 배양한 SUNE-1 세포에서 miR-18a 발현 및 감소된 TGFBR3 발현에는 차이가 없었습니다(그림 2h). 형질감염되지 않은 M2 대식세포와의 공동 배양 후, CNE2 세포는 증가된 miR-18a 발현 및 감소된 TGFBR3 발현을 특징으로 하였다. 그러나, miR-18a 억제제로 형질감염된 M2 대식세포와 미리 공동 배양된 CNE2 세포에서 감소된 miR-18a 발현 및 상승된 TGFBR3 발현이 나타났다. miR-18a 발현에는 차이가 없었으며, OE-TGFBR3 형질전환된 M2 대식세포와 함께 배양된 CNE2 세포에서 TGFBR3 발현이 증가하였다(Fig. 2i).
M2 대식세포의 miR-18a는 NPC 세포 생존 및 집락 형성 능력을 촉진합니다.
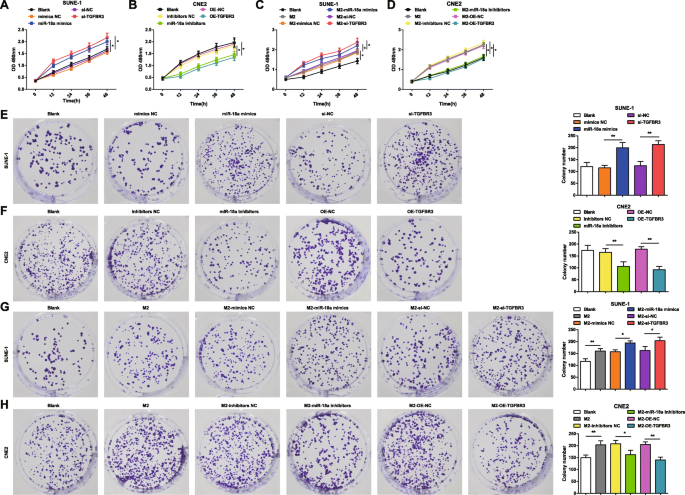
MTT 분석 및 집락 형성 분석을 적용하여 miR-18a 및 TGFBR3이 SUNE-1 세포 및 CNE2 세포의 생존 및 집락 형성 능력에 미치는 영향을 확인했습니다. miR-18a 모방체, miR-18a 억제제, si-TGFBR3 또는 OE-TGFBR3을 SUNE-1 세포 또는 CNE2 세포에 형질감염시켰다. SUNE-1 세포에서 miR-18a 상향 조절 또는 TGFBR3 하향 조절이 세포 생존력을 향상시키고 콜로니 수를 증가시키는 것으로 나타났습니다(그림 3a, e). CNE2 세포에서 miR-18a 억제 또는 TGFBR3 과발현에 의해 세포 생존력이 손상되고 콜로니 수가 감소했습니다(그림 3b, f).
<그림>
M2 대식세포의 miR-18a는 NPC 세포 생존력과 집락 형성 능력을 유도합니다. 아 miR-18a는 SUNE-1 세포의 생존력을 증가시키거나 si-TGFBR3를 모방합니다. ㄴ miR-18a 억제제 또는 OE-TGFBR3은 CNE2 세포의 생존력을 감소시켰습니다. ㄷ miR-18a 모방 또는 si-TGFBR3 형질감염 M2 대식세포와의 공동 배양은 SUNE-1 세포의 생존력을 증가시켰습니다. d miR-18a 억제제 또는 OE-TGFBR3 형질감염된 M2 대식세포와의 공동 배양은 CNE2 세포의 생존력을 감소시켰습니다. 이 miR-18a는 SI-TGFBR3을 모방하거나 SUNE-1 세포의 콜로니 수를 증가시킵니다. 에 miR-18a 억제제 또는 OE-TGFBR3은 CNE2 세포의 콜로니 수를 감소시켰습니다. 지 miR-18a 모방체 또는 si-TGFBR3-형질감염된 M2 대식세포와의 공동 배양은 SUNE-1 세포의 콜로니 수를 증가시켰습니다. 아 miR-18a 억제제 또는 OE-TGFBR3-형질감염된 M2 대식세포와의 공동 배양은 CNE2 세포의 콜로니 수를 감소시켰습니다. *피 <0.05; **피 <0.01. 측정 데이터는 평균 ± 표준 편차, N으로 표현되었습니다. =3. 일원 ANOVA로 여러 그룹 간의 비교를 분석한 후 Tukey의 사후 검정
M2 대식세포의 miR-18a가 NPC 세포의 생존 및 집락 형성 능력에 미치는 영향을 조사하기 위해 miR-18a 모방체, miR-18a 억제제, si-TGFBR3 또는 OE-TGFBR3 형질감염된 M2 대식세포를 공동 배양했습니다. Transwell 챔버에서 SUNE-1 세포 또는 CNE2 세포로. MTT 및 콜로니 형성 분석은 형질감염되지 않은, 또는 miR-18a가 형질감염된 또는 si-TGFBR3-형질감염된 M2 대식세포와 공동 배양된 SUNE-1 세포가 강화된 세포 생존력 및 증가된 콜로니 수로 제시되었음을 나타내었다(도 3c, g) .
형질감염되지 않은 M2 대식세포와 공동 배양된 CNE2 세포는 세포 생존력이 강화되고 집락이 증가하여 강조되었습니다. 그러나, miR-18a 억제제-형질감염된 또는 OE-TGFBR-형질감염된 M2 대식세포와 공동 배양된 CNE2 세포는 감소된 세포 생존력 및 감소된 집락을 나타내었다(그림 3d, h).
M2 대식세포의 miR-18a는 NPC 세포 침입 및 이동 능력을 촉진합니다.
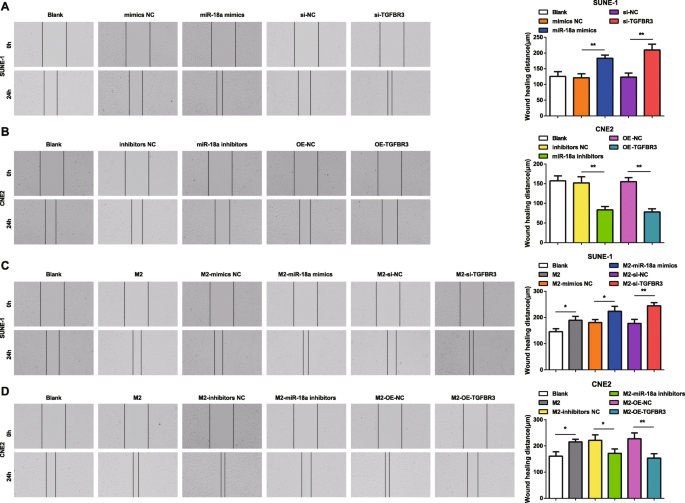
miR-18a 및 TGFBR3이 NPC 세포의 이동 및 침입에 미치는 영향을 더 잘 이해하기 위해 스크래치 테스트 및 Transwell 분석을 구현했습니다. 결과는 miR-18a 모방체 또는 si-TGFBR3으로 형질감염된 SUNE-1 세포가 증가된 세포 이동 거리 및 침입 세포를 특징으로 하는 것으로 나타났습니다(그림 4a 및 5a).
<그림>
M2 대식세포의 miR-18a는 NPC 세포 이동 능력을 촉진합니다. 아 miR-18a는 SUNE-1 세포의 이동을 증가시키거나 si-TGFBR3를 모방합니다. ㄴ miR-18a 억제제 또는 OE-TGFBR3은 CNE2 세포의 이동을 감소시켰습니다. ㄷ Co-culture with miR-18a mimics- or si-TGFBR3-transfected M2 macrophages increased migration of SUNE-1 cells. d Co-culture with miR-18a inhibitors or OE-TGFBR3-transfected M2 macrophages decreased migration of CNE2 cells; *피 <0.05; **P <0.01. Measurement data were expressed as mean ± standard deviation, N =3. Comparisons among multiple groups were analyzed by one-way ANOVA, followed by Tukey’s post hoc test
miR-18a from M2 macrophages promotes NPC cell invasion ability. 아 miR-18a mimics or si-TGFBR3 increased invasion of SUNE-1 cells. ㄴ miR-18a inhibitors or OE-TGFBR3 decreased invasion of CNE2 cells. ㄷ Co-culture with miR-18a mimics- or si-TGFBR3-transfected M2 macrophages increased invasion of SUNE-1 cells. ㄴ Co-culture with miR-18a inhibitors or OE-TGFBR3-transfected M2 macrophages decreased invasion of CNE2 cells; *피 <0.05; **P <0.01. Measurement data were expressed as mean ± standard deviation, N =3. Comparisons among multiple groups were analyzed by one-way ANOVA, followed by Tukey’s post hoc test
In CNE2 cells transfected with miR-18a inhibitors or OE-TGFBR3, the reductions appeared in cell migration distance and invasion cells (Figs. 4b and 5b).
How miR-18a from M2 macrophages influenced invasion and migration abilities of NPC cells were deciphered by miR-18a mimics-, miR-18a inhibitors-, si-TGFBR3-, or OE-TGFBR3-transfected M2 macrophages co-culturing with SUNE-1 or CNE2 cells. The results highlighted that SUNE-1 cells co-cultured with untransfected, or miR-18a mimics-transfected or si-TGFBR3-transfected M2 macrophages were manifested with increased cell migration distance and invasion cells (Figs. 4c and 5c).
Both cell migration distance and invasion cells increased in CNE2 cells co-cultured with untransfected M2 macrophages. Upon co-culture with miR-18a inhibitors-transfected or OE-TGFBR3-transfected M2 macrophages, CNE2 cells were showed with reduced migration distance and invasion cells (Figs. 4d and 5d).
miR-18a from M2 Macrophages Arrests Fewer NPC Cell at G0/G1 Phase and Suppresses Apoptosis
Cell cycle distribution and apoptosis were tested by flow cytometry to stratify the effects of miR-18a and TGFBR3 on NPC cells. It was indicated that transfection of miR-18a mimics or si-TGFBR3 reduced SUNE-1 cells arrested in the G0/G1 phase, increased cells in the S and G2/M phases, and reduced cell apoptosis rate (Figs. 6a and 7a).
miR-18a from M2 macrophages arrests fewer NPC cell at G0/G1 phase. 아 miR-18a mimics or si-TGFBR3 decreased SUNE-1 cells in the G0/G1 phase, and increased SUNE-1 cells in the S and G2/M phases. ㄴ miR-18a inhibitors or OE-TGFBR3 increased CNE2 cells in the G0/G1 phase, and decreased CNE2 cells in the S and G2/M phases. ㄷ Co-culture with miR-18a mimics- or si-TGFBR3-transfected M2 macrophages decreased SUNE-1 cells in the G0/G1 phase, and increased SUNE-1 cells in the S and G2/M phases. d Co-culture with miR-18a inhibitors or OE-TGFBR3-transfected M2 macrophages increased CNE2 cells in the G0/G1 phase, and decreased CNE2 cells in the S and G2/M phases; *피 <0.05; **P <0.01. Measurement data were expressed as mean ± standard deviation, N =3. Comparisons among multiple groups were analyzed by one-way ANOVA, followed by Tukey’s post hoc test
miR-18a from M2 macrophages inhibits NPC cell apoptosis. 아 miR-18a mimics or si-TGFBR3 decreased apoptosis of SUNE-1 cells. ㄴ miR-18a inhibitors or OE-TGFBR3 increased apoptosis of CNE2 cells. ㄷ Co-culture with miR-18a mimics- or si-TGFBR3-transfected M2 macrophages decreased apoptosis of SUNE-1 cells. d Co-culture with miR-18a inhibitors or OE-TGFBR3-transfected M2 macrophages increased apoptosis of CNE2 cells; *피 <0.05; **P <0.01. Measurement data were expressed as mean ± standard deviation, N =3. Comparisons among multiple groups were analyzed by one-way ANOVA, followed by Tukey’s post hoc test
Upon transfection with miR-18a inhibitors or OE-TGFBR3, CNE2 cells in the G0/G1 phase trended toward an elevation while those in the S and G2/M phases toward a reduction, and cell apoptosis rate raised (Figs. 6b and 7b).
With the purpose to decode the mechanism of miR-18a from M2 macrophages in NPC cell cycle distribution and apoptosis, M2 macrophages transfected with miR-18a mimics, miR-18a inhibitors, si-TGFBR3, or OE-TGFBR3 were co-cultured with SUNE-1 cells or CNE2 cells in the Transwell chamber. Co-cultured with untransfected, or miR-18a mimics-transfected or si-TGFBR3-transfected M2 macrophages, reduced SUNE-1 cells were displayed in the G0/G1 phase and increased cells in the S and G2/M phases, and SUNE-1 cell apoptosis rate decreased (Figs. 6c and 7c).
Co-cultured with untransfected M2 macrophages, CNE2 cells in the G0/G1 phase reduced, cells in the S and G2/M phases increased, and apoptosis rate declined. On the contrary, co-cultured with miR-18a inhibitors-transfected or OE-TGFBR3-transfected M2 macrophages, CNE2 cells in the G0/G1 phase elevated while those in the S and G2/M phases decreased, and apoptosis rate elevated (Figs. 6d and 7d).
miR-18a from M2 Macrophages Reduces p-Smad1/t-Smad1 and Elevates p-Smad3/t-Smad3 in NPC Cells
Western blot assay detected TGF signaling pathway-related proteins in NPC cells to further explain the effects of miR-18a and TGFBR3 on TGF signaling pathway.
It was explained that transfection of miR-18a mimics or si-TGFBR3 reduced p-Smad1/t-Smad1 and elevated p-Smad3/t-Smad3 in SUNE-1 cells (Fig. 8a).
miR-18a from M2 macrophages decreases p-Smad1/t-Smad1 and increases p-Smad3/t-Smad3 in NPC cells. 아 miR-18a mimics or si-TGFBR3 in SUNE-1 cells decreased p-Smad1/t-Smad1 and elevated p-Smad3/t-Smad3. ㄴ miR-18a inhibitors or OE-TGFBR3 in CNE2 cells increased p-Smad1/t-Smad1 and decreased p-Smad3/t-Smad3. ㄷ Co-culture with miR-18a mimics- or si-TGFBR3-transfected M2 macrophages decreased p-Smad1/t-Smad1 and elevated p-Smad3/t-Smad3. d Co-culture with miR-18a inhibitors or OE-TGFBR3-transfected M2 macrophages increased p-Smad1/t-Smad1 and decreased p-Smad3/t-Smad3; *피 <0.05; **P <0.01. Measurement data were expressed as mean ± standard deviation, N =3. Comparisons among multiple groups were analyzed by one-way ANOVA, followed by Tukey’s post hoc test
Transfection with miR-18a inhibitors or OE-TGFBR3 led to declined p-Smad3/t-Smad3 and increased p-Smad1/t-Smad1 in CNE2 cells (Fig. 8b).
miR-18a from M2 macrophages influencing TGF signaling pathway in NPC cells was determined by Western blot assay through testing TGF signaling pathway-related proteins in SUNE-1 cells and CNE2 cells which had co-cultured with miR-18a mimics-, miR-18a inhibitors-, si-TGFBR3-, or OE-TGFBR3-transfected M2 macrophages in the Transwell chamber.
SUNE-1 cells co-cultured with untransfected, miR-18a mimics-transfected, or si-TGFBR3-transfected M2 macrophages were manifested with reduced p-Smad1/t-Smad1 and incremental p-Smad3/t-Smad3 (Fig. 8c).
Co-cultured with untransfected M2 macrophages, CNE2 cells trended toward declined p-Smad1/t-Smad1 and elevated p-Smad3/t-Smad3. In an opposite way, CNE2 cells were demonstrated with increased p-Smad1/t-Smad1 and decreased p-Smad3/t-Smad3 when co-cultured with miR-18a inhibitors-transfected or OE-TGFBR3-transfected M2 macrophages (Fig. 8d).
miR-18a from M2 Macrophages Induces Tumor Growth in Nude Mice with NPC
Tumor xenografts were conducted on nude mice to further elucidate the impacts of miR-18a and TGFBR3 on tumor growth of NPC.
It was indicated that injected with miR-18a mimics-transfected or si-TGFBR3-transfected SUNE-1 cells, mice were manifested with enlarged tumor volume and heavier tumor weight (Fig. 9a).
miR-18a from M2 macrophages promotes tumor growth in nude mice with NPC. 아 miR-18a mimics or si-TGFBR3 in SUNE-1 cells increased tumor volume and weight. ㄴ miR-18a inhibitors or OE-TGFBR3 in CNE2 cells decreased tumor volume and weight. ㄷ Co-culture with miR-18a mimics- or si-TGFBR3-transfected M2 macrophages increased tumor volume and weight. d Co-culture with miR-18a inhibitors or OE-TGFBR3-transfected M2 macrophages decreased tumor volume and weight; *피 <0.05; **P <0.01. Measurement data were expressed as mean ± standard deviation, three nude mice in each group. Comparisons among multiple groups were analyzed by one-way ANOVA, followed by Tukey’s post hoc test
Reduced tumor volume and weight were presented in mice with injection of miR-18a inhibitors-transfected or OE-TGFBR3-transfected CNE2 cells (Fig. 9b).
Tumor growth was observed in mice which had injected with miR-18a mimics-, miR-18a inhibitors-, si-TGFBR3-, or OE-TGFBR3-transfected M2 macrophages to illustrate the mechanism of miR-18a from M2 macrophages in NPC.
After co-culture with untransfected, miR-18a mimics-transfected or si-TGFBR3-transfected M2 macrophages, SUNE-1 cells were injected into mice and mice were observed with larger tumor volume and heavier tumor weight (Fig. 9c).
CNE2 cells were co-cultured with M2 macrophages and injected into mice with the results suggesting growing tumor volume and weight. Both tumor volume and weight were inclined to reduce when mice were injected with CNE2 cells which had co-cultured with miR-18a inhibitors-transfected or OE-TGFBR3-transfected M2 macrophages (Fig. 9d).
Discussion
NPC refers to a polygenic disease threatened by a wide range of factors [21]. MiRNAs are previously implied to participate in the pathogenesis of NPC via regulation of their target genes which are indicators of cellular processes and pathways [22]. Concretely, miR-18a advances NPC progression by miRNA biogenesis impairing [6]. Given that this study goes forward to decipher the combined interactions of miR-18a from M2 macrophages and TGFBR3 in NPC with the conclusion elucidating that miR-18a from M2 macrophages stimulates NPC progression via TGFBR3 inhibition (Fig. 10).
Schematic representation of macrophage-derived exosomal miR-18a in NPC and the involvement of TGFBR3-mediated TGF-β signaling pathway
At the start of this study, macrophages are stimulated by IL-4 to differentiate to M2 macrophages which are found to enrich the expression of miR-18a. As we know, during macrophage polarization, miRNA’s expression was altered [23]. In addition, M2 polarization enriches genes which are involved in the cell cycle and metabolic processes, and the M2 phenotype is conducive to tumor growth and angiogenesis in neoplastic tissues [24]. Based on the M2 macrophages-enriched miR-18a, a series of experiments were successfully conducted.
Initially, our study has uncovered that miR-18a is highly expressed while TGFBR3 is poorly expressed in NPC cells. Drawn from a previous study, it is concluded that miR-18a is overexpressed in NPC tissues with its association with lymph node metastasis and clinical stage [5]. Besides that, miR-17-92 cluster members including miR-18a are documented to be overexpressed in NPC tissues [25]. Furthermore, upregulated miR-18a is reported to demonstrate in NPC tissues which is connected with tumor node metastasis stage and tumor size [4]. Experimentally, except for the downregulated TGFBR3 in tongue squamous cell carcinoma [26], there has been another study depicting reduced TGFBR3 in clear-cell renal cell carcinomas accompanied by unwanted prognosis [27]. Anyhow, the results in this study are consistent with these study findings to some extent.
In order to explore the roles of miR-18a and TGFBR3 in NPC cell progression, we have conducted a series of assays with the results indicating that upregulated miR-18a or downregulated TGFBR3 triggers NPC cell progression while miR-18a repression or TGFBR3 elevation has the opposite effects on NPC cells. Widely, suppression of miR-18a is evidenced to hamper cell progression in malignancies including ovarian cancer, colitis-associated colorectal cancer, and hepatocellular carcinoma [28,29,30]. Narrowly, an existed study has pronounced that upregulated miR-18a promotes NPC cell progression via mediation of DICER1 [6]. In addition, it is noticed that overexpressed miR-18a in NPC is believed to connect with NPC metastasis and repressed miR-18a partially contributes to better prognosis of NPC patients [31]. Lately, it is surveyed that downregulation of miR-18a is capable of discouraging NPC proliferation, invasion, and migration [4]. Additionally, a decrease in TGFBR3 expression is regarded to link with laryngeal squamous cell carcinoma (LSCC) invasion and miR-223/TGFBR3 axis regulation takes part in LSCC progression inhibition [32]. TGFBR3 elevation is documented to restrict NPC cell viability, induce apoptosis, and activate pro-apoptosis signaling pathways [14]. Previously, a study has indicated that upregulation of TGFBR3 promotes apoptosis and cells arrested in the G2/M phase, resulting in impaired cell viability and migration in salivary gland adenoid cystic carcinoma [33]. Intriguingly, it is formerly described that induction of TGFBR3 contributes to disrupt intrahepatic cholangiocarcinoma progression [34].
Despite the protective role of lowly expressed miR-18a and overexpressed TGFBR3 in NPC cell in vitro, we have performed tumor xenografts in nude mince in vivo for further verification with the results explaining that miR-18a knockdown or TGFBR3 elevation restrains tumor growth in nude mice. As demonstrated in a prior study, miR-18a-injected nude mice show with enhanced tumor growth [5] and conversely, the miR-18a antagomir-injected nude mice are displayed with suppressed tumor growth in NPC [4]. In the light of the TGFBR3 reduction in tumor growth, it is suggested that poorly expressed TGFBR3 provokes tumor formation in clear-cell renal cell carcinoma [27]. In the opposite way, an increase in TGFBR3 is recognized to hinder tumor growth in lung cancer with the presence of long non-coding RNA ADAM metallopeptidase with thrombospondin type 1 motif, 9 antisense RNA 2 elevation, and miR-223-3p suppression [35]. This study has also predicted and verified that TGFBR3 is a target gene of miR-18a. But, more studies still need to be conducted for further verification.
Conclusion
Generally speaking, this study elaborates the concrete mechanisms that miR-18a from M2 macrophages inhibits TGFBR3 expression to exacerbate the progression of NPC via TGF-β signaling pathway, the results of which is abrogated by miR-18a knockdown or TGFBR3 elevation. This study updates the therapeutic target for NPC. However, a large cohort researches are still in need for in-depth explorations.