복구된 microRNA-133a-3p 또는 고갈된 PSAT1은 GSK3β/β-카테닌 경로를 억제하여 내피 세포 손상 유발 두개내 동맥류를 억제합니다.
초록
두개내 동맥류(IA)에서 microRNA-133a-3p(miR-133a-3p)의 기능적 역할에 대해서는 명확하지 않습니다. 따라서, 본 연구의 목적은 phosphoserine aminotransferase 1(PSAT1)/glycogen synthase kinase 3β(GSK3β)/β-catenin 신호 전달을 통한 혈관 내피 손상 유도 IA의 조절에 대한 miR-133a-3p의 조절 역할을 조사하는 것이었습니다. 좁은 길. 정상적인 두개내 세동맥 조직 및 IA 조직은 뇌 외상 및 IA가 있는 환자로부터 수집되었습니다. 조직에서 miR-133a-3p, PSAT1, GSK3β 및 β-카테닌의 발현은 RT-qPCR 및 웨스턴 블롯 분석에 의해 결정되었습니다. 인간 IA의 내피 세포(EC)를 배양하고 miR-133a-3p 모방체 및 si-PSAT1로 처리하여 내피 세포 이동, 세포자멸사 및 증식에서의 기능을 결정했습니다. EC에서 miR-133a-3p, PSAT1, GSK3β, β-catenin, Ki-67, CyclinD1, Bax 및 Bcl-2의 발현은 RT-qPCR 또는 웨스턴 블롯 분석에 의해 테스트되었습니다. 또한, IA 쥐 모델은 생체 내 IA 조직에서 miR-133a-3p, PSAT1, GSK3β, β-카테닌, VEGF 및 MMP-9의 병리학적 변화 및 발현을 검출하기 위해 확립되었습니다. miR-133a-3p의 발현은 IA의 수 및 크기와 관련이 있었다. MiR-133a-3p 발현은 사망했고 PSAT1, GSK3β 및 β-카테닌 발현은 IA에서 증가했습니다. 복원된 miR-133a-3p 및 고갈된 PSAT1은 병리학적 변화를 완화했습니다. IA에서 감소된 PSAT1, GSK3β 및 β-카테닌 발현; 생체 내 IA 조직에서 세포 사멸을 억제하고 IA EC의 증식 및 이동을 촉진할 뿐만 아니라 VEGF 및 MMP-9 발현을 감소시켰습니다. 우리의 연구는 miR-133a-3p의 과발현 또는 PSAT1의 하향 조절이 내피 세포 손상을 억제하고 IA에서 GSK3β/β-카테닌 경로를 억제함으로써 내피 세포 증식을 촉진함을 시사합니다. MiR-133a-3p는 IA의 잠재적 후보 표지자이자 치료 표적이 될 수 있습니다.
가설 제시
이 현재 연구에서 우리는 miR-133a-3p/PSAT1 축이 GSK3β/β-카테닌 경로의 조절을 통해 내피 세포 손상 유발 IA에 영향을 미칠 수 있다고 추측할 수 있습니다.
가설 테스트
이 가설을 검증하기 위해 임상 샘플, 인간 IA의 내피 세포(EC)를 수집하고 IA 과정에서 miR-133a-3p 및 PSAT1의 기능을 설명하기 위해 IA 쥐 모델을 수립했습니다.
가설의 의미
우리의 연구는 miR-133a-3p의 과발현 또는 PSAT1의 하향 조절이 내피 세포 손상을 억제하고 IA에서 GSK3β/β-카테닌 경로를 억제함으로써 내피 세포 증식을 촉진한다는 가설을 확인합니다. 이러한 발견은 IA에 대한 새로운 표적 요법에 대한 새로운 통찰력을 제공합니다.
소개
두개내 동맥류(IA)는 뇌혈관 장애의 일종으로 뇌동맥이 비정상적으로 불룩하게 부풀어오를 뿐만 아니라 IA 파열로 인한 지주막하 출혈(SAH)을 특징으로 하며 높은 사망률과 이환율을 동반합니다[1]. 파괴적인 질병으로서 IA의 발병기전은 명확하지 않다[2]. IA는 드문 가족형이지만 일반적으로 고혈압, 흡연 및 기타 전통적인 위험 요인으로 인한 후천적 혈관 손상의 결과로 생각됩니다[3]. 파열 위험이 높은 환자에서 파열되지 않은 동맥류의 향후 파열을 예방하기 위해 혈관내 코일링 또는 미세수술적 클리핑이 활용되었습니다[4]. IA 외과 수술에서 상당한 진전이 있었지만 IA 환자의 수술 후 회복은 여전히 좋지 않습니다[5]. IA 치료의 어려운 상황으로 인해 메커니즘을 더 탐구하고 새로운 치료 전략을 찾아야 합니다.
MicroRNA(MiRNA)는 전사 후 수준에서 번역을 억제하거나 mRNA 분해를 매개하여 표적 유전자의 발현을 조절하는 비암호화 RNA 부류입니다[6]. 여러 악성 신생물에서 종양 억제제인 miR-133a-3p와 miR-133a-3p의 과발현이 대장암(CRC) 세포의 성장을 억제할 수 있다는 것이 밝혀졌습니다[7]. 이전 연구에서는 자가포식 매개 글루타민분해를 차단한다는 관점에서 miR-133a-3p가 위암 전이와 성장을 더욱 억제한다고 주장했다[8]. 또한 miR-133a-3p가 심장 발달 및 심장 비대 조절에 관여한다는 연구 결과가 발표되었습니다[9]. 연구에 따르면 miR-195-5p의 상향 조절은 포스포세린 아미노트랜스퍼라제 1(PSAT1) 의존성 GSK3β/β-카테닌 신호 전달 경로를 억제함으로써 난소암에서 혈관신생과 시스플라틴 내성을 감소시키는 것으로 나타났습니다[10]. 또 다른 연구에서는 miR-365가 PSAT1을 조절하여 식도 편평 세포 암종(ESCC)에서 세포 침윤 및 성장을 억제한다고 보고했습니다[11]. PSAT1은 세린 생합성과 관련된 효소입니다. 그것은 원래 양의 뇌에서 정제되었으며 많은 조직에서 높은 수준을 가지고 있습니다[12]. PSAT1이 GSK3β/β-카테닌 신호 전달 경로의 조절을 통해 유방암에서 세포 주기 진행을 매개하는 것으로 밝혀졌습니다[13]. Liu et al. 또한 PSAT1은 ESCC의 발달에 기능을 발휘하고 열악한 생존을 예측한다고 지적합니다. 따라서 항암치료의 유망한 표적이 될 수 있다[14]. 앞서 언급한 분석을 감안할 때 이 연구는 IA에서 miR-133a-3p/PSAT1/GSK3β/β-카테닌 축의 기능적 역할에 대한 새로운 접근 방식에 기여할 것으로 기대됩니다.
자료 및 방법
윤리 성명서
이 연구는 톈진 중국 전통 의학 대학의 제1 교수 병원의 기관 검토 위원회의 승인을 받았습니다. 모든 참가자는 사전 동의 문서에 서명했습니다. 모든 동물 실험은 국제 위원회의 실험 동물 관리 및 사용 가이드와 함께 집계되었습니다.
연구 주제
2016년 1월부터 2018년 3월까지 천진중의약대학 제1교의병원 신경외과에서 치료한 IA로 인한 SAH 사례를 선별하였다. 미세수술로 얻은 75명의 IA 환자의 병리학적 샘플을 수집하여 31-55세 사이의 남자 29명과 여자 46명을 포함하는 IA 그룹으로 분류했으며 평균 연령은 44.98±6.79세였습니다. 천진중의약대학 제1교원병원에서 동시에 신경외과 치료를 받은 뇌외상 환자를 대조군으로 선정하였다. 또한 34세에서 56세 사이의 남자 43명과 여자 32명을 포함하여 외상성 수술 또는 내부 감압술에 의해 정상적인 두개내 세동맥 조직이 축적된 75예의 평균 연령은 48.14±8.68세였다. 고혈압, 당뇨병 또는 종양의 병력이 있는 환자는 제외되었습니다. IA 그룹과 대조군(둘 다 P> 0.05).
샘플 처리 및 보존
수술적 절제 후 두 그룹의 일부 샘플을 포름알데히드로 고정하고 저농도에서 고농도로 구배 알코올로 탈수하고 파라핀으로 포매했습니다. 그런 다음, 샘플을 헤마톡실린-에오신(HE) 염색 및 면역조직화학적 염색을 위해 슬라이스하였다. 일부 샘플을 액체 질소 탱크에 신속하게 넣은 다음 웨스턴 블롯 분석 및 역전사 정량적 중합효소 연쇄 반응(RT-qPCR)의 검출을 위해 - 80°C 극저온 냉장고로 옮겼습니다. 일부 샘플은 전자현미경 관찰을 위해 글루타르알데히드로 고정되었고 일부 샘플은 EC 분리에 사용되었습니다.
전자 현미경 관찰
샘플을 3% 글루타르알데히드로 고정한 다음, 1% 사산화 오스뮴으로 다시 고정했습니다. 샘플을 아세톤으로 탈수하고 Epon812로 포매한 후 두께 3μm의 반-얇은 부분으로 슬라이스했습니다. 마지막으로 샘플을 uranyl acetate와 lead citrate로 이중염색하고 H-600IV 투과전자현미경(Hitachi, Tokyo, Japan)으로 관찰하였다.
그 염색
준비된 파라핀 절편을 60°C에서 30분 동안 굽습니다. 위의 단계가 완료된 후 조직 조각을 크실렌에 고정하고 절대 알코올 구배를 사용하여 탈수하고 PBS(인산염 완충 식염수)로 세척했습니다. 조직 절편을 헤마톡실린으로 염색하고, 암모니아에서 몇 초 동안 처리하고, 에오신으로 2분 동안 염색하고, 탈수하고, 투명하게 하였다. 그런 다음, 조직 조각을 중성 검으로 적하하고 커버 유리로 밀봉했습니다. 마지막으로 관찰 및 기록을 위해 현미경(Nikon, Tokyo, Japan)이 채택되었습니다.
면역조직화학 염색
면역조직화학 키트는 Zymed Laboratories(San Francisco, CA, USA)에서 생산했습니다. 파라핀 조각을 탈랍 및 수화시킨 후, 파라핀 조각을 크실렌 용액에 5분 × 3회 침지시켰다. 100% 알코올에 3분 × 2회 담근 후 95~75% 알코올에 차례로 3분 담가두었습니다. 탈랍 후 슬라이스를 3% 과산화수소와 함께 15분 동안 배양하여 내인성 과산화효소의 활성을 제거했습니다. 슬라이스에 차단 용액을 떨어뜨리고 일반 염소 혈청 작업 용액과 함께 15분 동안 배양한 다음 매트릭스 메탈로프로테아제(MMP)-9(5μg/mL) 및 혈관 내피 성장 인자(VEGF)(1:250)에 대한 1차 항체로 프로브했습니다. , Abcam, Cambridge, MA, USA)(음성 대조군(NC)용 PBS) 및 1-2시간 동안 배양. 슬라이스를 30-60분 동안 바이오틴화 이차 항체 작업 용액으로 다시 조사했습니다. 슬라이스에 양고추냉이 과산화효소로 표지된 스트렙타비딘/과산화효소 작동액을 첨가하고 새로 제조된 디아미노벤지딘(DAB) 용액을 적하하고 대조염색하고 차단했습니다. 이미지는 Nikon SPOT FlexTM 이미징 시스템을 통해 알게 되었습니다. MMP-9 및 VEGF 단백질 발현 영역은 면역조직화학적 정량분석 소프트웨어로 측정하였다. 5개의 고배율 시야는 각 샘플에서 양성세포의 축적 영역에서 무작위로 검출되었으며, 각 스크린의 평균 흡광도는 통계적 분석을 위한 평균값으로 사용되었습니다.
EC의 격리 및 문화
EC는 정상 두개내 세동맥 조직 및 IA 조직으로부터 분리되고 배양되었다. 조직을 3mm
2
로 슬라이스했습니다. 단편을 만들고 0.1% 콜라게나제 B/0.1% 디스파제(Roche, Basel, Switzerland)에서 25분 동안 인큐베이션했습니다. 조직을 분리하고 2mL 피펫으로 2분 동안 분쇄하고 100μm 스트레이너(BD Biosciences, NJ, USA)로 여과하여 EC를 분리했습니다. 세포 현탁액을 원심분리한 다음, 성장 인자 및 20% 소 태아 혈청(PromoCell, Heidelberg, Germany)을 함유하는 배양 배지 MV2에 재현탁시켰다. 다음으로, 세포를 10
4
의 밀도로 피브로넥틴(Sigma Aldrich Inc., St. Louis, MO, USA)이 코팅된 접시에 파종했습니다. 셀/cm
2
(1μg/cm
2
) 5% CO2로 1일 동안 성장 . 파종 다음날, 세포를 PBS로 세척하여 부착되지 않은 세포를 제거하고 새로운 배지에 넣었다. 약 80-100% 합류에 도달했을 때, 배양물은 Ulex europaeus Agglutinin I(UEA) 코팅(Vector Laboratories, Ltd., Peterborough, UK) 비드(Dynabeads M-450 Tosylactivated, Oxoid, Hampshire, UK)에 의해 면역 분리에 노출되었습니다. 순수한 EC를 얻습니다. 렉틴 코팅된 비드에 결합된 EC는 자성 입자 농축기로 축적되었고 결합되지 않은 세포는 기본 배지로 2회 세척을 통해 제거되었습니다. UEA 양성 세포를 배양 배지에 재현탁하고 피브로넥틴 코팅 접시에 접종하여 접착력과 성장을 개선했습니다. 문화는 4-6일 이내에 융합되었습니다.
EC 식별
EC는 세포 표면 CD31 항체 및 FVII-인자 관련 항원을 사용한 면역세포화학적 염색에 의해 확인되었습니다. 세포를 PBS로 두 번 세척하고, 4% 파라포름알데히드로 고정하고, 3% H2와 함께 인큐베이션했습니다. O2 10-15분 동안 내인성 과산화효소 활성을 제거한 다음 천공된 세포에 10분 동안 0.1% Triton X-100과 함께 배양합니다. 세포에 특정 1차 항체인 인자 VII(1:200), CD31(1:400, Roche, Basel, Switzerland)을 적하하고 4°C에서 밤새 인큐베이션했습니다. 그 다음, 양고추냉이 퍼옥시다제 2차 항체로 표지된 면역글로불린 G(1:50)를 세포에 적하하였다. 세포를 37°C에서 45분 동안 인큐베이션하고 4분 동안 빛을 피하는 DAB로 현상했습니다. 이후 증류수로 발색을 종료하고 현미경으로 사진을 관찰하였다. 형광 도립 위상차 현미경으로 세포를 관찰하고, 10개의 시야에서 양성 세포와 총 세포 수를 무작위로 세었다. 양성 염색 세포율 =(양성 세포 수/총 세포 수) × 100%. 해당 NC 그룹을 설정하고 1차 항체를 PBS로 교체하고 나머지 단계는 위와 같이 수행했습니다.
세포 그룹화 및 형질감염
miR-133a-3p와 PSAT1이 IA의 EC에 미치는 영향을 연구하기 위해 EC를 대조군(트랜스펙션이 없는 정상 혈관 EC), IA 그룹(트랜스펙션이 없는 IA 혈관 EC), 모방 NC 그룹(miR로 형질감염)으로 그룹화했습니다. -133a-3p 모방 NC), miR-133a-3p 모방 그룹(miR-133a-3p 모방으로 형질감염됨), 작은 간섭 RNA(si)-NC 그룹(si-PSAT1 NC로 형질감염됨), si-PSAT1 그룹(트랜스펙션됨) si-PSAT1 포함) 및 miR-133a-3p 모방 + 과발현(oe)-PSAT1 그룹(miR-133a-3p 모방 및 oe-PSAT1로 형질감염됨). 그 중, MiR-133a-3p 모방체, miR-133a-3p 모방체, si-PSAT1, si-NC, oe-PSAT1은 GenePharma Co., Ltd.(Shanghai, China)에서 고안하고 구성하였다. Transfection은 Lipofectamine
TM
지침에 따라 엄격하게 수행되었습니다. 2000 형질감염 시약(Thermo Fisher Scientific, MA, USA).
유세포분석
배양 접시의 배지를 버리고 세포를 PBS로 2회 헹구었다. 0.25% 트립신으로 세포를 분리하고 800rpm에서 5분간 원심분리한 후 1×바인딩 버퍼에 현탁하고 세포 밀도를 1×10⁷로 조정했다. 세포/mL. 세포 현탁액(100μL)을 5μL 요오드화 프로피듐(PI, 20μg/mL) 및 아넥신 V-FITC와 함께 20분 동안 인큐베이션한 다음, 400μL 1x 결합 완충액과 혼합했습니다. 유세포 분석기(BD FACSArial I cell sorter)를 사용하여 1시간 이내에 세포 사멸을 검출했습니다. 결과는 스캐터 맵의 왼쪽 하단 사분면(Q4)이 건강한 살아있는 세포(FITC
-
/PI
−
), 초기 아폽토시스 세포(FITC
+
)로서 오른쪽 하단 사분면(Q3) /PI
−
), 오른쪽 상부 사분면(Q2)은 후기 세포사멸 및 세포사멸 세포(FITC
+
/PI
+
); apoptosis rate =조기 apoptosis 백분율(Q3) + late apoptosis 백분율(Q2).
3-(4, 5-디메틸티아졸-2-일)-2, 5-디페닐테트라졸륨 브로마이드(MTT) 분석
세포 현탁액을 제조하기 위해 트립신으로 세포를 분리하였다. 세포를 도립 현미경으로 계수하였다. 세포 농도를 5 × 10
4
로 조정했습니다. 세포/mL. 세포를 96-웰 배양 플레이트에 접종하였다. 48시간 후, 세포를 4시간 동안 20μL MTT 용액과 함께 인큐베이션했습니다. 각 웰의 MTT를 150 μL 디메틸 설폭사이드로 용해시켰다. EC의 광학 밀도(OD) 값은 570 nm의 파장에서 측정되었습니다. EC의 증식 속도는 OD 값에 비추어 계산되었습니다.
스크래치 테스트
각 그룹의 세포는 2 × 10
5
세포/웰. 각 그룹에 세 개의 평행 우물이 설정되었습니다. 약 90% 합류에 도달했을 때, 세포 성장 평면은 멸균된 일회용 1mL 마이크로피펫 팁으로 긁혔습니다. 각 웰은 한 번 긁혔고 각 웰의 스크래치 길이와 깊이는 일정했습니다. 스크래치 후 부유 세포를 제거하고 새로운 배지로 교체하고 24시간 배양 후 현미경으로 스크래치 간격을 관찰하였다. 긁힌 상처의 치유 영역은 National Instrument Vision Assistant 8.6 소프트웨어에 의해 열거되었습니다. 세포 이동 =상처 치유 면적/초기 긁힌 상처 면적 × 100%.
동물 실험 및 IA 쥐 모델 확립
7주령의 Sprague-Dawley(SD) 쥐 84마리와 체중 180~200g(Laboratory Animals Center, Academy of Military Medical Sciences, Beijing, China)이 선택되었습니다. 쥐는 동물 실험 센터에 수용되었습니다. 사료 공급 조건은 자연광과 함께 22-25°C 및 50-60% 습도에서 제어되었습니다. 모든 랫트는 케이지당 4마리의 랫트가 있는 표준 랫트 케이지에서 먹였습니다. 쥐에게 도시의 위생적인 식수와 일반 쥐 사료를 먹였습니다. 3일마다 쿠션을 교체하고 케이지를 세척하고 살균하였다. IA 쥐는 참고문헌[15]에 따라 모델링되었습니다. 파열된 동맥류는 쥐에서 다음과 같은 증상이 나타났을 때 확인되었습니다[16]:1, 24시간 동안 체중 감소(약 10% 체중 감소)에 의해 수행된 섭식 또는 음주 활동 감소; 2, 들어올릴 때 몸통과 앞다리의 굴곡; 3, 정상적인 자세로 한쪽으로 걷기; 4, 한쪽으로 기울고 쉬고 자발적인 활동이 없습니다. 이러한 증상을 보이는 쥐는 수술 3개월 후 안락사시켰다. 수술 중 IA 조직을 채취하여 PBS로 관류하고 글루타민산이 포함된 파란색 염료를 대뇌 동맥에 관류했습니다.
IA 쥐의 치료 및 개입
위의 84마리의 쥐를 무작위로 7개의 그룹으로 나누었고 각 그룹에는 12마리의 쥐가 있었습니다. 치료 방법은 다음과 같다:정상군(모델링을 수행하지 않음); IA 그룹(PBS 및 Lipofectamine 2000의 100μL 혼합물로 정위 주입됨); 모방 NC 그룹(miR-133a-3p 모방 NC 및 Lipofectamine 2000의 100μL 혼합물을 사용한 정위 주입); miR-133a-3p 모방 그룹(miR-133a-3p 모방 및 Lipofectamine 2000의 100μL 혼합물을 사용한 정위 주입); si-NC 그룹(si-PSAT1 NC 및 Lipofectamine 2000의 100μL 혼합물을 사용한 정위 주사); si-PSAT1 그룹(si-PSAT1과 Lipofectamine 2000의 100μL 혼합물을 사용한 정위 주사); 및 miR-133a-3p 모방체 + oe-PSAT1 그룹(miR-133a-3p 모방체와 oe-PSAT1 및 Lipofectamine 2000의 100μL 혼합물을 사용한 정위 주입). 위의 모든 주사는 1일 1회 실시하였으며, 이들 쥐를 특정 무병원체(SPF) 동물실험실에서 12주간 사육하였다. 12주 후, 각 그룹의 쥐를 마취시키고 전술한 바와 같이 흉강을 개방하였다. 대동맥으로 삽관된 좌심실에서 대동맥을 절단하여 혈액을 방출했습니다. 동시에 헤파린나트륨(37℃)이 포함된 식염수 30mL를 관류한 후, 10% 폴리포름알데히드/0.1M 인산완충액(pH 7.4)을 관류를 통해 천천히 뇌에 주입하였다. 관류가 고정된 후 뇌가 열렸습니다. 두개골 기저부의 동맥고리를 분리하여 수술현미경으로 제거하고, 현미경으로 동맥류의 변화를 관찰하고, 병리학적 특성을 조사하였다. 모방 NC, miR-133a-3p 모방, si-NC, si-PSAT1 및 oe-PSAT1은 Shanghai Sangon Biotechnology Co., Ltd.(중국 상하이)에서 합성했습니다.
혈역학 감지
수술 3일 전과 중재 치료 후 12주에 쥐의 좌총경동맥 끝단의 혈류량을 측정하였다. 방법은 다음과 같았다:쥐를 흡입용 마취기의 동물 틀에 넣고 흐름 매개변수를 조정했다. 쥐가 안정적으로 숨을 쉬고 꼬리를 만졌을 때 뚜렷한 반응이 없으면 실험 수술대에 고무줄로 고정시켰다. 쥐의 목털을 전기면도기로 면도했다. 컬러 도플러 초음파 검출기를 켜고 좌측 총경동맥 말단의 혈류 속도를 측정하고 프로브에 적절한 커플링제를 도포한 후 데이터를 기록하였다. 측정 후 쥐를 조심스럽게 다시 케이지에 넣어 마취 후 깨어날 때까지 호흡기가 막히지 않도록 했습니다.
RT-qPCR
total RNA는 RNA simple total RNA 추출 키트(TIANGEN Biotechnology Co., Ltd., Beijing, China)를 기반으로 추출되었습니다. 고품질의 RNA는 자외선 분석과 포름알데히드 변성 전기영동으로 확인하였으며 RNA는 PrimeScript RT 시약 키트를 이용하여 상보적인 DNA로 역전사되었습니다. PCR 반응은 SYBR Permix Ex Taq
II
에 의해 수행되었습니다. (다카라, 다롄, 랴오닝, 중국). PCR 프라이머는 Beijing ComWin Biotech Co., Ltd.(Beijing, China)에서 고안하고 합성했습니다(표 1). U6은 miR-133a-3p, PSAT1, GSK3β, β-catenin, Bax, Bcl-2, Ki-67 및 CyclinD1에 대한 내부 매개변수로 선택되었으며 GAPDH(glyceraldehyde phosphate dehydrogenase)를 내부 매개변수로 사용했습니다. 데이터는 2
−ΔΔCt
로 측정되었습니다. .
서부 얼룩 분석
세포와 조직에서 총 단백질을 추출하고 Bicinchoninic Acid Protein Assay Kit (Beyotime Institute of Biotechnology, Shanghai, China)를 사용하여 단백질 샘플을 정량화했습니다. 샘플을 1/4 부피의 5 × 샘플 버퍼와 혼합하고 5분 동안 끓였습니다. 10% 분리 젤과 5% 농축 젤을 전기 영동을 위해 선택했습니다. 막을 5% 탈지분유에서 60분 동안 부화시켰다. 막에는 1차 항체 PSAT1(1:500), GSK3β(1:500), β-카테닌(1:5000), Bax(1:1000), Bcl-2(1:1000), CyclinD1(1:200), Ki-67(1:5000), MMP-9(1㎍/mL), VEGF(1:1000)(Abcam, Cambridge, MA, USA). 그런 다음 이차 항체(1:2000)로 60분 동안 막을 부화시켰다. 막을 전기화학발광 반응 용액(Beyotime Institute of Biotechnology, Shanghai, China)에 1분 동안 담그고 유체를 제거한 후 식품 랩으로 덮었다. 멤브레인을 X-ray로 노출시켜 현상 및 고정 후 결과를 관찰하였다. GAPDH(1:10000, Abcam)는 로딩 컨트롤로 사용되었으며 단백질 이미지는 ImageJ2x 소프트웨어로 분석되었습니다.
이중 루시퍼라제 리포터 유전자 분석
miR-133a-3p와 PSAT1 사이의 표적 관계와 miR-133a-3p와 PSAT1 3' 비번역 영역(3'UTR) 사이의 결합 부위는 생물정보학 웹사이트(https://cm.jefferson.edu/rna22)에서 예측했습니다. /미리 계산됨/). miR-133a-3p 결합 부위를 포함하는 PSAT1 3'UTR 프로모터 영역의 서열을 증폭하고 pGL3-basic luciferase plasmid(Takara Bio Inc., Otsu, Shiga, Japan)에 클로닝하여 야생형(WT) 플라스미드( PSAT1 3'UTR의 PSAT1-WT), 돌연변이체(MUT) PSAT1-MUT 재조합 플라스미드는 PSAT1-WT 상의 miR-133a-3p 결합 부위를 점 돌연변이 키트(Takara Bio Inc., Otsu, Shiga , 일본). 대수 성장 단계의 혈관 EC를 96웰 플레이트에 접종했습니다. 합류가 약 70%에 도달하면 PSAT1-WT 및 PSAT1-MUT 플라스미드를 Lipofectamine 2000에 의해 모방 NC 및 miR-133a-3p 모방 플라스미드와 혼합하고 혈관 EC로 공동 형질감염시켰다. 형질감염 48시간 후 세포를 모아 용해하고 루시퍼라제 검출 키트(Promega Corporation, Madison, WI, USA)를 사용하여 루시퍼라제 활성을 확인했습니다.
통계 분석
모든 데이터는 SPSS 21.0 소프트웨어(IBM Corp., Armonk, NY, USA)에 의해 설명되었습니다. 열거 데이터는 비율 또는 백분율로 표시하였고 분석은 카이제곱 검정 또는 피셔 검정으로 결정하였다. 정규분포를 거친 측정 데이터는 평균±표준편차로 전달하였다. 두 그룹 간의 비교는 t에 의해 수행되었습니다. 여러 그룹 간의 비교는 일원 분산 분석(ANOVA)에 이어 Tukey의 사후 테스트로 분석되었습니다. 피 값 <0.05는 유의미한 것으로 간주되었습니다.
<섹션 데이터-제목="결과">
결과
IA 환자의 일반 데이터
Table 2와 같이 IA군과 대조군의 일반자료를 비교하였다. 구체적인 정보는 표 2에 나와 있습니다.
miR-133a-3p의 표현은 IA의 수 및 크기와 관련됨
miR-133a-3p 발현과 IA의 임상병리학적 특징 사이의 관계를 분석하여, IA에서 miR-133a-3p의 평균 상대 발현에 비추어 IA의 75건이 두 가지로 분포됨을 표 3에 상세히 설명하였다. 그룹:miR-133a-3p 고발현 그룹(n =47) 및 miR-133a-3p 저발현 그룹(n =28). miR-133a-3p와 다른 임상병리학적 매개변수 사이의 관계는 카이제곱 검정 또는 피셔 검정에 의해 통계적으로 분석되었습니다. 결과는 miR-133a-3p 발현이 연령, 성별, 모양 및 동맥류의 위치와 관련이 없음을 보여주었습니다(모든 P> 0.05), 그러나 동맥류의 수와 크기와 관련이 있습니다(둘 다 P <0.05).
MiR-133a-3p 발현이 감소하고 IA 조직에서 PSAT1, GSK3β 및 β-카테닌 발현이 증가
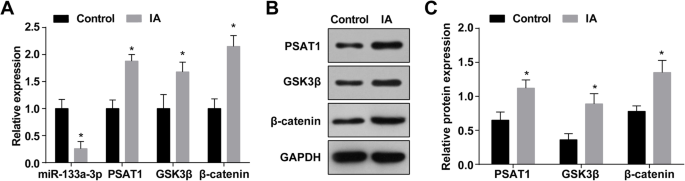
IA에서 miR-133a-3p의 발현을 RT-qPCR로 측정한 결과 정상 두개내세동맥 조직(대조군)에 비해 IA 조직(대조군)에서 miR-133a-3p 발현이 감소한 것으로 나타났다. IA 그룹) (P <0.05) (그림 1a). RT-qPCR 및 웨스턴 블롯 분석은 PSAT1, GSK3β 및 β-카테닌 발현이 정상 두개내 세동맥 조직(모두 P <0.05) (그림 1a-c).
<그림>
IA 조직에서 MiR-133a-3p 발현이 감소하고 PSAT1, GSK3β 및 β-카테닌 발현이 증가합니다. 아 IA군과 정상군에서 miR-133a-3p, PSAT1, GSK3β, β-catenin의 발현. ㄴ PSAT1, GSK3β 및 β-카테닌 발현의 단백질 밴드. ㄷ Western blot assay에 의한 IA군과 정상군에서 PSAT1, GSK3β, β-catenin의 단백질 발현. n =75, *피 <0.05 대 대조군. 측정 데이터는 평균 ± 표준편차로 표시하였으며, 두 그룹 간의 비교는 독립 표본 t에 의해 수행되었습니다. 테스트
IA 조직에서 동맥류 및 MMP-9 및 VEGF 발현의 병리학적 변화
정상 두개내 세동맥 조직과 IA 조직을 직접 관찰한 결과, 대조군에서는 동맥 조직의 혈관이 밝은 적색을 띠고 내강에서 명백한 동맥경화 플라크 및 측부 혈전이 발견되지 않았다는 것이 제시되었습니다. IA군의 동맥류 조직의 종양은 대부분 갈색 또는 암적색이었고 외관은 음낭 또는 방추형이었고 조직은 대부분 거칠었다. 종양을 절개했을 때 일부 종양 샘플의 종양 벽에 흰색 또는 암적색의 죽상동맥경화성 플라크가 나타났으며, 이는 편평하거나 원형 또는 타원형이었습니다. 일부 종양 샘플에서는 종양 공동에 벽화 혈전이 있었고 혈전의 질감은 부드러웠습니다. 종양의 목부부터 종양 벽의 두께가 점차 얇아지고, 일부는 종양 상단에 얇은 섬유막만 있었고 일부는 파열되기까지 했습니다. 파열된 동맥류의 틈이 종양 상단 또는 그 부근에 있었습니다.
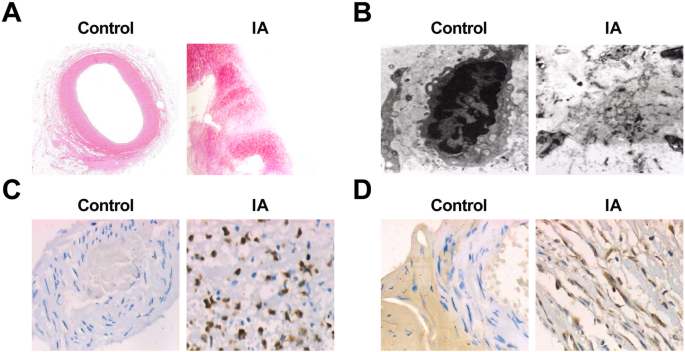
HE 염색은 광학현미경하에서 정상적인 두개내세동맥벽의 두께가 균일함을 보여주었다. 내부, 중간 및 외부 층의 해부학적 구조는 명확하고 손상되지 않았습니다. 각 층의 세포 형태는 정상이었고; 인접한 세포의 육종은 종종 밀접하게 형성됩니다. 벽의 염증 세포는 드물었습니다. IA군에서는 동맥류벽의 두개내동맥 분기점 상부의 원위외측혈관강에 형성된 국소돌기가 둔해지고 작아졌으며 국소 EC가 소실되었다. 소수의 샘플에서 평활근 세포층에서 내막으로의 이동과 근성 내막 세포 증식이 나타났습니다. EC는 감소하거나 심지어 사라졌습니다. 내피 세포층은 증식성 근내막 세포와 선형으로 배열된 EC, 또는 내강에 부착된 세포 사멸 EC 및 혈액 세포로 구성되었습니다. 액포가 퇴화되어 연속성 중단이 발생했습니다. 그 중 일부는 기저막과 함께 벗겨졌고 내막 콜라겐 섬유가 증가했습니다. 죽상 동맥 경화증이 바뀌었고 세동맥 벽이 분명히 더 얇아졌으며 많은 수의 결합 사다리 조직으로 채워졌습니다. 염증세포 침윤과 부분확산은 모든 층, 주로 중간막과 외막에서 관찰되었다. 일부 세포에서 지질 및 콜레스테롤 결정 침착물이 관찰되었습니다. 일부 종양 벽은 완전히 또는 국부적으로 얇아지고 바깥쪽으로 확장되었습니다(그림 2a, b).
<사진>
동맥류의 병리학적 변화와 IA에서의 MMP-9 및 VEGF 발현. 아 HE 염색(× 10) 하에서 대조군의 정상적인 두개내 세동맥 조직 절편. ㄴ HE로 염색된 IA 조직 섹션(× 10). ㄷ Ultrastructure of normal intracranial arterioles tissues in the control group under an electron microscope (× 10,000). d Ultrastructure of IA tissues under an electron microscope (× 10,000). 이 Expression of MMP-9 in the control group and the IA group by immunohistochemical staining (× 200). 에 Expression of VEGF in the control group and the IA group by immunohistochemical staining (× 200)
The sections of the normal intracranial arterioles tissues and IA tissues were observed by an electron microscope, and it performed that in normal intracranial arterioles tissues, the matrix fibers of the cerebral vascular wall could be seen clearly, and there was no endothelial injury, cell pyknosis, or degeneration. In the IA tissues, obvious endothelial cell injury, cell pyknosis, or vacuole degeneration were observed, the number of middle smooth muscle cells was declined, most of the nucleus pyknosis was appeared, and chromatin aggregation and apoptotic bodies could be seen. Some cells showed swelling of the mitochondria and disappearance of normal internal structure. The extracellular matrix that formed the cytoskeleton was blurred and showed amorphous floc. There were many fragments in the missing parts of the cells (Fig. 2c, d).
Immunohistochemical staining was utilized to test MMP-9 and VEGF expression, and the results revealed that there was no expression of MMP-9 and VEGF in 75 cases of the control group. It existed 60 cases of positive expression of MMP-9 in the 75 cases of IA samples. MMP-9 positive expression appeared in the inner and the outer membranes of IA wall, but the expression was not uniform. The positive expression was mainly characterized by a brownish yellow cytoplasm. The positive expression of VEGF was 66 cases in 75 cases of IA samples. In the wall of IA, there was a high positive expression in the middle and the outer membranes and a low positive expression in the intima. The positive expression was also mainly characterized by a brownish yellow cytoplasm (Fig. 2e, f). The expression of MMP-9 and VEGF in the two groups is shown in Table 4.
Identification of Vascular ECs
The expression of factor VIII and CD31 in ECs were analyzed by immunohistochemical staining. The results reported that vascular ECs reacted positively to factor VIII and CD31-related antigen antibodies, and the positive rate was 95%. In addition, there were a large number of brown particles in the cytoplasm, and the fifth passage of cells of brown staining was dramatically higher than the primary passage of cells (Fig. 3a, b).
Vascular ECs react positively to FVIII and CD31 related antigen antibodies. 아 Identification of ECs by CD31. ㄴ Identification of ECs by FVII
Upregulation of miR-133a-3p and Downregulation of PSAT1 Suppress Apoptosis and Advance Proliferation and Migration of ECs in IA
Flow cytometry, RT-qPCR, and western blot analysis were adopted for observing the apoptosis and Bax and Bcl-2 expression in ECs of IA after treated with miR-133a-3p mimic or si-PSAT1. It was indicated that compared to the control group, the apoptosis rate of cells and Bax expression was elevated in the IA group and the Bcl-2 expression was decreased (all P <0.05). The cell apoptosis and Bax and Bcl-2 expression in the IA group, mimic NC group, and si-NC group had no significant change (all P> 0.05). By comparison with the si-NC group and mimic NC group, the apoptosis rate of cells in the si-PSAT1 group and miR-133a-3p mimic group was suppressed, the Bax expression was declined, and the Bcl-2 expression was raised (all P <0.05). Versus the miR-133a-3p mimic group, the apoptosis rate and Bax expression were enhanced, and the Bcl-2 expression was reduced in the miR-133a-3p mimic + oe-PSAT1 group (all P <0.05) (Fig. 4a–e).
Highly expressed miR-133a-3p and lowly expressed PSAT1 inhibit apoptosis and promote proliferation and migration of IA ECs. 아 Detection of apoptosis of ECs by flow cytometry. ㄴ Detection of apoptosis rate of ECs in each group. ㄷ Bax and Bcl-2 expression in ECs detected by RT-qPCR. d Protein band of Bax and Bcl-2 expression. 이 Bax and Bcl-2 protein expression in ECs detected by western blot analysis. 에 MTT assay was used to detect proliferation activity of ECs in each group. 지 RT-qPCR was used to detect the expression of Ki-67 and CyclinD1 in each group of ECs. 아 Protein band of Ki-67 and CyclinD1 expression. 나 Ki-67 and CyclinD1 protein expression in ECs detected by western blot analysis. j Detection of the migration of ECs in each group by scratch test. 케이 Statistical results of endothelial cell migration in each group. 아니 =3, *P <0.05 vs. the control group. #P <0.05 vs. the mimic NC group. &P <0.05 vs. the si-NC group. +P <0.05 vs. the miR-133a-3p mimic group. Measurement data were depicted as mean ± standard deviation; data were assessed by one-way analysis of variance followed by Tukey’s post hoc test
MTT assay, RT-qPCR, and western blot analysis were utilized to observe the proliferation and the expression of Ki-67 and CyclinD1 in ECs of IA after treated with miR-133a-3p mimic or si-PSAT1. It was displayed that in contrast to the control group, the proliferation activity and Ki-67 and CyclinD1 expression were reduced in the IA group (all P <0.05). There was no significant difference in the proliferation activity and Ki-67 and CyclinD1 expression of the IA group, mimic NC group, and si-NC group (all P> 0.05). In relation to the si-NC group and the mimic NC group, the proliferation activity and Ki-67 and CyclinD1 expression were heightened in the si-PSAT1 group and the miR-133a-3p mimic group (all P <0.05). In comparison to the miR-133a-3p mimic group, the proliferation activity and Ki-67 and CyclinD1 expression were reduced in the miR-133a-3p mimic + oe-PSAT1 group (all P <0.05) (Fig. 4f, i).
The migration of ECs in each group after treatment with miR-133a-3p mimic or si-PSAT1 for 24 h was observed by scratch test. It was revealed that the migration of cells in the IA group was inhibited relative to that in the control group (P <0.05). There was no markedly change in cell migration of the IA group, the si-NC group, and the mimic NC group (all P> 0.05). Compared to the si-NC group and the mimic NC group, the cell migration in the si-PSAT1 group and the miR-133a-3p mimic group was elevated (both P <0.05). Versus the miR-133a-3p mimic group, the cell migration was declined in the miR-133a-3p mimic + oe-PSAT1 group (P <0.05) (Fig. 4j, k).
Restored miR-133a-3p and Depleted PSAT1 Reduce PSAT1, GSK3β, and β-Catenin Expression in ECs of IA
RT-qPCR was used to detect miR-133a-3p expression in ECs of IA; it was yielded that compared to the control group, miR-133a-3p expression in the IA group was reduced (P <0.05). miR-133a-3p expression in the IA group, mimic NC group, and si-NC group did not change markedly (P> 0.05). MiR-133a-3p expression in the miR-133a-3p mimic group was enhanced relative to that in the mimic NC group (P <0.05). In contrast with the si-NC group, there was no distinct change in miR-133a-3p expression in the si-PSAT1 group (P> 0.05). Versus the miR-133a-3p mimic group, miR-133a-3p expression was showed no significant difference in the miR-133a-3p mimic + oe-PSAT1 group (P> 0.05) (Fig. 5a).
Upregulation of miR-133a-3p and downregulation of PSAT1 decrease PSAT1, GSK3β, and β-catenin expression in ECs of IA. 아 miR-133a-3p, PSAT1, GSK3β, and β-catenin expression in ECs detected by RT-qPCR. ㄴ Protein bands of PSAT1, GSK3β, and β-catenin. ㄷ PSAT1, GSK3β, and β-catenin protein expression in ECs in each group detected by western blot analysis. 아니 =3, *P <0.05 vs. the control group. #P <0.05 vs. the mimic NC group. &P <0.05 vs. the si-NC group. +P <0.05 vs. the miR-133a-3p mimic group. Measurement data were depicted as mean ± standard deviation, and data were assessed by one-way analysis of variance followed by Tukey’s post hoc test
The expression of PSAT1, GSK3β, and β-catenin in ECs of IA was tested by western blot analysis and RT-qPCR. It was indicated that in relation to the control group, PSAT1, GSK3β, and β-catenin expression in the IA group was raised (all P <0.05). PSAT1, GSK3β, and β-catenin expression in the IA group, mimic NC group, and si-NC group did not change dramatically (all P> 0.05). PSAT1, GSK3β, and β-catenin expression in the miR-133a-3p mimic group and si-PSAT1 group was degraded relative to that in the mimic NC group and si-NC group (all P <0.05). In relation to the miR-133a-3p mimics group, PSAT1, GSK3β, and β-catenin expression was elevated in the miR-133a-3p mimic + oe-PSAT1 group (all P <0.05) (Fig. 5a–c).
Upregulating miR-133a-3p and Downregulating PSAT1 Alleviate the Pathological Changes of IA Tissues
By testing the hemodynamic changes of rats after modeling, we monitored the blood flow velocity of rats in each group 3 days before operation and 12 weeks after intervention treatment. It was performed that there was no obvious difference in blood flow velocity in each group 3 days before operation (P> 0.05). After 12 weeks of intervention, the blood flow velocity of rats in the IA group depressed relative to that in the normal group (P <0.05). There was no distinct difference in the degree of decrease of blood flow velocity in the IA group, mimic NC group, si-NC group, and miR-133a-3p mimic + oe-PSAT1 group (all P> 0.05). By comparison with the si-NC group and the mimic NC group, the blood flow velocity was heightened in the miR-133a-3p mimic group and the si-PSAT1 group (both P <0.05). In contrast to the miR-133a-3p mimic group, the blood flow velocity was declined in the miR-133a-3p mimic + oe-PSAT1 group (P <0.05) (Fig. 6a).
Upregulated miR-133a-3p and downregulated PSAT1 alleviate the pathological changes of IA tissues. 아 Hemodynamic changes at each time point after successful modeling in rats. ㄴ Changes of IA tissue after transfection. n =12, *P <0.05 vs. the normal group. #P <0.05 vs. the mimic NC group. &P <0.05 vs. the si-NC group. +P <0.05 vs. the miR-133a-3p mimic group. Measurement data were depicted as mean ± standard deviation, and data were assessed by one-way analysis of variance followed by Tukey’s post hoc test.
The changes of IA tissues were verified by HE staining. The results displayed that in the normal group, the elastic fibers in the middle layer of intracranial vascular tissue were neat, the normal elastic protein wave-like structure was appeared, and there was no broken and degradation. In relation to the normal group, the lumen of intracranial vascular tissue was enlarged, the normal elastic protein wave-like structure was disappeared, the elastic fiber in the middle layer of local elastic protein vessel was broken, and some of the elastic fibers were completely degraded in the IA group. There was no distinct change in the morphology of IA tissues in the si-NC group, mimic NC group, IA group, and miR-133a-3p mimic + oe-PSAT1 group. In contrast with the si-NC group and the mimic NC group, the wave structure of elastic protein in intracranial vascular tissue of rats in the miR-133a-3p mimic group and the si-PSAT1 group was existed, and the local elastic protein vascular structure was slightly disordered, but there was no fracture and dissolution (Fig. 6b).
Highly Expressed miR-133a-3p and Lowly Expressed PSAT1 Reduce PSAT1, GSK3β, β-Catenin, VEGF, and MMP-9 Expression in IA Tissues in Vivo
The expression of miR-133a-3p in IA tissues in vivo was tested by RT-qPCR, it was suggested that in relation to the normal group, miR-133a-3p expression was declined in the IA group (P <0.05). miR-133a-3p expression in the IA group, mimic NC group, and si-NC group did not change obviously (all P> 0.05). MiR-133a-3p expression in the miR-133a-3p mimic group was elevated relative to that in the mimic NC group (P <0.05). By comparison with the si-NC group, there was no marked change in miR-133a-3p expression in the si-PSAT1 group (P> 0.05). Versus the miR-133a-3p mimic group, miR-133a-3p expression showed no significant difference in the miR-133a-3p mimic + oe-PSAT1 group (P> 0.05) (Fig. 7a).
Overexpression of miR-133a-3p and low expression of PSAT1 decrease PSAT1, GSK3β, and β-catenin, VEGF and MMP-9 expression in IA tissues in vivo and PSAT1 is a target gene of miR-133a-3p. 아 Detection of miR-133a-3p, PSAT1, GSK3β, and β-catenin expression in IA tissues of rats in each group by RT-qPCR. ㄴ Protein bands of PSAT1, GSK3β, and β-catenin. ㄷ Detection of PSAT1, GSK3β, and β-catenin protein expression in IA tissues of rats in each group by western blot analysis. d Protein bands of VEGF and MMP-9. 이 Detection of VEGF and MMP-9 protein expression in IA tissues of rats in each group by western blot analysis. 에 Prediction of the target site of PSAT1 binding to the corresponding miR-133a-3p by Target Scan. 지 Result of dual luciferase reporter gene assay. 아 –이 , n =12; 에 –지 , N =3, *P <0.05 vs. the normal group/the Wt + NC group. #P <0.05 vs. the mimic NC group. &P <0.05 vs. the si-NC group. +P <0.05 vs. the miR-133a-3p mimic group. Measurement data were depicted as mean ± standard deviation, and data were assessed by one-way analysis of variance followed by Tukey’s post hoc test
The expression of PSAT1, GSK3β, and β-catenin in IA tissues in vivo was tested by western blot analysis and RT-qPCR. It was appeared that in contrast with the normal group, PSAT1, GSK3β, and β-catenin expression in the IA group was increased (all P <0.05). PSAT1, GSK3β, and β-catenin expression in the IA group, mimic NC group, and si-NC group did not change markedly (all P> 0.05). PSAT1, GSK3β, and β-catenin expression in the miR-133a-3p mimic group and si-PSAT1 group was decreased compared with that in the mimic NC group and si-NC group (all P <0.05). Versus the miR-133a-3p mimic group, PSAT1, GSK3β, and β-catenin expression was enhanced in the miR-133a-3p mimic + oe-PSAT1 group (all P <0.05) (Fig. 7a–c).
Western blot analysis was used to verify the VEGF and MMP-9 expression in IA tissues in vivo; the results perceived that by comparison with the normal group, VEGF and MMP-9 expression in the IA group were enhanced (both P <0.05). VEGF and MMP-9 expression in the IA group, mimic NC group, and si-NC group did not change obviously (all P> 0.05). In relation to the mimic NC group and si-NC group, VEGF and MMP-9 expression in the miR-133a-3p mimic group and si-PSAT1 group were declined (all P <0.05). Versus the miR-133a-3p mimic group, VEGF and MMP-9 expression were elevated in the miR-133a-3p mimic + oe-PSAT1 group (all P <0.05) (Fig. 7d, e).
PSAT1 Is a Target Gene of miR-133a-3p
The online prediction software (https://cm.jefferson.edu/rna22/Precomputed/) was utilized to forecast and analyze the target site of PSAT1 binding to the miR-133a-3p, and the sequence of 3′UTR region combined by PSAT1 and miR-133a-3p. In order to prove that the predicted binding site of miR-133a-3p resulted in a change in the luciferase activity, the mutation sequence and the wild sequence of PSAT1 3′UTR deleting miR-133a-3p binding site were devised. Luciferase activity was verified by co-transfection of miR-133a-3p mimic and WT (Wt-miR-133a-3p/PSAT1) or MUT (Mut-miR-133a-3p/PSAT1) recombinant plasmids in vascular ECs. The results revealed that miR-133a-3p mimic had no distinct effect on luciferase activity in the Mut-miR-133a-3p/PSAT1 group (P> 0.05), while the luciferase activity in the Wt-miR-133a-3p/PSAT1 group was markedly declined (P <0.05) (Fig. 7f, g).
Discussion
IA is an abnormal dilatation of the intracranial artery, which weakens the arterial wall through continuously pushing outwards the vascular wall, which results in a higher risk of aneurysm rupture [17]. In a study conducted by Liu et al., it has shown that some miRNAs are involved in modulating the cell proliferation of vascular smooth muscle cells, which is closely associated with IA [18]. Also, a recent study has provided a proof that circulating miRNAs can be used as a new biomarker to assess the possibility of IA occurred in high-risk individuals [19]. It is customarily considered that PSAT1 may be involved in schizophrenia spectrum conditions and alters serine metabolism [20]. The current study was designed to explore the regulatory role of miR-133a-3p modulated vascular endothelial injury and triggered IA through modulating the PSAT1/GSK3β/β-catenin signaling pathway.
In this present study, the relationship among miR-133a-3p expression and clinicopathological features of IA was analyzed, and the results demonstrated that the expression of miR-133a-3p was not related to age, gender, shape, and position of aneurysm but associated with the number and size of aneurysm. Some scholars considered that the shear stress of regional blood flow in the arterial wall induced the induction of monocyte chemoattractant protein-1 (MCP-1) and macrophage inflammatory protein 1α (MIP-1α) expression by fibroblasts and vascular ECs within the vascular wall. The highly reactive chemotactic factors MCP-1 and MIP-1α made an aggregation of macrophagocyte in the vascular wall and mediated inflammatory response, then, induced the excitation of nuclear transcription factor c-Jun and then regulated the activation of activated protein 1 (AP-1), then activated MMP-9 promoter in its structural domain to raise MMP-9 mRNA expression, and finally induced the dissolution of extracellular matrix of vascular wall, causing the formation of intracranial aneurysm [21,22,23]. Saito et al. [24] found that MMP-9 positive cells were mainly from the middle and the outer membranes of the artery macrophages, which certified that MMP-9 expressed by macrophages mediated the degeneration of the arterial wall, leading to the formation of arterial aneurysm. The above studies have indicated that MMP-9 was linked to the formation of IA. The results of our study revealed that MMP-9 was upregulated in IA; thus, we speculated that mR-133a-3p might be involved in the occurrence and development of IA by regulating the PSAT1/GSK3β/β-catenin pathway and further regulating MMP-9. In our study, we found that restoring miR-133a-3p reduced the expression of PSAT1, GSK3β, β-catenin, and MMP-9 in intracranial aneurysm tissues. We will carry out relevant research in the future study to verify our findings.
Our study has provided substantial evidence in relation to the notion that miR-133a-3p expression was decreased and the PSAT1, GSK3β, and β-catenin was elevated in IA. Emerging evidence has suggested that miR-133a-3p plays a suppressive role in different kinds of tumors. Recent study has presented that miR-133a-3p expression was dramatically degraded in breast cancer tissues in contrast with that in non-cancer tissues [25]. Another study has purported that miR-133a-3p expression is declined in advanced prostate cancer (PCa) tissues relative to that in the adjacent normal tissues or benign prostate lesion tissues, especially in bone metastatic PCa tissues [26]. The promoting effect of PSAT1 in other types of diseases are found in some literatures. It is reported that PSAT1 expression was remarkably heightened in non-small cell lung cancer (NSCLC) and forecasted poor clinical outcome of NSCLC patients [27]. Furthermore, PSAT1 is considered as the highest upregulated gene in CRC tumors as well as highly expressed in chemoresistant disease patients [28]. It has been manifested that GSK3β activity was elevated in cancerous tissues [29]. Moreover, the phosphorylation level of GSK3β as well as the expression of nuclear β-catenin are also enhanced, suggesting that GSK3β/β-catenin pathway may be participated in osteopontin regulation [30].
Other results emerged from our data suggested that upregulation of miR-133a-3p and downregulation of PSAT1 suppressed apoptosis and advanced proliferation and migration of IA ECs, reduced VEGF, and MMP-9 expression in IA tissues. It has been suggested previously that the over-expression of miR-133a-3p retrains the invasion, growth, and mitosis of oral squamous cell carcinoma cells by targeting collagen type I alpha 1 (COL1A1) [31]. It is reported that highly expressed miR-133a-3p can repress the propagation of ESCC cells, advance cell apoptosis, and decline the migration and invasion of ESCC cells by targeting COL1A1 [32]. Another study has verified that transient upregulation of miR-133a-3p suppresses the migration, invasion, and growth abilities of gallbladder carcinoma cells through directly targeting recombination signal-binding protein Jκ [33]. In like manner, this study suggests that miR-133a-3p exerts its role in IA through targeting PSAT1. It is displayed that PSAT1 overexpression boosts ESCC cell growth and matrigel invasion in vitro, and injection of mice with ESCC cells with high expression of PSAT1 induces tumor formation in vivo [14]. Other study also has reported that PSAT1 is highly expressed and forecasts a poor clinical outcome of patients, as well as enhances cell tumorigenesis and proliferation in vivo and in vitro [13]. Prior research generally confirms that PSAT1 advances cell cycle progression, proliferation, and tumorigenesis through loss- and gain-of-function experiments [27]. It has been indicated that MMPs are composed of a series of enzymes which cleaves protein substrates on the basis of a conserved mechanism referring activation of an active site-bound water molecule through a Zn
2+
ion [34]. MMP-9 is a distinct protease which push forward an immense influence on many biological processes [35]. A study has contended that MMP-9 is elevated in the aneurysm groups compared to the control group [36]. Vascular endothelial growth factor-A (VEGF-A) is recognized as the key modulator of endovascular differentiation of trophoblast [37]. A study has revealed that silenced PSAT1 expression suppresses VEGF, β-catenin, and GSK3β phosphorylation expression [10].
Conclusion
To briefly conclude, our study confirms our hypothesis that overexpression of miR-133a-3p or downregulation of PSAT1 restrain endothelial cell damage and advance endothelial cell proliferation via inhibiting the GSK3β/β-catenin pathway in IA. These findings provide a new insight in a novel target therapy for IA. These findings underscore the role of miR-133a-3p in IA in relation the PSAT1/GSK3β/β-catenin pathway. However, a conclusion about the effects of miR-133a-3p and PSAT1 cannot be made clearly due to limited known researches on this. It needs to be monitored rigorously and reported appropriately in the future clinical trials.