Au@Ag Core@Shell 나노입자 합성, 항균제로 Rumex hymenosepalus 사용
초록
이 작업에서 우리는 core@shell 구조(Au@AgNPs)를 갖는 금-은 바이메탈 나노입자에 대한 순차적 합성 방법을 사용했습니다. Rumex hymenosepalus 카테킨과 스틸벤의 함량이 높은 뿌리 추출물(Rh)은 나노 입자 합성의 환원제로 사용되었습니다. 투과 전자 현미경(TEM)으로 얻은 크기 분포는 Au@AgNPs의 경우 36 ± 11nm, 금 나노입자(AuNPs)의 경우 24 ± 4nm, 은 나노입자(AgNPs)의 경우 13 ± 3nm의 평균 직경을 제공합니다. NP의 기하학적 모양은 주로 준구형이었습니다. AuNP 위의 은 껍질 두께는 약 6nm이며 표면의 활성 생체 분자로 덮여 있습니다. 나노입자 특성화에는 주사 투과 전자 현미경(STEM), 에너지 분산 X선 분광법(EDS), X선 회절(XRD), UV-가시광선 분광법, 제타 전위로 기록된 고각 환상 암시야 이미지(HAADF), 및 동적 광 산란(DLS). 푸리에 변환 적외선 분광기(FTIR) 및 X선 광전자 분광기(XPS)는 나노입자가 추출 분자에 의해 안정화됨을 보여줍니다. 나노 물질에 노출된 미생물에 대한 Gompertz 모델을 사용하여 성장 동역학 연구를 수행했습니다. 결과는 AgNPs와 Au@AgNPs가 Escherichia coli의 지연기와 성장률에 영향을 미친다는 것을 나타냅니다. 및 칸디다 알비칸스 Au@AgNPs에 대한 더 나은 반응과 함께 용량 의존적 방식으로
소개
지난 25년 동안 나노물질 합성을 위한 몇 가지 화학적 방법이 연구되었습니다. 그러나 이러한 방법의 대부분은 환경에 좋지 않은 물질을 사용하고 고온이나 고가의 장비를 사용합니다. 이 연구에서 우리는 녹색 합성 방법을 사용하여 금-은 나노 구조의 합성을 수행했습니다. 이 방법은 처음부터 오염을 최소화합니다. "깨끗한" 공정을 사용하여 건강이나 환경에 위협이 되지 않는 "깨끗한" 나노물질을 개발할 때 대부분의 폐기물과 유해 오염 물질의 사용을 피합니다.
금속 나노입자의 녹색 합성은 생물학적 시스템과의 상호작용의 긍정적인 영향을 추구하며, 이는 나노입자 및 폴리페놀 분자와의 자가 기능화가 세포 및 거대분자와 같은 시스템과 호환되는 생물학적 상호작용을 생성한다는 것을 의미합니다. 일반적으로 이러한 생물학적 상호작용은 암, 당뇨병, 신경퇴행성 질환과 같은 질병에 대한 나노의약으로 사용됩니다. 은(쉘)과 AuNps를 코어-쉘 시스템으로 합성하는 것은 광학 진단 센서, 분자 센서[1, 2], 광열 요법, 항균제와 같은 응용 분야를 가지고 있으며 촉매 과정을 개선[3,4,5,6]에 비해 단금속 NP로.
특히, 바이메탈 합성에는 서로 다른 반응기에서 순차적 또는 동시적 방법[7], 즉 초음파 분무 열분해[8], 음파화학법[5], 미세유체 칩[9], 순차 나노유체 나노침전[7]이 사용된다. 10, 11] 마이크로에멀젼[12], 리포솜[13], 환원제는 화학적 또는 녹색 화학 유형입니다.
건조 물질은 금속 산화물[14], 탄소 나노튜브[15, 16], 기타 인쇄된 연성 전자 장치[17]로 나노 입자 합성에 사용됩니다. 생물학적 시스템에 사용되는 습식 나노입자[18,19,20] 약물 운반체[21, 22], 항균제[23, 24], 감지 응용 분야[25] 및 전산 나노기술은 용도를 정의하는 데 사용되는 현대적인 분류[26]입니다.
Khatami et al., 특히 core@shell-type 나노입자의 식물을 이용한 녹색 합성을 검토한 Antigonon leptopus , 디오피로스 카키 , Azadirachta indica , 포타모게톤 펙티나투스 , 아나카디움 오세덴탈레 5~500nm 크기의 Au@Ag 나노입자 합성을 위해(a) 다양한 응용 분야(비항균성) 및 아스파라거스 라세모수스에 대해 테스트되었습니다. 뿌리 추출물은 Escherichia coli에서 테스트된 480 µg/mL에서 MIC를 찾는 Au–Ag 합금 나노입자 합성에 사용되었습니다. , 고초균 , 클렙시엘라 폐렴 , 녹농균 , 및 황색 포도상구균 [27]. 화학적 합성으로 얻은 Au@Ag 나노입자는 항균성으로 응용되며 보고된 MIC는 은 함량(껍질)에 대해 약 2.5μg/mL입니다[28], Lu et. 알. 보고된 Au/AgNPs@Van의 화학적 합성은 NaBH4를 사용하여 준비되었습니다. 또한 반코마이신과 MIC는 그람 양성 및 음성 박테리아에서 테스트된 바이메탈 나노입자에 대해 60 nmol/mL였습니다[29].
바이메탈 나노물질[30,31,32,33,34]의 항균 특성은 Ag 농도의 함수로 향상됩니다. 대조적으로, Au 농도의 증가는 항균 특성을 감소시키지만 세포 독성 효과를 감소시킵니다. Au 및 Ag 단일 금속 재료와 바이메탈 재료의 효과를 비교[36,37,38,39,40], 시너지 효과[41]가 바이메탈 재료 간에 발생하여 이중 기능 효과[28, 42]를 생성하는 것으로 입증되었습니다.
나노물질 기능화는 시스템을 둘러싼 화학적 환경[43,44,45](pH, 황의 존재, 생체적합성 분자 등)이 세포 또는 미생물과의 상호작용에 영향을 미치기 때문에 특히 관심이 있습니다. 따라서 녹색 화학을 사용하여 생체 물질 생성에 중점을 둡니다[46,47,48,49,50,51,52,53,54,55].
바이메탈 입자의 화학적 조성[56,57,58]은 모노메탈 나노구조[60]의 시너지 효과로 인해 광학 특성[41, 59]의 결정 요인이 될 것입니다.
본 연구에서는 Rumex hymenosepalus를 환원제로 사용하여 금과 은 나노입자를 합성하였다. 금속 이온을 줄이는 데 강력한 항산화제 역할을 하는 스틸벤과 카테킨 분자를 함유한 식물입니다. 금 나노 입자를 핵으로 사용하여 순차적 합성 방법을 통해 Au@Ag의 바이메탈 나노 입자 core@shell 유형을 얻었다. 나노물질의 특성화에는 HAADF-STEM, EDS y HRTEM이 있는 TEM 기술이 포함됩니다.
다양한 유형의 합성 나노입자를 사용하여 박테리아 E의 성장 역학에 대한 비교 연구가 수행되었습니다. 대장균 및 S. 구균 효모 Candida albicans.
실험 섹션
자료
Rumex hymenosepalus의 뿌리 지역 상업 시설에서 인수했습니다. 두 전구체 HAuCl4 및 AgNO3 나노 입자 합성을 위해 순도 99%의 Sigma-Aldrich에서 구입했습니다. 미생물 분석에 사용되는 Brain Heart Infusion(BHI) Broth 및 Potato Dextrose Broth(PDB)는 Sigma-Aldrich에서 조달했습니다. 나노입자 세정 공정에 사용되는 에탄올(순도 99%)은 페르몬트에서 구입하였으며, 실험에는 초순수(milli-Q)를 사용하였습니다.
Rumex hymenosepalus 추출물
추출물 준비를 위해 150g의 슬라이스로 자르고 이전에 탈수한 뿌리를 1000mL의 70/30V/V 에탄올/물 혼합물에 담그었습니다. 침용은 밀폐 마개가 있는 유리 용기에서 실온에서 수행하고 빛을 차단하였다. 얻은 용액의 흡광도를 값에 변화가 없을 때까지 21일 동안 모니터링했습니다. 이 때 침용 과정은 완료된 것으로 간주되었습니다. 얻은 추출물을 구멍 크기가 8μm 및 2μm인 Whatman 종이 필터로 연속적으로 여과하고 마지막으로 0.22μm 아크로디스크 필터로 여과했습니다. 에탄올을 회전 증발기로 제거하고 수성 추출물 농축액을 동결건조를 위해 -80°C에서 동결했습니다(Labconco, FreeZone 1L). 얻은 분말은 사용할 때까지 실온에서 빛으로부터 보호되는 멸균 용기에 보관했습니다.
AuNP 합성
첫째, Rumex hymenosepalus 동결건조 추출물로부터 10mg/mL의 수용액을 제조했습니다. 나중에 Rumex 16mL 용액을 1000rpm으로 교반하면서 32mL의 초순수와 혼합하고 16mL의 HAuCl4을 천천히 첨가했습니다. (0.01 M). 반응은 실험실 조명 조건 및 실온에서 1시간 동안 유지되었습니다. 표면 플라즈몬 공명의 강도(λSPR =540 nm)는 시간 경과에 따른 UV-Vis 분광법으로 평가되었습니다. 변화가 관찰되지 않으면 합성이 완료된 것으로 간주되었습니다. 얻어진 생성물을 12,000rpm으로 원심분리하고, 상등액을 초순수로 교체하고, 1시간 동안 초음파 처리하여 나노입자를 재분산시켰다. 절차를 세 번 더 반복했습니다. 처음 두 경우에는 물을 용매로 사용하고 마지막에는 에탄올을 사용했습니다. 마지막으로 에탄올 분산액을 원심분리하고 침전물을 40°C의 대류 오븐에서 건조시켜 2300 µg/mL의 AuNPs 수분산액을 제조했습니다.
Au@AgNPs의 합성
Au@AgNPs 합성의 경우 AuNPs 수분산액 2mL(2300μg/mL), AgNO3 0.8mL (0.1M) 및 0.8mL의 Rumex hymenosepalus 용액(10mg/mL)을 멸균 유리 배양 튜브에 담았습니다. 혼합물을 초음파 세척기(Branson, Model 2510)에서 3시간 동안 초음파 처리했습니다. 그 후 내용물을 12,000rpm에서 1시간 동안 원심분리하고 얻은 고체를 초음파 처리하여 초순수에 재분산하여 1000μg/mL 농도를 얻었다.
AgNP 합성
AgNPs를 생성하기 위해 16mL의 추출물 용액(10mg/mL)을 64mL의 초순수 및 8mL의 AgNO3와 혼합했습니다. 0.1 M. 반응은 실험실 조명 조건 25°C 및 표면 플라즈몬 공명(\(\lambda_{{{\text{SPR}}}}}^{{{\text{Ag}} }}\) =440 nm)는 시간 경과에 따른 UV-Vis 분광법으로 모니터링하여 형성을 평가했습니다. 생성물을 12,000rpm에서 원심분리하고, 상청액을 초순수로 교체하고, 1시간 동안 초음파 처리를 적용하였다. 절차를 세 번 더 반복했습니다. 처음 두 경우에는 물을 용매로 사용하고 마지막에는 에탄올을 사용했습니다. 에탄올 분산액을 원심분리하고 침전물을 40°C의 대류 오븐에서 건조했습니다. 마지막으로, 얻어진 AgNPs 먼지는 초음파 처리에 의해 초순수에 재분산되어 2000 µg/mL 농도에서 콜로이드 분산을 생성했습니다.
특성
UV-Vis 흡수 스펙트럼은 이중 빔 PerkinElmer Lambda 45 분광계에서 얻었습니다. 0.5nm의 슬라이트가 사용되었으며 스펙트럼은 200~900nm 범위에서 480nm/min의 속도로 기록되었습니다. 나노 입자의 경우 샘플 50µL와 추출물 5µL만 사용했습니다. 최종 부피는 초순수를 용매로 사용하여 석영 셀에서 최대 3mL로 만들었습니다.
제타 전위(ζ AuNPs, AgNPs 및 Au@AgNPs의 )은 Zetasizer-Nano ZS(Malvern Instruments, UK)를 사용하여 측정되었습니다. 각 샘플은 실온(25°C)에서 각 샘플에 대해 1, 10, 50, 100µg/mL 농도의 함수로 3회 측정되었습니다.
AuNP, AgNP 및 Au@AgNP에 대한 DLS는 633nm He-Ne 레이저가 장착된 Zetasizer-Nano ZS(Malvern Instruments, UK)를 사용하여 측정되었습니다. 각 샘플은 실온(25°C)에서 각 샘플에 대해 1, 10, 50, 100µg/mL 농도의 함수로 3회 측정되었습니다. 다분산 지수(PDI)는 \({\text{PDI}} =\left( {\frac{\sigma }{{\overline{D}}}} \right)^ 정의를 통해 Malvern 소프트웨어를 사용한 DLS 실험에서 결정되었습니다. {2}\), 여기서 D 는 평균 지름이고 \(\sigma\)는 \(D\)의 표준 편차입니다. 0.10 이하의 PDI 값은 고도의 단분산으로 간주됩니다[62].
광학 밴드 갭 Eg Tauc 방정식을 사용하여 AgNPs, AuNPs, Ag@AuNPs에 대해 계산되었으며 다음 관계에 따라 재료의 밴드갭을 결정합니다.
여기서 \(\alpha\)는 재료의 흡수 계수입니다. (\(\alpha\) =2.303 A /d 여기서 A는 흡광도이고 d는 셀의 너비입니다. 여기서 Eg 는 광 에너지 밴드 갭이며 hʋ (αhʋ) 사이에 선을 그려서 얻은 광자 에너지입니다. )n
광자 에너지 hʋ . 색인 번호 n은 샘플에서 허용되는 직접 대역 간 전환에 대해 2로 간주되며 [63] 선형 적합 플롯으로 쉽게 평가할 수 있습니다[64]. 값이 1/2, 2, 3/2 및 3일 수 있는 전환 유형에 따라 각각 허용된 직접, 허용된 간접, 금지된 직접 및 금지된 간접 전환에 해당합니다[65].
샘플 AgNPs, AuNPs, Ag@AuNPs 및 Rh는 FTIR(PerkinElmer, Inc., Waltham, Spectrum Two)을 사용하여 적외선 흡수를 통해 분석되었습니다. 획득 매개변수:4 cm
−1
해상도, 16개 스캔, 4000~900cm
−1
파장 범위.
X선 광전자 분광법 분석은 Mg/Al, 300W, 15kV의 이중 소스를 포함하는 PerkinElmer 모델 PHI 5100에서 수행되었습니다. 1253.6 eV의 에너지를 갖는 Mg Kα 방출선은 AgNP, AuNP, Ag@AuNP 및 Rh에 사용되었습니다. 모든 실험은 2 × 10
–9
의 진공 조건에서 수행되었습니다. 토르. [66]. Multipak 소프트웨어를 사용하여 데이터를 분석했습니다. XPS 특성화를 위해 다양한 나노입자 분산 및 Rumex hymenosepalus 추출물 용액은 다음과 같이 깨끗한 커버슬립에 증착되었습니다. 30µL의 샘플을 커버슬립에 추가하여 다음 침전물을 위해 완전히 건조되도록 했습니다. 이 과정은 박막이 형성될 때까지 최소 5회 반복한 후 XPS로 특성화되었습니다.
고각 환형 암시야 주사 투과 전자 현미경(HAADF-STEM)은 나노 물질의 구조를 설명하는 많은 양의 보완 정보를 제공하는 전자 현미경의 강력한 작동 모드로 간주될 수 있습니다. Aberration-corrected HAADF-STEM은 다른 화학적 성질을 가진 원자의 위치를 원자 분해능으로 결정할 수 있습니다. 이는 화학적 감도와 높은 공간 분해능으로 알려진 수차 보정된 HAADF-STEM 때문입니다[67]. 이 작동 모드에서 간섭 이미지는 회절 대비의 기여도가 무시할 정도로 지배적입니다[68]. 따라서 HAADF-STEM 수차 보정의 원자 번호 대비(Z 대비)를 통해 나노구조의 구조적 세부 사항을 매우 정확하게 결정할 수 있습니다.
STEM 분석을 위해 샘플은 200kV에서 작동하는 JEOL-JEMARM200 전자 현미경과 집광 렌즈용 CEOS 교정기로 분석되었습니다. Z-Contrast STEM 이미지는 BF 및 HAADF 모드에서 동시에 기록되었습니다. 이미지는 40미크론 콘덴서 렌즈 조리개(32–36mrad 수렴각)와 9pA의 스폿 크기로 기록되었습니다.
전자 현미경 분석을 위해 Au@AgNPs 현탁액 한 방울(10μL)을 300메시 두께의 탄소 그리드에 증착하고 실온으로 건조시킨 다음 24시간 동안 진공 챔버에 둡니다.
200kV에서 Jeol 2010F 장치(1.9Å 분해능)에서 TEM으로 나노입자를 분석했습니다. EDS 분석은 XFlash 4010 검출기가 있는 QUANTAX 200-TEM X선 분광계(Bruker)를 사용하여 실현되었습니다. HRTEM 분석을 위해 TEM 현미경 사진을 100,000X 이상의 배율로 기록했습니다. 결정면의 면간 간격은 디지털 현미경 사진 분석(3.0 Gatan 버전)에 의해 결정되었습니다. 샘플 준비는 STEM 분석에 대해 위에서 설명한 것과 유사했습니다.
Multilayer mirrors monochromator와 Cu Kα Microfocus 밀봉된 튜브(λ =1.54178 Å). T에서 프레임을 수집했습니다. =300 K를 통해 ω /φ -인텐시티 대 2세타의 회절도를 얻기 위해 스캔한 다음 처리합니다. High Score Plus 소프트웨어는 원시 데이터 처리에 사용되었으며 소프트웨어와 관련된 ICSD 분말 회절 데이터베이스는 검색 일치 위상 식별 분석을 위해 구현되었습니다.
항균 활성 분석
테스트한 미생물은 박테리아 Escherichia coli였습니다. (ATCC 25922), 황색 포도상구균 (ATCC 5538P) 및 효모 Candida albicans 요로 감염이 있는 성인 남성 환자로부터 수집한 감염된 소변에서 분리(우리 연구는 헬싱키 선언의 원칙을 따릅니다). Brain Heart Infusion(BHI) 및 Potato Dextrose Broth(PDB)를 사용하여 박테리아 및 효모의 접종물을 각각 준비했습니다. 배양물을 37ºC에서 밤새 배양했습니다. 현탁액 밀리리터당 집락 형성 단위(CFU/mL)의 농도는 박테리아의 경우 540nm, 효모의 경우 600nm에서 UV-Vis로 광학 밀도를 측정하여 결정했습니다. 4 × 10
8
이 포함된 정지 , 7.8 × 10
8
및 2.5 × 10
6
CFU/mL는 E에 사용되었습니다. 대장균 , S. 구균 , 및 C. 알비칸 , 각각. 37ºC에서 나노입자와 미생물이 첨가된 액체 배양 배지를 사용하여 96웰 플레이트에서 항균 활성을 테스트했습니다. 모든 테스트는 삼중으로 수행되었습니다. 흡광도는 Gen 5 소프트웨어를 사용하여 다중 모드 플레이트 판독기 Synergy HTX Biotek에서 측정되었습니다. 모든 미생물 성장 곡선은 Origin Lab 8.0 소프트웨어를 사용하여 수행되었습니다. 첫 번째 단계로, 필요한 농도의 나노입자와 혼합된 70μL의 신선한 브로쓰 배지(연구된 미생물에 따라 BHI 또는 PDB)를 웰에 첨가했습니다. 이후에 30μL의 미생물 현탁액을 웰에 첨가하고 배지로 균질화시켰다. 각 웰의 최종 부피는 100 μL입니다. 접종물을 분배한 후, 위에서 설명한 분광광도계에서 96웰 플레이트를 판독했습니다. 플레이트를 24시간 동안 37°C에서 유지했으며, 각 판독 전에 각각 15분의 주기로 원형 진탕 모드를 사용했습니다. 미생물의 성장 속도는 언급된 파장에서 광학 밀도 측정(OD)에 의해 결정되었습니다.
곰퍼츠 모델에 의해 분석된 곡선 성장
Gompertz 성장 모델이 미생물 개체군의 성장을 잘 설명한다는 것은 문헌에서 잘 알려져 있습니다. 이 모델을 통해 미생물 개체군의 성장을 설명하는 데 있어 두 가지 중요한 매개변수인 적응기(지연기)와 개체군 성장률을 이해할 수 있습니다. 특히, 미생물 억제 처리에서 지연기의 거동을 연구하는 것은 처리에 대한 미생물의 적응 반응에 대한 정보를 제공하고 평가된 처리에 대한 미생물의 내성 발달에 대한 지표를 제공할 수 있기 때문에 적절합니다[69 ].
수정된 Gompertz 모델은 Zwietering et al. [70] Li et al. [69] 및 기타 저자 [71,72,73,74,75,76,77,78]는 성장 곡선을 조정하고
여기서 A OD540으로 표시되는 셀 번호입니다. (S. 아우레우스 및 E. 대장균 ) 및 OD600 (C. 알비칸스 ), μ 는 지수 단계의 성장률이며 e 지수 e입니다. 1
, \(\lambda\)는 지연 단계입니다. S에 대한 효과를 분석하기 위해 소프트웨어 오리진 9.1을 사용하여 성장 속도를 조정했습니다. 구균 , E. 대장균, 및 C. 알비칸 AuNPs, AgNPs 및 Au@AgNPs의 세 에이전트 중
나노입자가 에 미치는 영향 E. 대장균, , S. 구균 , 및 C. 알비칸 성장
대장균 및 황색포도상구균 BHI 배지 및 C에 접종하였다. 알비칸 PD 브로쓰에 접종하였다. 모든 배양물은 36°C에서 밤새 배양되었습니다. 배양 후 3개의 배양물을 각각 흡광도 1, 0.7 및 1로 조정했습니다(λ =540nm). AuNPs, AgNPs 및 Au@AgNPs는 50µg/mL의 농도로 조정되었습니다. 96 마이크로웰 플레이트에서 조정된 배양물은 7:3의 관계로 나노입자에 노출되어 각 마이크로웰의 최종 부피가 200μL에 도달했습니다. 또한, 조정된 배양물은 이전에 기재된 동일한 조건에서 대조군 조건으로서 멸균수에 노출되었다. 이 실험에 사용된 다른 대조군은 미생물이 없는 신선한 배지와 각 나노입자 용액이었습니다. 대장균, 황색 포도구균 , 및 칸디다 알비칸스 AuNPs, AgNPs 및 Au@AgNPs에 각각 노출되었습니다. Microwell plate를 36℃에서 배양하고 1, 7, 13 및 19시간에 처리 및 대조 조건의 각 미생물의 샘플을 얻었다. 수집된 샘플을 연속 1:10 식염수로 희석하고 Müeller-Hinton 플레이트 표면에 펼쳤습니다. 접종된 플레이트를 36°C에서 24시간 동안 인큐베이션했습니다. 배양 후 직접 계수를 사용하여 CFU/mL를 계산했습니다.
최소 살균 농도(MBC) 측정
황색포도상구균 , 대장균 , 및 칸디다 알비칸스 36°C에서 밤새 배양한 Müeller-Hinton 국물에 각각 접종하고 0.5 McFarland Nephelometer로 조정했습니다. 최소 억제 농도(MIC) 결정을 위해 접종물을 조정한 후, 미량 희석 테스트를 수행했습니다. 간단히 말해서, 96-웰 플레이트가 이 목적을 위해 사용되었습니다. 각 미생물의 조정된 배양액 160 μL를 5개의 웰에 부었다. 1000 µg/mL의 AuNP, AgNP 및 Au@AgNP의 용액을 준비했습니다. 이전 용액은 750, 500, 250 µg/mL 용액을 준비하는 데 사용되었습니다. 0 µg/mL의 나노입자로 순수 멸균수를 사용하고 160 µL의 조정된 배양액에 각각의 이전 용액 40 µL를 첨가했습니다. 이러한 방식으로, 각 배양물은 200, 150, 100, 50 및 0 μg/mL의 각 테스트된 나노입자의 최종 농도에 노출되었습니다. 마이크로플레이트를 36°C에서 24시간 동안 인큐베이션했습니다. 그 후, 각 웰의 샘플을 Müeller-Hinton 표면에 접종하고 이전에 설명한 것과 동일한 조건에서 배양했습니다. 인큐베이션 후 Müeller-Hinton 플레이트에서 성장 신호를 찾는 것이 관찰되었습니다. 성장 신호가 관찰되지 않은 농도를 MBC 값으로 기록했습니다.
결과 및 토론
특성화
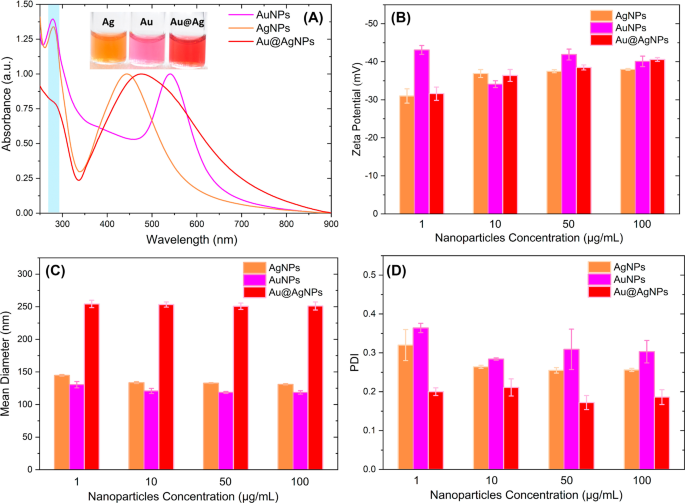
그림 1a는 합성된 나노물질의 UV-vis 흡수 스펙트럼을 보여줍니다. 흡광도는 각 나노 입자 시스템에 해당하는 최대 국소 표면 플라즈몬 공명(LSPR)에 대해 정규화되었습니다.
<사진>
나노입자 UV-Vis 스펙트럼(a ), Z-전위(b ), DLS(c ) 및 PDI(d ) Au, Ag 및 Au@AgNPs
그림 1a의 Au@AgNps 흡수 스펙트럼은 AgNPs LSPR(445nm)과 AuNPs LSPR(544nm) 사이에 위치한 474nm를 중심으로 단일 밴드를 가지고 있습니다. Au@AgNPs에 금과 같은 흡수 피크가 없다는 것은 순차적 합성에 의해 얻은 나노물질이 core@shell 구조임을 시사합니다. Au와 관련된 어떤 흡수 밴드도 핵에 속하는 것을 감지할 수 없습니다. 일부 저자는 core@shell 시스템의 경우 흡수 스펙트럼이 3~4nm의 쉘 두께에 대한 각 금속과 관련된 두 개의 밴드로 구성되어 있다고 가정합니다. 금속 코어와 관련된 흡수는 더 높은 두께에서 사라지고 최대 위치가 바이메탈 입자의 두께/코어 크기 비율에 따라 달라지는 단일 흡수 밴드를 얻습니다[79, 80].
Samal et al. [81] 핵 크기를 제어하고 다른 두께의 쉘을 추가하여 core@shell 나노입자(Au@Ag)를 합성했습니다. 특히 Au@AgNPs에 대한 UV-vis 결과는 Samal et al.에 의해 보고된 것과 일치합니다. 스펙트럼이 단일 흡수 밴드(~ 450nm)를 특징으로 하는 32nm 금 코어와 15nm 이상의 은 두께에 대해 Au 표면 플라즈몬의 억제가 관찰됩니다.
또한, 그림 1a에서 Rumex hymenosepalus의 분자에 해당하는 280nm 중심의 흡수(파란색으로 강조 표시된 영역)를 관찰할 수 있습니다. 나노 입자 합성에서 환원제로 사용되는 추출물. 추가 파일 1:그림 S1은 Rumex hymenosepalus에 해당합니다. 수용액 흡수 스펙트럼. 폴리페놀 화합물의 카르보닐 그룹과 결합된 방향족 고리의 전자 전이와 관련된 278nm 중심의 특성 밴드가 관찰됩니다[82]. 나노입자 UV-Vis 스펙트럼의 이러한 흡수 밴드는 최종 제품에 남아 있는 추출물 분자가 포함되어 있음을 나타냅니다(Rivero-Cruz et. 알. 는 R에서 분리된 4개의 stilbenoids, 2개의 flavan-3-ols 및 3개의 anthraquinone을 보고했습니다. 자궁경부 [83] 및 Rodríguez-León et. 알. Rumex hymenosepalus 스틸벤 배당체와 에피카테킨 갈레이트 및 에피갈로카테킨 갈레이트와 같은 중요한 분자를 포함합니다[61]. 이 분자는 나노 입자 합성에서 환원제로 참여합니다. 이 과정은 페놀 고리의 일부 -OH 기의 탈양성자화를 포함하여 =CO 기를 형성합니다. 폴리페놀 분자가 산화되고 방출된 전자가 Ag
+
로 이동합니다. 및 Ag
3+
Au
0
을 형성하는 이온 및 Ag
0
.
그림 1b는 1, 10, 50, 100µg/mL 농도에서 AuNP, AgNP 및 Au@AgNP에 해당하는 제타 전위 값을 보여줍니다. 나노입자를 초순수에 분산시키고, 25℃에서 3회 반복하여 측정하였다. 일반적으로 농도 범위 전체에서 나노입자는 -30mV보다 음의 제타 전위 값을 나타내며 AuNP 및 Au@AgNP의 경우 100µg/mL 농도 및 AgNP의 경우 -38mV 농도에서 -40mV 값에 도달합니다. 이러한 매우 음의 제타 전위 값은 나노 입자가 응집을 방지하고 금속 콜로이드의 장기간 안정성을 허용하는 반발 상호 작용을 경험함을 나타냅니다[84,85,86]. UV-Vis 분광법 결과를 얻은 제타 전위 값과 상호 연관시킴으로써 우리는 매우 음의 값이 추출물의 폴리페놀 분자가 나노 입자 표면에 착화되어 있기 때문일 수 있음을 확립할 수 있습니다[87].
생물학적 응용의 경우 단분산 크기의 나노입자 집단을 얻는 것이 중요하므로 [88] 그림 1c와 d는 AuNP, AgNP 및 Au@AgNP의 평균 직경 및 다분산 지수(PDI)에 해당하는 DLS 값 1, 10, 50, 100µg/mL Au@AgNPs의 평균 직경은 약 250nm이며 농도의 함수로 일정하게 유지되며, AuNPs 및 AgNPs의 평균 직경이 각각 약 122 및 135nm인 단금속 나노입자의 경우와 유사한 방식입니다. 같은 경우에 PDI 값은 단금속 나노입자의 경우 약 0.3이고 Au@AgNP의 경우 0.2입니다. 농도에 따라 크기가 달라지지 않는 이러한 결과는 다양한 나노입자 시스템이 크기의 중간 정도의 다분산성을 나타내는 양호한 안정성을 가지고 있음을 나타냅니다(0.3 ≥ PDI ≥ 0.2).
Tauc 플롯의 광학 밴드 갭이 계산되었습니다(추가 파일 1:그림 S2). 반도체 재료에 의한 전도대는 E 값을 가집니다. g <3 eV, 기준 게르마늄은 Eg <0.7 eV 및 실리콘은 E입니다. g =1.1eV[89]. 우리의 경우 Au@AgNPs, AuNPs 및 AgNPs의 밴드 갭은 각각 1.93eV, 2.03eV, 2.33eV입니다. 이는 이러한 물질이 반도체와 같은 것으로 간주된다는 것을 의미하며, 이러한 특성은 에너지 갭을 증가시키는 양자 구속 효과에 대해 얻어졌기 때문에 나노 물질은 센서, 배터리 및 광전자 소자로 사용될 수 있습니다[64].
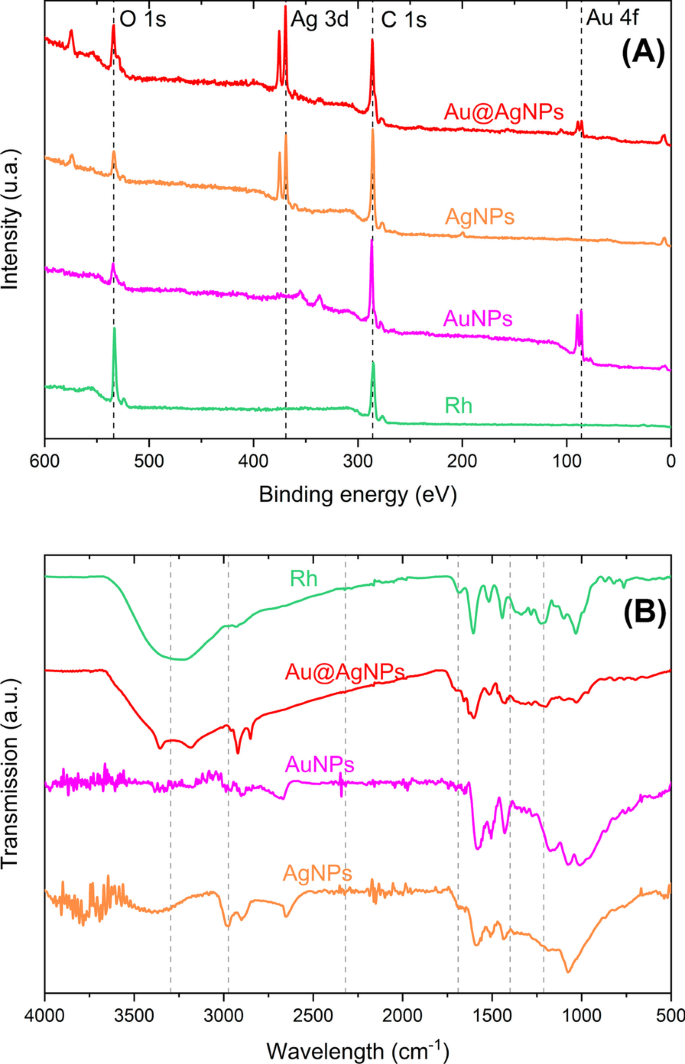
유기 화합물이 나노 입자에 존재하는지 확인하기 위해 이러한 나노 물질은 XPS 및 FTIR로 특성화되었습니다. 그림 2a는 식물 추출물과 나노 입자의 조사 스펙트럼을 보여줍니다. 알 수 있는 바와 같이, 모든 나노입자 시스템은 Rumex hymenosepalus의 탄소(C 1 s, 284.6 eV) 및 산소(O 1 s, 532.2 eV) 요소와 관련된 특성 신호를 나타냅니다. 발췌. 이 결과는 추출물에서 추출한 유기 분자가 얻은 나노 물질에 존재함을 확인시켜줍니다. 또한 고해상도 XPS 스펙트럼을 획득하여 나노 입자에서 은과 금의 산화 상태를 분석했습니다(추가 파일 1:그림 S3). AgNP(추가 파일 1:그림 S3A)의 경우 3d3/2 및 3d5/2 스펙트럼 라인에 해당하는 373.76eV 및 367.76eV(∆BE =6.0eV)의 결합 에너지에서의 신호는 Ag
0과 연관될 수 있습니다.
(메탈릭 실버). AuNP(추가 파일 1:그림 S3B)의 경우 4f5/2 스핀-궤도 커플링과 관련된 피크는 결합 에너지 87.65eV에 있습니다. 4f7/2의 경우 스핀-궤도 커플링 피크는 83.98eV에 있습니다. 강도(I4f7/2> I4f5/2)의 비율, 위치 및 피크 간 분리(ΔBE =3.67 eV)는 금 이온(Au
3+
) 금속성 금 Au
0
으로 완전히 감소됩니다. [90]. Au@AgNPs의 경우 은과 금에 해당하는 고해상도 XPS 스펙트럼이 각각 추가 파일 1:그림 S3C 및 그림 S3-D에 나와 있습니다. 이 스펙트럼은 단금속 대응물과 동일한 동작을 보여줍니다. 이는 core@shell 프레젠테이션에서 은과 금이 모두 0가임을 나타냅니다.
<그림>
XPS 조사 스펙트럼(a ) 및 FTIR(b ) Rh, Ag, Au 및 Au@AgNP의 경우
그림 2e의 FTIR은 3296cm
−1
에서 보여줍니다. 수산기, 2974cm
−1
(C–H) 방향족 고리의 결합, 1689cm
−1
카르보닐기 스트레칭(C=O) 및 1689–1400cm
−1
와 관련됨 카르복실레이트 결합(C-O) 및 탄소-탄소 결합 스트레칭 및 1212cm
−1
로 인해 1049cm
−1
AuNP와 결합된 페놀 CO 스트레칭과 관련됨 카테킨 에스테르 그룹 분자의 CO 스트레치 모드 [88,89,90] 및 799cm
−1
페놀의 평면 바깥쪽 굽힘, 964.4 및 829.39cm에서 보고된 C–H 굽힘
−1
레스베라트롤[91]의 특징이 Rh 추출물에서 1031 및 867 cm로 이동됨
−1
, 각각 및 AuNPs, AgNPs 및 Au@AgNPs도 이동되어 Rh 추출물의 폴리페놀 분자와 나노 입자의 복합체를 나타냅니다.
Figure 3a corresponds to a representative bright-field STEM micrograph of the Au@AgNPs system at low magnification (100 nm scale bar). A set of nanoparticles without agglomeration and with mostly quasi-spherical geometry can be seen. The same region is shown in dark field (HAADF) in Fig. 3b, and the core@shell structure can be observed, where can we distinguish Au-core looks more intense than Ag-shell, due to the difference in atomic number. Figure 3c and d corresponds to STEM higher magnification micrograph (scale bare 20 nm) of a nanoparticles group of system core@shell in a bright and dark field, respectively. Can be appreciated with clarity brilliant Au core and Ag shell lightly contrasted. These images show that the thickness of the Ag-shell varies between 3 and 5 nm. Additional file 1:Figure S4 corresponds to an individual images gallery where can be observed uniformity of Ag-shell.
Scanning Transmission Electron Microscopy at low magnification (scale bar 100 nm) of Au@AgNPs in Bright Field (a ) and HAADF (b ). A Small group of Au@AgNPs at higher magnification (scale bar 20 nm) in Bright Field (c ) and HAADF (d )
Figure 4a, c, and e corresponds to micrograph TEM of representative nanoparticles systems AuNPs, AgNPs, and Au@AgNPs, respectively. In all cases, nanoparticles have sphere-like morphology and are shown well separated from each other. This can be explained by the extract molecules onto nanoparticle surfaces, acting as spacers between them. Figure 4b, d, and f shows histograms corresponding to size distribution obtained by TEM and performed with 500 nanoparticles collected from 15 to 20 micrographs for each nanomaterial. The histogram presents Gaussian distribution with a mean size of 24 ± 4 nm (AuNPs), 13 ± 3 nm (AgNPs), and 36 ± 11 nm (Au@AgNPs). The discrepancy in values between DLS and TEM measurements with size distribution graph is due to conditions micro-environmental around the nanoparticles, while DLS shows a diameter for a system that includes metal, hydrated coating, and solvent by comparison in TEM measurements is a dry system where measurement is over metal only, in particular, in DLS the molecules used for complexation of nanoparticles (reducing agents and stabilizers) are dispersants that induce errors in sizing measurement and shifts it results to higher values [91].
TEM and size distribution of AuNPs in (a ) 및 (b ), AgNPs in (c ) 및 (d ), and Au@AgNPs in (e ) 및 (f )
Figure 5 corresponds to the Au@AgNPs HAADF-STEM micrographics. A single nanoparticle is shown in Fig. 5a with a gold nucleus and silver cover perfectly delimited, the atomic number (Z) changes through the interface Au@Ag, intensity variations can be quantified by HAADF-STEM [67].
Au@AgNPs HRTEM (a ). Magnification from (a ) of interface core–shell (b ). FFT plot with Miller index (c ) and integrated image from FFT (Inverse) with interplanar distance (d )
The red square region is amplified to obtain an HRTEM micrography of the shell portion (Fig. 5b), and then to verify the crystalline shell structure, the nanoparticle periphery region was analyzed (discontinued square) with the Digital Micrograph 3.0 software (Gatan). Fast Fourier Transform (FFT) image of the selected area was obtained (Fig. 5c). Using the Inverse Fast Fourier Transform was possible to estimate interplanar distances of 2.3 Å, 2.0 Å, and 1.4 Å in Fig. 5d. These distances can be assigned, respectively, to the crystalline planes (111), (200), and (220) of face-centered cubic (fcc) silver according to Inorganic Crystal Structure Database (ICSD) at the FIZ Karlsruhe–Leibniz Institute for Information Infrastructure, Germany or the electron crystallography software Jems (V 4-5430, JEMS-SAAS, Switzerland) [92]. A similar analysis of crystal structure by HRTEM was carried out for monometallic nanoparticles as illustrated in Additional file 1:Figures S5 (for AuNPs) and S6 (AgNPs). In both cases, crystal structure corresponds to face-centered cubic (fcc).
EDS chemical analysis shows the presence of both metals for a group of bimetallic Au@AgNPs observed by TEM (Fig. 6a) in proportions of the atomic weight percent 77% of Ag (shell) and 23% of Au (cores) (Fig. 6b). In comparison, a single bimetallic (Fig. 6c) Au@AgNPs has proportions around 80% of Ag (shell) and 20% of Au (core) (Fig. 6d). To estimate the gold and silver atomic percentage on core@shell nanoparticles (Au@Ag), a quasi-spherical geometry approximation of nanoparticles morphology was considered. The AuNPs average diameter obtained from TEM size distribution (\(\overline{D}_{{{\text{Au}}}} =24\;{\text{nm}}\)) was used for core volume estimation (V금 ), and Au@AgNPs average diameter \(\left( {\overline{D}_{{{\text{Au}}@{\text{Ag}}}} =36\,{\text{nm}}} \right)\) for core@shell volume estimation \((V_{{{\text{Au}}@{\text{Ag}}}} )\). So, shell volume is determined as \(V_{{{\text{Ag}}}} =V_{{{\text{Au}}@{\text{Ag}}}} - V_{{{\text{Au}}}}\). Total atomic content of Au and Ag was calculated considering an fcc crystalline structure (4 atoms per unit cell) for booth metals where the Au and Ag lattice parameters are 4.0783 Å and 4.0862 Å, respectively [93]. Atomic content estimation by this procedure is 70% for Ag (Shell) and 30% Au (Core), which differs by 10% concerning the measurement obtained by EDS. Figure 7 shows a theoretical estimation of silver and gold content and how varies as the thickness of the shell increases and the size of the core is kept constant (\(\overline{D}_{{{\text{Au}}}} =24\;{\text{nm}}\)). It is observed that for Au@AgNPs with a diameter greater than 30.2 nm, the atomic content of silver exceeds the content of gold. In Supplementary Material, a detailed description of calculation is carried out to obtain atomic contents percentage. Similar estimations of atomic percentages were carried out considering other Au-core diameters and varying Au@AgNPs diameter (Additional file 1:Figure S7A-B).
TEM and EDS of an Au@AgNPs group (a , b ) with Au 23 and Ag 77% at. and single Au@AgNPs (c , d ) with Au 20 and Ag 80% at
Variations of atomic content percentage versus increase thickness shell, where diameter AuNPs (24 nm) was kept constant
Figure 8 corresponds to XRD patterns for AuNPs and AgNPs as well as bimetallic Au@AgNPs. All the synthesized products have fcc crystalline structure as previously reported in the characterization by electron microscopy. Peaks for Au@AgNPs are located at 2θ diffraction angles of 38.25°, 44.4°, 64.9°, 77.85°, and 81.25°. As can be appreciated in the figure, the AgNPs and AuNPs diffraction peaks are found in the same positions mentioned with a difference of ± 0.5°. This is because Au and Ag have very similar lattice constants, so their diffraction patterns for fcc crystal structure are almost identical [94,95,96]. In this way, the diffraction peaks in Fig. 8 are assigned, respectively, to the crystalline planes (111), (200), (220), (311), and (222) of the gold and silver fcc structure by JCPDS:4-0783 and 4-0784 [97].
X-ray Diffraction AuNPs (pink), AgNPs (brown), and Au@AgNPs (red)
Antimicrobial Activity
Monometallic (AgNPs, AuNPs) and bimetallic (Au@AgNPs) materials were tested at four different concentrations:1, 10, 50, and 100 μg/mL. Selected microorganisms to evaluate antimicrobial activity were yeast Candida albicans , Gram-positive bacteria S.aureus , and Gram-negative bacteria E. 대장균 . Growth kinetics curves in a time-lapse of 24 h are shown in Fig. 9.
The growth curves using AuNPs, AgNPs, and Au@AgNPs like inhibitory treatments on Candida albicans (아 –ㄷ ), Escherichia coli (d –f ), and Staphylococcus aureus (지 –나 )
Candida albicans
AuNPs show no effect on growth kinetics until 10 h (Fig. 9a), varying in a dose-dependent manner the absorbance reached at 24 h. Interestingly, with 50 µg/mL or more, the growth kinetic shows a steep negative slope from 10 h until reaching a 45% reduction at 24 h, which suggests an antifungal effect of these materials. This can be attributed to the ability of gold nanoparticles to interact with relevant proteins present in fungus such as H
+
-ATPase, affecting proton pump activity. This atrophying the ability of yeast to incorporate nutrients causing its death [61]. In Fig. 9b and c was observed that AgNPs and Au@AgNPs inhibit the growth of the yeast Candida albicans from 10 µg/mL. The determination of the MIC50 concentration for both materials was estimated from the dose–response curve shown in Additional file 1:Figure S8. MIC50 is defined as the concentration of nanoparticles that produces a 50% decrease in absorbance concerning the control (yeast without treatment). For AgNPs and Au@AgNPs, MIC50 were 2.21 µg/mL and 2.37 µg/mL, respectively.
However, according to the EDS results (Fig. 9b), the silver content in Au@AgNPs is 64.85% mass. Thus, the concentration of silver in Au@AgNPs for MIC50 is 1.53 µg/mL, 30% lower than in the case of AgNPs. Padmos et. 알. have demonstrated that silver nanoparticles possess important antibacterial features, but are cytotoxic by mammalian cells this effect has reduced using bimetallic nanoparticles especially using gold in the core of bimetallic nanoparticles [35].
Escherichia coli
In Fig. 9d, AuNPs do not show significant inhibition (< 15%) or affect the growth kinetics of E. 대장균 . For AgNPs (Fig. 9e) at low concentrations, the Lag phase remains unchanged, but there is a marked decrease in growth ratio indicated by the slope decrement. At 50 µg/mL Lag phase lasts up to 16 h and viability reaches a maximum of 20% at 24 h. For 100 µg/mL, an apparent detachment of the growth phase of the microorganism is not observed. In Au@AgNPs (Fig. 9f), the first two concentrations do not show changes in their growth phase, but a phase delay of up to 2 h is observed compared to the control. It is interesting to note that the lag phase lasts up to 21 h for the 50 µg/mL concentration, finally there is no explicit growth behavior for the 100 µg/mL concentration.
Staphylococcus aureus
A comparative analysis of lag phase regrowth occurred after 12 h for Au (Fig. 9g), Ag (Fig. 9h), and Au@AgNPs (Fig. 9i) in the case of S. 구균 at 50 µg/mL. For the highest concentration at 100 µg/mL, there is no growth of the bacteria. Additionally, we observe changes in the slope of respect control for Au, Ag, and Au@AgNPs at 1 and 10 µg/mL.
AuNPs interaction with these Gram-positive bacteria could be due to the charged surface that causes an electrostatic interaction, destabilizing membrane structure. Similar results, but with higher NPs concentrations, are reported for AuNPs synthesized using Ananas comosus fruit extract as reducing agent [98] and blue-green alga Spirulina platensis protein [99]. Yang et al. show MIC > 500 µg/mL for S. 구균 (CMCC(B)26003), our AuNPs has shown inhibition with 10 times less concentration; in this case, a critical synergy exists with polyphenols molecules on coating and stabilizing the surface of nanoparticle [100]. ROS is generated of less to higher intensity [101] by AuNPs, polyphenols (plant extracts), and AgNPs, so AuNPs in synergy with resveratrol and epigallocatechin gallate (EGCG) promote antibacterial response over S. 구균 [102] had the most feasible mechanism in this case. Penders et al. reported 250 and 500 µg/mL of AuNPs-like antibacterial agents over S. 구균 increases in bacterial growth lag time and antibacterial effect [61, 98, 99].
We believe that inhibition is caused by AgNPs [103] accumulation and diffusion on bacteria related to NPs surface charges that promote electrostatic interactions [104] with the bacteria's membrane leading to higher penetration and damage. We think this is a similar mechanism described for interactions between E. 대장균 biofilms and AgNps [105].
For Au@AgNPs, the obtained results are comparable to those reported by other workgroups [100, 101]; however, different authors suggest that the inhibition of the growth of the microorganisms is directly related to the thickness of the shell [100, 101]. Core–shell NPs showed low cytotoxicity when tested in NIH-3T3 fibroblasts cells (normal mammalian cells) [35]. A lower proportion of silver in the shell of the Au@AgNPs shows similar results to AgNPs [100], and Au core potentializes antibacterial effect, and minimizes the cytotoxicity.
Curves Growth Analyzed by the Modified Gompertz Model
To know how the growth ratios (µ ) and Lag phase (λ ) are quantitatively modified, the growth curves of microorganisms exposed to different concentrations of nanomaterials (Fig. 10) were adjusted by the Gompertz model (Eq. 2).
Kinetic parameters were obtained by the Gompertz model. Growth Rate µ and Time Lag Phase \(\lambda\) for S. 구균 (아 , b ) and E. 대장균 (ㄷ , d )
In Fig. 10a, it can be seen that all nanomaterials produce a decrease in the replication rate of S. 구균 populations when the concentration of nanoparticles increases. This effect results in slightly higher sensitivity for AuNPs. At a concentration of 50 µg/mL, the growth ratio is only 30% concerning control (Additional file 1:Tables S1-S24); at a concentration of 100 µg/mL, all materials inhibit the growth of the S. 구균 인구. The behavior of the adaptive phase for S. 구균 with the different treatments is shown in Fig. 10b. It is observed that there are no significant differences in the material used, and at 50 µg/mL, the Lag phase has increased by almost 5 times compared to the adaptive phase of S. 구균 (Additional file 1:Tables S1-S24). In general, we can establish that the different nanomaterials evaluated in S. 구균 reduce the replication rate and postpone the adaptive phase in a dose-dependent manner until its inhibition at 100 µg/mL.
Figure 10c clearly shows that AuNPs do not affect the growth ratio µ of E. 대장균 bacteria. Meanwhile, AgNPs produce a decrease over µ , reaching a minimum value corresponding to 19% to the control (µ for E.coli without treatment) for 50 µg/mL (see Additional file 1:Table S52). In contrast, Au@AgNPs completely inhibit the E. 대장균 growth at 100 µg/mL. Analysis of the behavior of E. 대장균 Lag phase exposed to different materials is shown in Fig. 10d. In this case, unlike Fig. 10b, each material has a characteristic response. Thus, AuNPs do not generate any modification in the adaptive phase of E. 대장균 , while AgNPs and Au@AgNPs have a dose-dependent effect on the Lag phase, the latter material standing out. Thus, we can establish that AuNPs have no appreciable effect on E. 대장균 bacteria, and Au@AgNPs can inhibit replication and, therefore, indefinitely postpone the Lag phase of E. 대장균 . Interestingly, this effect is not achieved for AgNPs even though the net silver content is higher than in Au@AgNPs. This suggests that the core@shell presentation of both metals produces a synergy that favors antimicrobial activity. Feng et. 알. have reported an electron compensation phenomena from Au to Ag in core–shell and alloy structures, which derive in enhance the cytotoxicity of nanoparticles but kept it the antibacterial properties, that means, a synergy between Au and Ag are assumed, due to observed differences between the monometallic and bimetallic materials [106], but more research is necessary.
Figure 11 shows the results of the direct count study of colonies of microorganisms exposed to nanomaterials. In general, the behavior of the microorganism populations reproduces the results obtained from the growth kinetics study (Fig. 7a, e, i). For example, in Fig. 11a, the population of microorganisms (represented logarithmically) decreases significantly only at 19 h where AuNPs have killed 92% of C. albicans . Interestingly, for nanoparticles containing silver (Fig. 11b, c) a more pronounced population decline is observed. Au@AgNPs system at 50 µg/mL, almost entirely inhibits S. 구균 at 7 h (99.5% of bacteria killed) although microorganism reactivates its growth for later times. MBC determination was not possible to obtain for tested concentrations (Additional file 1:Figure S9-11), according to experimental observation higher concentrations are required to show this effect. However, for C. albicans , AgNPs showed an MBC value of 50 µg/mL (Additional file 1:Table S55).
Effect of nanoparticles over microorganisms growth C. albicans exposed to AuNPs (a ), E. 대장균 exposed to AgNPs (b ), and S. 구균 exposed to Au@AgNPs (c ). All microorganisms were exposed at 50 µg/mL nanoparticles concentration
Conclusions
For the first time, the production of gold nanoparticles and core@shell (Au@Ag) is reported using a Rumex hymenosepalus root extract as a reducing agent. To obtain Au@AgNPs is proposed a two-step sequential method that produces particles with moderate polydispersity and homogeneous silver shell. Determination of the growth curves and their parameters obtained through the Gompertz model indicate different effects of the nanomaterials on evaluated microorganisms. Inhibitory effects of AuNPs over S. 구균 are reached at a concentration of 5 times less to report for other AuNPs synthesized by different processes. This reveals the importance of the synthesis process followed and the environment on the surface of the nanoparticles. On the other hand, AgNPs and Au@AgNPs produce a great growth of the lag phase (> 12 h). However, bacteria can adapt and initiate their growth at these sub-inhibitory concentrations with the consequent risk of generating resistance to these nanomaterials. This highlights the importance of conducting growth kinetic studies that cover an appropriate period to discard a delayed growth. Interestingly, Gompertz's analysis indicates that Au@AgNPs present a higher effect on the growth kinetic of microorganisms than shown by monometallic nanoparticles, which can be attributed to a synergistic effect of both metals on the core@shell structure. Bactericidal effects are only achieved in C. albicans exposed to AgNPs. More experiments must be carried out on higher concentration ranges of these nanomaterials (> 200 µg/mL) to determine their MBC on the studied microorganisms.
데이터 및 자료의 가용성
All data generated or analyzed during this study are included in this article and its supplementary information file.
약어
AuNP:
금 나노 입자
AgNPs:
Silver nanoparticles
Au@AgNPs:
Gold–silver bimetallic nanoparticles with core@shell structure